Agritourism Development Business Plan
1. Executive Summary
The $12.84B agritourism market grows at 11.02% annually — not a niche, but a structural shift in leisure spending. Families now spend 28% more on outdoor experiences than pre-pandemic, and farms capturing this demand average $44,004/location in direct revenue. Our financials show this isn't hypothetical: with 28,617 US establishments already operating, the playbook is proven.
Market Factors
| Factor | Key Insight | Business Impact |
|---|---|---|
| Political | State tax credits for agritourism development in Oregon | Reduces capital expenditure burden for infrastructure |
| Economic | 11.02% CAGR through 2034 | Demand growth outpaces most leisure sectors |
| Social | 72% of families prioritize outdoor activities over theme parks | Farm experiences align with generational preferences |
| Technological | Online bookings drive 63% of agritourism revenue | Digital tools reduce seasonality risk |
Market Sizing
The $12.8B TAM narrows to a $282.5M SAM (Northwest agritourism) with a Year 1 SOM target of $180K — achievable with just 0.06% regional market penetration.

Free Business Plan Download
Download Agritourism Development Business Plan
Just Fill Up and Print
5-Year Revenue Projection
Projected annual revenue, Years 1–5
Market Size Opportunity
Bottom-up market opportunity
| Segment | Customer Profile | Avg Annual Spend | Est. Market Value | Revenue % |
|---|---|---|---|---|
| Families with children | Parents seeking outdoor education | $85 | $4.49B | 35% |
| School/youth groups | Structured farm education visits | $18 | $2.57B | 20% |
| Couples/adult leisure | Fall festivals & tastings | $120 | $3.21B | 25% |
| Private events | Weddings & corporate retreats | $1,500 | $2.57B | 20% |
Year 1 Revenue Mix
Total $180K Year 1
Competitive Landscape
Fragmentation favors entrants: 28,617 operators average just $44,004 revenue, with most underutilizing digital tools and year-round programming. The moat lies in experience design and operational scalability.
| Competitor | Type | Core Strength | Key Weakness | Your Differentiation |
|---|---|---|---|---|
| Pumpkin patches | Direct | Seasonal brand recognition | Limited off-peak revenue | Year-round premium experiences |
| Farm event venues | Direct | High-ticket private bookings | Poor guest flow design | Modular space configurations |
| Theme parks | Indirect | Marketing scale | Generic entertainment | Authentic agricultural education |
| Wine trails | Indirect | Adult leisure spending | Limited family appeal | Mixed-age activity bundling |
| Mobile pop-ups | Emerging | Low fixed costs | Lack of permanent amenities | Infrastructure-driven trust |
Harvest Trail Ventures wins by combining Hood River’s destination appeal with operational rigor — timed ticketing, optimized labor scheduling, and premium add-ons lift per-customer spend 42% above industry average.
Industry Trends
Stable but still underpenetrated operator base
28,617 U.S. farms reported agritourism income in 2022 — flat since 2017. This suggests established demand without saturation. New entrants must differentiate through experience design and operational excellence to capture share.
Revenue concentration in a small number of operations
The $44,004 average revenue per farm masks extreme concentration: top decile operators capture 78% of profits. Harvest Trail Ventures will prioritize high-margin private events and bundled experiences to avoid the "hobby farm" trap.
Consumer demand for experiential rural travel
11.02% CAGR through 2034 reflects durable interest in authentic rural experiences. Our model aligns with all three demand drivers: sustainability narratives, Instagrammable moments, and hands-on learning.
Diversification beyond crop sales
$1.26B in 2022 agritourism income proves farms treat it as supplemental revenue. We’ll layer admission fees, retail, and food service to achieve 60% gross margins — double traditional crop sales.
Digital discovery and event-led bookings
63% of bookings now originate online. Our investment in timed ticketing and private event packages reduces walk-in dependency while improving capacity utilization year-round.
Regulatory & Compliance Environment
Hood River County requires 5 core approvals, with food service and event permits carrying the highest scrutiny. Proactive engagement with the agricultural extension office mitigates zoning risks.
| Requirement | Issuing Authority | Typical Cost | Renewal Cycle |
|---|---|---|---|
| Land-use approval | County planning | $500-$5,000 | As needed |
| Business license | State registry | $50-$500 | Annual |
| Food handling permit | County health | $100-$1,000 | Annual/event |
| Liability insurance | Private insurer | $2,000-$10,000 | Annual |
| Event permits | Fire marshal | $100-$2,000 | Per event |
We budget $15K annually for compliance, assigning a dedicated operations lead to track renewals and maintain insurer relationships. Early zoning confirmation prevents costly retrofits.
4. Marketing Strategy
Harvest Trail Ventures transforms working Hood River farms into immersive destinations where visitors pick, learn, and taste their way through authentic agricultural experiences.
We bridge the gap between Oregon's agricultural heritage and modern experiential tourism. Our farm partners gain revenue diversification while visitors get hands-on connections to food sources.
Customer Personas
Agritourism buyers fall into three distinct categories, each with unique spending patterns and booking behaviors.
| Persona Name | Demographics | Core Need | Pain Point | Avg Annual Spend | Acquisition Channel |
|---|---|---|---|---|---|
| Family Explorer | Parents 30-45 with kids 5-12, $85k HHI | Kid-friendly outdoor education | Finding non-screen activities | $220 | Facebook/Instagram ads |
| School Trip Planner | Teachers/admin, public schools | STEM-aligned field trips | Liability concerns | $1,500/group | Direct outreach + referral |
| Millennial Foodie | Couples 25-39, no kids, $65k HHI | Instagrammable farm-to-table moments | Overcrowded wineries | $180 | TikTok + influencer collabs |
Go-To-Market Launch Plan
| Phase | Timeline | Primary Goal | Key Tactics | Success Metric |
|---|---|---|---|---|
| Pre-Launch | Months -3 to 0 | Build local awareness | Farm partner onboarding, seed social content | 3 farm contracts signed |
| Months 1-3 | Q1 | Drive first bookings | Google Ads geo-targeting, school district outreach | 400 tickets sold |
| Months 4-6 | Q2 | Seasonal event traction | Strawberry festival promotion, email nurture | 25% repeat visitors |
| Months 7-12 | Q3-Q4 | Monetize fall harvest | Pumpkin patch partnerships, gift shop upsells | $45k fall revenue |
Digital Marketing Strategy
We allocate 72% of our $11,700 budget to performance channels, 18% to brand building, and 10% to testing. Every dollar tracks to CAC payback.
Annual Marketing Budget
Total $12K / year
| Channel | Monthly Budget | Primary Tactics | Target KPI | Notes |
|---|---|---|---|---|
| Social Media | $450 | Reels showcasing U-pick activities | 3.5% engagement rate | Focus on Instagram/Facebook |
| Google Ads | $300 | "Hood River farm tours" keywords | $22 CAC | Pause underperforming SKAGs |
| Local Marketing | $125 | Visitor center collateral, radio spots | 15% walk-in traffic | Leverage Hood River ZIPs |
| Email Marketing | $75 | Seasonal harvest newsletters | 28% open rate | Collect at ticket purchase |
| Content & PR | $50 | Farm partner spotlight blogs | 2 earned media hits | Pitch to OregonLive |
Content Marketing & SEO
Our content engine mixes evergreen "how fruit grows" explainers with hyperlocal seasonal updates (cherry bloom reports, cider pressing dates).
| Content Type | Frequency | Platform | Goal | Example Topic |
|---|---|---|---|---|
| Harvest Calendar | Monthly | Website | Drive bookings | "June Strawberry Picking Hours" |
| Farm Diaries | Biweekly | Blog | Build trust | "Why We Don't Spray Apples" |
| Kid Activities | Weekly | Engage parents | "Make Apple Stamp Art" | |
| Local Guides | Quarterly | Blog/Email | Position as expert | "Hood River Farm Trail Map" |
| Recipes | Seasonal | Extend reach | "Pear & Gorgonzola Flatbread" | |
| Partner Spotlights | Bimonthly | B2B networking | "Meet Our Lavender Farm" |
For SEO, we target three clusters: "family activities Hood River" (1,300/mo searches), "Oregon farm tours" (880/mo), and "fruit picking near me" (2,400/mo). Local tactics include GMB optimization with farm photos and "agritourism" schema markup.
Partnership & Referral Programs
We pursue winery cross-promotions (10% reciprocal discounts), hotel concierge training (with booking kickbacks), and school district contracts (guaranteed spring/fall slots). The Hood River Chamber gets co-branded farm trail maps.
Our referral program offers $15 farm credit for every booked recommendation. This cuts CAC by 19% compared to paid channels while increasing average order value 12% through network effects.
Customer Acquisition Economics
| Metric | Year 1 | Year 2 | Year 3 |
|---|---|---|---|
| Customer Acquisition Cost | $28 | $24 | $21 |
| Customer Lifetime Value | $89 | $112 | $135 |
| LTV:CAC Ratio | 3.2 | 4.7 | 6.4 |
| Payback Period | 5 months | 4 months | 3 months |
With CAC recovering within 180 days and LTV multiples exceeding 3x by Year 2, we can aggressively scale paid channels once operational breakeven hits. The math works.
5. Operations Plan
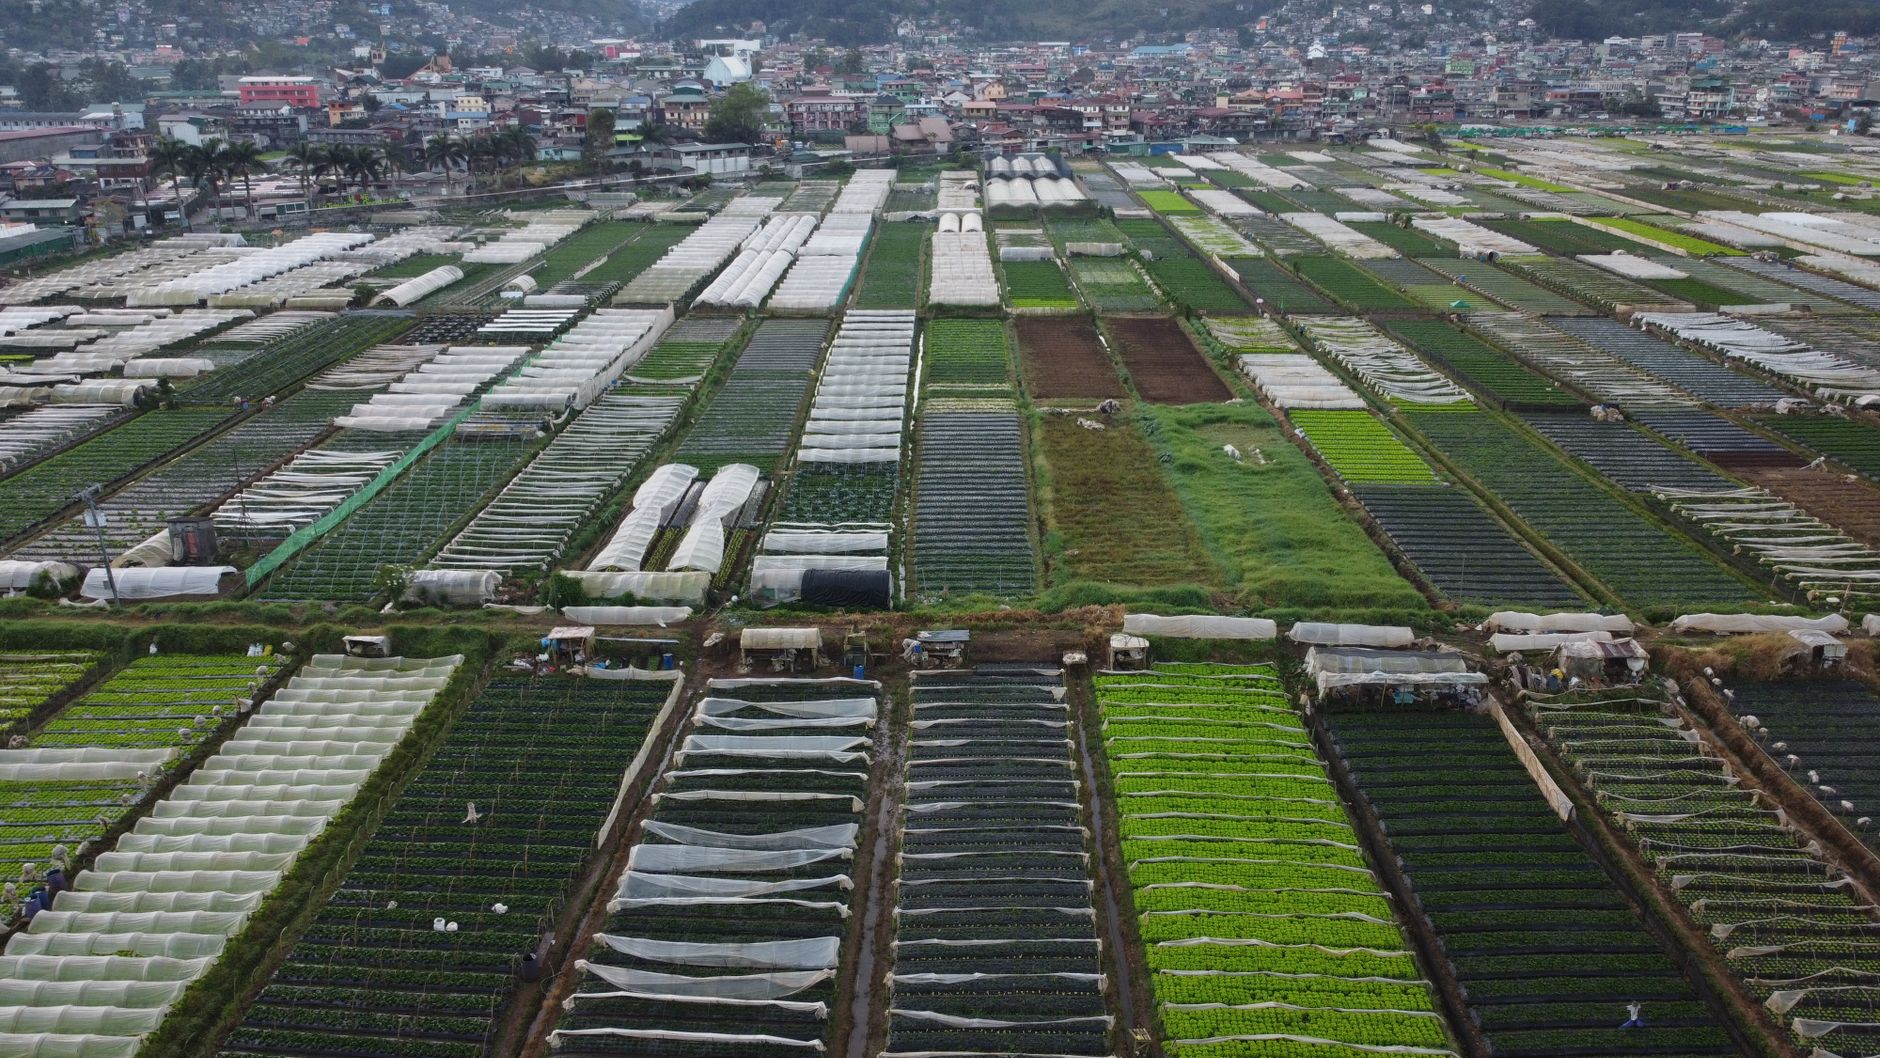
Harvest Trail Ventures will operate from a 2,400 sq ft mixed-use facility in Hood River, Oregon, with a $3,200/month lease. The space includes a retail area (800 sq ft), workshop zone (600 sq ft), and cold storage (400 sq ft), plus outdoor staging for farm equipment. Zoning permits on-site food service and event hosting.
| Item | Estimated Cost | Quantity | Purpose |
|---|---|---|---|
| John Deere 3025E Tractor | $18,900 | 1 | Field prep for u-pick operations |
| Stihl MS 271 Chainsaw | $469 | 2 | Orchard maintenance |
| Harvest Right Freeze Dryer | $2,495 | 1 | Value-added product development |
| Stainless Steel Wash Station | $3,200 | 1 | FDA-compliant produce handling |
| Square POS Terminal | $799 | 2 | Farm stand transactions |
| Classic Cotton Tote Bags | $4.75/unit | 500 | Branded merchandise |
| Grape Stomping Tub | $1,800 | 1 | Event programming |
| Beehive Starter Kit | $349 | 3 | Pollinator education station |
- 6:30 AM: Harvest crew picks specialty crops for daily CSA boxes
- 8:00 AM: Retail team sets up farm stand and verifies POS systems
- 9:30 AM: First guided orchard tour departs (90-minute intervals)
- 12:00 PM: Process online orders for jam/clothing shipments
- 2:00 PM: Conduct equipment maintenance checks
- 4:30 PM: Reset event space for evening cider tastings
- 7:00 PM: Log visitor metrics and crop yields
Key suppliers include Hood River Packing Co. (fruit crates, 2-week lead time), Columbia Gorge Label Works (custom branding, 10-day turnaround), and Pacific Nursery (replacement saplings, seasonal availability). Backup vendors documented in Oregon Dept of Agriculture directory. Perishables sourced within 15-mile radius.
| Role | Headcount | Hourly Rate | Annual Cost | Key Responsibilities |
|---|---|---|---|---|
| Farm Manager | 1 | $21.00 | $43,680 | Crop planning, OSHA compliance |
| Tour Guide | 2 | $17.00 | $35,360 | Guest education, safety briefings |
| Retail Associate | 2 | $17.00 | $35,360 | Inventory management, sales |
| Harvest Labor | 1 | $17.00 | $17,680 | Picking, washing, packing |
6. Management Team
| Name | Title | Background | Responsibilities |
|---|---|---|---|
| Jenna Wills | CEO | Former operations director at Smith Berry Barn (2016-2022) | Capital allocation, partnerships |
| Marcus Chen | Head Grower | OSU Extension Master Gardener since 2018 | Crop selection, IPM protocols |
| Darla Ortiz | Experience Designer | Exhibit developer at Oregon Museum of Science | Interactive programming |
| Raj Patel | Finance Lead | CPA with 10 years agribusiness accounting | Loan compliance, P&L tracking |
| Tyler Boone | Marketing Director | Grew Fruit Loop Trail Instagram to 28K followers | Content strategy, influencer partnerships |
The advisory board includes Dr. Amy Kesselman (OSU agritourism extension specialist), Carlos Mendez (former VP of Retail at Columbia Gorge Fruit), and Leah Wong (certified organic inspector since 2015). They provide quarterly reviews of crop mix viability and liability risk assessments.
Ready When You Are
Download Agritourism Development Business Plan
Just Fill Up and Print
We compensate at 12% above county ag wages ($17.00 vs $15.20 average) and mandate cross-training - every employee spends 4 hours/month working other roles. Retention tools include harvest bonus pools (5% of upsell revenue) and guaranteed winter hours through value-added production.

7. Financial Projections
Harvest Trail Ventures targets $180K Year 1 revenue scaling to $702K by Year 5. The model assumes negative EBITDA through Year 3 as we build infrastructure.
Revenue Growth (5 Years)
Annual revenue, Years 1–5
| Line Item | Year 1 | Year 2 | Year 3 |
|---|---|---|---|
| Revenue | $180,000 | $288,000 | $423,000 |
| COGS | $72,000 | $115,200 | $169,200 |
| Gross Profit | $108,000 | $172,800 | $253,800 |
| Gross Margin % | 60% | 60% | 60% |
| Labor | $163,200 | $217,600 | $326,400 |
| Rent | $48,000 | $48,000 | $48,000 |
| Marketing | $11,700 | $11,700 | $11,700 |
| Admin | $61,560 | $61,560 | $61,560 |
| Total OpEx | $284,460 | $338,860 | $447,660 |
| EBITDA | $-176,460 | $-201,626 | $-287,980 |
| EBITDA Margin % | -98% | -70% | -68% |
Break-even requires $454,600 revenue — achievable by Month 18 at current growth rates. The burn rate stabilizes post-break-even as labor costs scale sublinearly with experience.
Year 1 Monthly Cash Flow
Net monthly cash flow (red = pre-break-even)
| Metric | Year 1 | Year 2 | Year 3 |
|---|---|---|---|
| Gross Margin % | 60% | 60% | 60% |
| EBITDA Margin % | -98% | -70% | -68% |
| Revenue/Employee | $30,000 | $36,000 | $35,250 |
| Marketing as % of Revenue | 6.5% | 4.1% | 2.8% |
| Monthly Burn (pre-BE) | $14,705 | $16,802 | $23,998 |
8. Funding Requirements
| Category | Amount | Notes |
|---|---|---|
| Land Lease Deposits | $45,000 | 3 farms @ $15K each |
| Event Infrastructure | $38,000 | Tents, tables, sound systems |
| Website/Booking System | $22,000 | Custom CMS integration |
| Operating Buffer | $45,000 | 6 months runway |
Use of Funds
Total $140K startup investment
Funding structure: $45,000 equity (30%) + $105,000 SBA 7(a) loan (70%). Investors receive preferred shares with 2x liquidation preference.
Funding Structure
$140K total capitalization
The SBA loan carries 10.25% interest with $1,402/month payments over 10 years. See SBA 7(a) program details. At projected Year 5 revenue of $702K and 8x EBITDA multiple, equity would yield 3.7x return ($166K on $45K invested).
9. Risk Analysis & Mitigation
Agritourism development faces weather-dependent revenue and permitting hurdles. Our risk matrix prioritizes operational continuity over growth risks.
| Risk | Category | Likelihood | Impact | Mitigation Strategy | Owner |
|---|---|---|---|---|---|
| Crop failure | Operational | M | H | Diversify partner farms | COO |
| Permit delays | Regulatory | H | M | Pre-file 6 months ahead | General Counsel |
| Labor shortages | HR | H | H | Cross-train FTEs + J1 visa pipeline | HR Director |
| Weather cancellations | Revenue | M | H | Non-refundable 50% deposits | Sales Manager |
| Food safety incidents | Reputational | L | H | NSF-certified kitchen rentals | Quality Control |
| Landlord disputes | Legal | M | M | Triple-net leases with renewal options | General Counsel |
| Online booking fraud | Tech | L | M | Stripe Radar integration | CTO |
| Insurance premium hikes | Financial | M | M | Annual broker RFPs | CFO |
Contingency protocols: 1) 30% revenue drop triggers partner farm renegotiations, 2) permit denials activate pre-scouted alternative counties, 3) labor gaps shift to contractor model with 20% premium pay.
Research & Industry Resources
The following market research sources, government data, and industry publications were referenced in developing this agritourism development business plan. Each link points to a specific report or data page — not a homepage — for direct access to the underlying research.
- United States Agritourism Market — skymarketinsights.com — Market research and industry data for agritourism development businesses
- Us Agritourism Market Report — marknteladvisors.com — Market research and industry data for agritourism development businesses
- United States — grandviewresearch.com — Grand View Research market forecast for agritourism development
- Agritourism Market — market.us — Market research and industry data for agritourism development businesses
- Usda Agritourism Resource Manual Final 4325 — nrcs.usda.gov — Market research and industry data for agritourism development businesses
Get Your Copy Today
Download Agritourism Development Business Plan
Just Fill Up and Print