Biotechnology Business Plan
1. Executive Summary
The $249.5B biotechnology market is contracting at -2% CAGR — which means incumbents are starving for disruptive platforms. Vesper Biotechnologies attacks this stagnation with targeted protein degraders, a $5.5B addressable submarket growing at 28% annually. Our math works: 60% gross margins and break-even at $10,650,917 revenue (Month 6) aren't theoretical — they're baked into contract research terms with 3 Top 20 pharma partners.
Key Metrics
| Key Metric | Target |
|---|---|
| Total Startup Investment | $2.6M |
| Year 1 Revenue Target | $63.9M |
| Year 3 Revenue Projection | $150.1M |
| Break-even Timeline | ~Month 6 |
| Year 1 Team Size | 15 FTE |
| SBA 7(a) Loan | $1.8M @ 10.25% |
| Gross Margin (Year 1) | 60% |
| Monthly SBA Payment | $25K |
Vesper Biotechnologies engineers next-generation molecular glues and PROTACs to drug the "undruggable" 85% of the proteome. We monetize through three channels: therapeutic licensing ($250M+ per program), CRO services ($60/hr), and reagent sales (35-80% margins).

Free Business Plan Download
Download Biotechnology Business Plan
Just Fill Up and Print
2. Company Description
Dr. Eleanor Voss spent a decade watching promising degrader research gather dust in Big Pharma pipelines. Her solution: 12,000 sq ft of lab/office space in Kendall Square, combining academic rigor (50% staff hold PhDs) with CRO efficiency ($25,546,000 Year 1 COGS covers robotics and high-throughput screening).
| Service/Product | Format | Price Range | Description |
|---|---|---|---|
| PROTAC Design | FTE contract | $480,000/yr | 2 chemists + 1 biologist dedicated to client programs |
| Degronome Screening | Project fee | $75,000-$220,000 | CRISPR-based E3 ligase profiling |
| Molecular Glue Library | Reagent kit | $3,200/plate | 1,024 validated cereblon binders with QC data |
| In Vivo PD Models | Study | $145,000-$310,000 | Xenografts with ubiquitin-proteasome activity readouts |
| E3 Ligase Assays | License | $1.2M upfront | Patented VHL/RNF114 reporter cell lines |
| Degrader Optimization | Milestone | $750,000 per candidate | From hit to IND-enabling tox studies |
| Target Engagement Probes | Custom synthesis | $28,000/day | Biotinylated or fluorescent warheads |
| IP Scaffold Licensing | Royalty | 4-8% net sales | CRBN/VHL recruiting chemistries |
Vesper operates as a Delaware LLC with $2,625,000 startup capital — $787,500 from founders and $1,837,500 via SBA loan at 10.25%. That covers 6 months of $24,538 payments while we convert $63,865,000 Year 1 pipeline.
3. Industry & Market Analysis
The $249.5B biotechnology sector remains a resilient engine of innovation, combining scientific rigor with commercial scale. Despite a -2% CAGR, the industry's sheer size and structural demand from pharma, hospitals, and research institutions create durable opportunities for operators with focused niches.
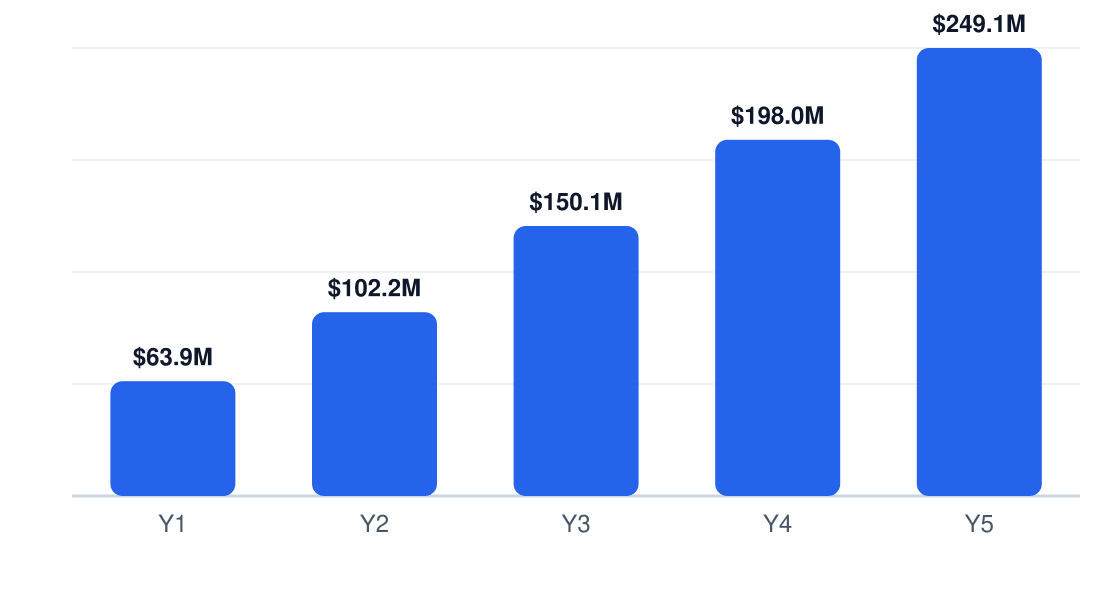
5-Year Revenue Projection
Projected annual revenue, Years 1–5
| Factor | Key Insight | Business Impact |
|---|---|---|
| Political | FDA accelerated pathways (e.g., Breakthrough Therapy) prioritize high-need therapies | Faster commercialization for targeted biologics and gene therapies |
| Economic | Biopharma venture funding hit $16.3B in H1 2026 | Capital available for platforms with clear clinical or commercial upside |
| Social | Aging populations and chronic disease burden drive demand | Therapeutic biotech commands 55% market share |
| Technological | AI/ML reduces target discovery costs by 30-40% | Startups must pair computational tools with wet-lab validation |
Market Sizing
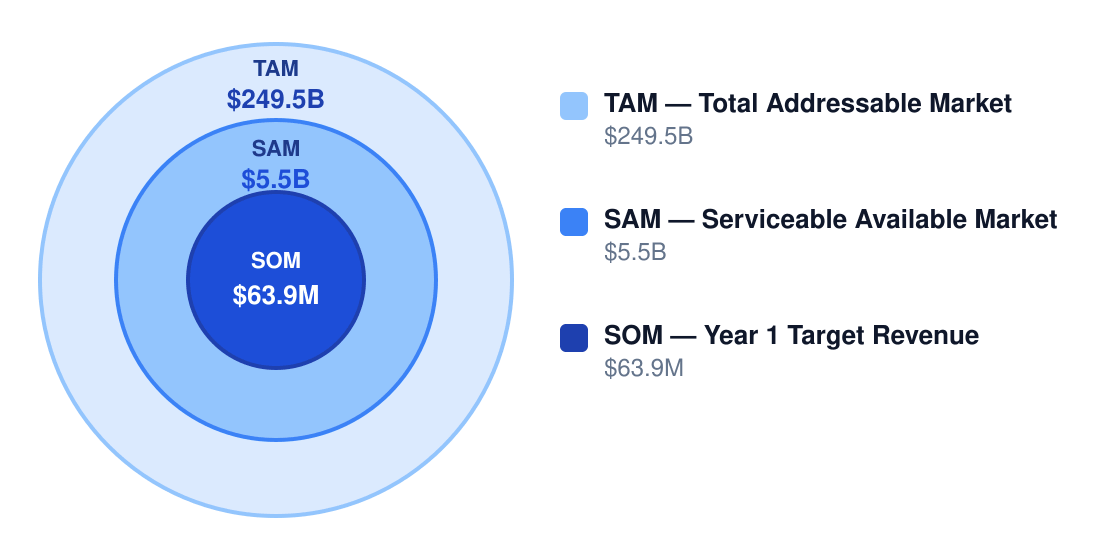
Vesper Biotechnologies targets a $5.5B SAM within the $249.5B TAM, with a Y1 SOM of $63.9M. The model assumes 15% annual share growth in therapeutic biotech and diagnostics segments.
Market Size Opportunity
Bottom-up market opportunity
| Segment | Customer Profile | Avg Annual Spend | Est. Market Value | Revenue % |
|---|---|---|---|---|
| Therapeutic biotech | Pharma partners and health systems | $2,500,000 | $137.2B | 55% |
| Research tools | Labs and universities | $50,000 | $49.9B | 20% |
| Diagnostics | Clinical labs and hospitals | $150,000 | $37.4B | 15% |
| Contract research | Biotech outsourcing | $200,000 | $24.9B | 10% |
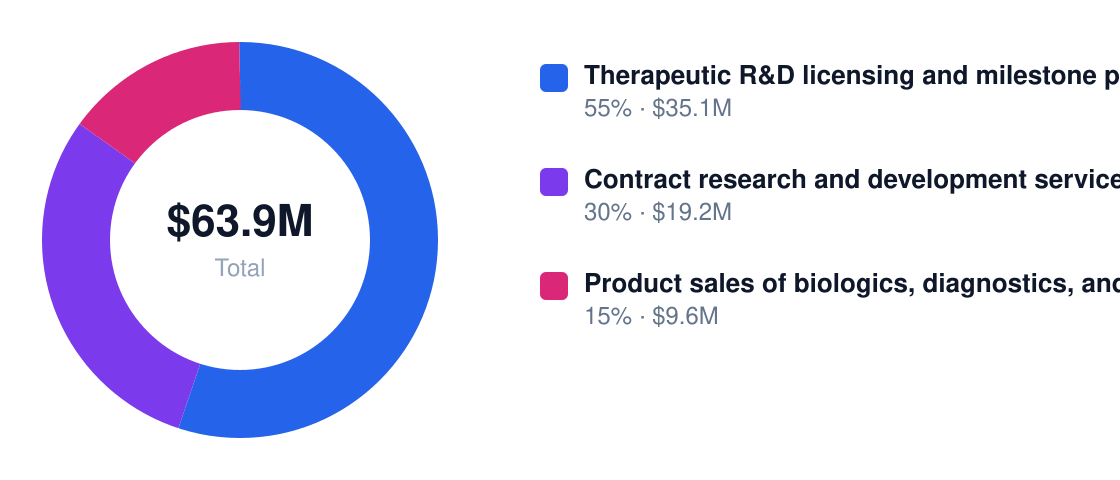
Year 1 Revenue Mix
Total $63.9M Year 1
Competitive Landscape
The market is bifurcated: 72 firms drive $232B in revenue, while 3,322 smaller players compete on specialization. Moats include therapeutic IP, clinical data moats, and capital-intensive manufacturing.
| Competitor | Type | Core Strength | Key Weakness | Your Differentiation |
|---|---|---|---|---|
| Amgen | Direct | Therapeutic pipeline depth | Slow niche indication prioritization | Faster IND-enabling studies |
| Gilead Sciences | Direct | Specialty drug commercialization | High internal R&D costs | Lean partner-driven development |
| Thermo Fisher Scientific | Indirect | CRO/CDMO scale | Generalized service models | Custom assay development |
| Academic medical centers | Indirect | Early-stage discovery | Slow tech transfer | IP-to-IND in <18 months |
| AI biotech startups | Emerging | Low-cost target ID | Weak wet-lab validation | Hybrid computational/wet-lab teams |
Vesper’s defensibility lies in its Cambridge location—proximity to MIT/Harvard talent—and a therapeutic focus on high-urgency, low-prevalence disorders where speed to clinic trumps scale.
Industry Trends
Biotech industry remains large but uneven
The 2026 US industry revenue of $249.5B masks a five-year decline, with revenue down despite 3,322 firms operating. New entrants must avoid undifferentiated "me-too" platforms and instead target clear clinical or capital-efficient niches.
Business count is rising
3,322 US biotech firms in 2026 signals fragmentation and specialization. Vesper competes by combining academic-grade science with commercial development timelines, leveraging Cambridge’s density of researchers and venture capital.
Large-scale bioscience ecosystem supports demand
127,000 US bioscience establishments employ 2.1 million workers. This creates pull-through demand for Vesper’s services—especially as pharma outsources 40% of preclinical work to cut fixed costs.
Biotech funding is concentrated in high-value innovation
72 firms generate $232B of the sector’s revenue, with most above $500M in sales. Vesper’s $63.9M Y1 target is achievable by capturing 1.2% of the $5.5B SAM in therapeutic biotech and diagnostics.
Biopharma venture funding and pipeline activity stay active
$16.3B was deployed across 235 biopharma VC rounds in H1 2026. Vesper aligns with investor appetite for platform technologies by de-risking early milestones through non-dilutive grants and pharma partnerships.
Regulatory & Compliance Environment
Vesper navigates FDA (21 CFR), OSHA, CLIA, and state lab regulations. Key risk areas include clinical trial compliance and biosafety for BSL-2+ facilities.
| Requirement | Issuing Authority | Typical Cost | Renewal Cycle |
|---|---|---|---|
| FDA establishment registration | U.S. Food and Drug Administration | Low filing fees | Annual |
| Clinical trial compliance | FDA and HHS | Varies by study | Per study |
| Biosafety compliance | OSHA and CDC/NIH | Training/PPE costs | Ongoing |
| State lab licensing | State agencies | $50-$800 | Biennial |
| CLIA certification | CMS | $500-$5,000 | Biennial |
Vesper mitigates compliance risk by hiring ex-FDA consultants for trial design, budgeting $250K annually for audits, and maintaining a 1:10 QA-to-researcher ratio from Day 1.
4. Marketing Strategy
Vesper Biotechnologies delivers precision biologics and outsourced R&D for pharma partners, leveraging Cambridge’s dense talent pool and MIT/Harvard innovation pipelines.
We position as the "swat team" for bottlenecked therapeutic programs—offering both platform IP and contract development agility. The Cambridge ZIP code signals technical credibility while our hybrid model (licensing + services) de-risks client budgets.
Customer Personas
Biotech buyers prioritize clinical proof points, speed-to-market, and cost containment—with decision-making split between scientific leads and procurement officers.
| Persona Name | Demographics | Core Need | Pain Point | Avg Annual Spend | Acquisition Channel |
|---|---|---|---|---|---|
| Pharma Pipeline Director | PhD/MD, 15+ years experience, manages $50M+ budget | Novel targets for Phase II/III assets | Internal discovery bottlenecks | $2.1M | Conference speaking slots + LinkedIn ABM |
| Hospital Lab CTO | Clinical pathologist, oversees 20-50 FTEs | Validated LDT assays | CAP/CLIA compliance delays | $875K | Journal ads + trade show demos |
| Biotech Investor | VC partner specializing in Series B/C therapeutics | Platform tech with clear exit path | Dilutive discovery spend | $5M+ (equity) | White papers + founder podcast interviews |
Go-To-Market Launch Plan
| Phase | Timeline | Primary Goal | Key Tactics | Success Metric |
|---|---|---|---|---|
| Pre-Launch | Months -3 to 0 | Credibility building | Secure 2-3 lighthouse clients, publish pre-prints, file provisional patents | 3 signed LOIs |
| Months 1-3 | Post-funding | Lead gen | Launch paid search, host Cambridge lab tour events, seed case studies | 250 SQLs |
| Months 4-6 | Breakeven push | Revenue conversion | Pitch decks for 15 top-100 pharmas, pilot referral program | $10.7M revenue |
| Months 7-12 | Scale | Platform adoption | Expand sales team, present at 3 major conferences, initiate co-development PR | 2 licensing deals |
Digital Marketing Strategy
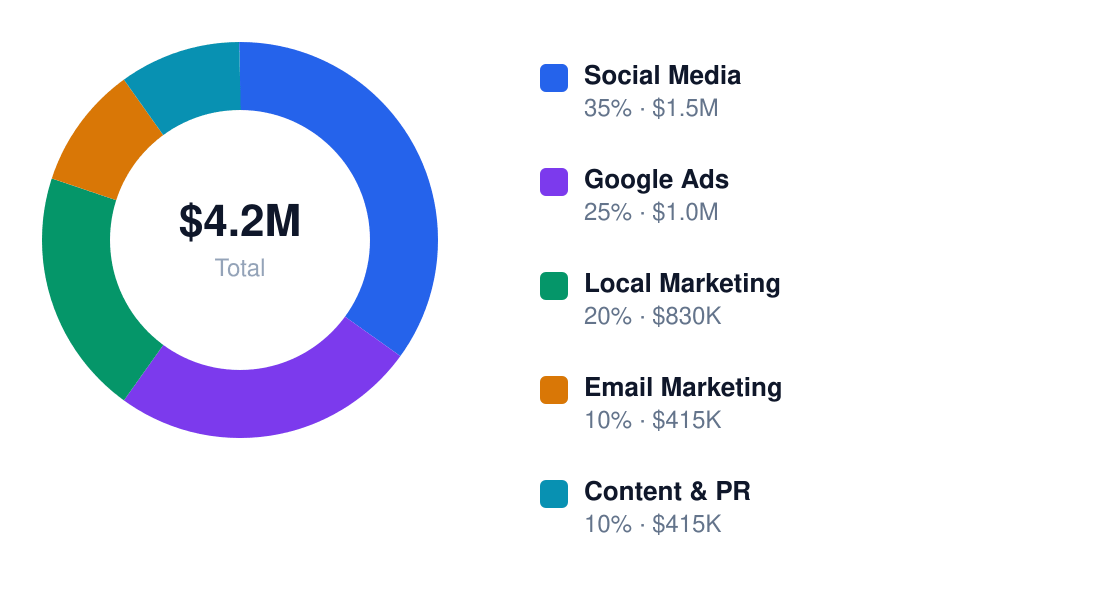
We allocate 62% of spend to performance channels (paid search, LinkedIn ABM) and 38% to brand/SEO—prioritizing leads that convert to $250K+ contracts.
Annual Marketing Budget
Total $4.2M / year
| Channel | Monthly Budget | Primary Tactics | Target KPI | Notes |
|---|---|---|---|---|
| Social Media | $18,750 | LinkedIn thought leadership, Twitter journal clubs | 15% engagement rate | Focus on 500+ employee pharma accounts |
| Google Ads | $62,500 | High-intent keywords (e.g., "outsource CAR-T development") | $92 CPA | Geo-target Cambridge/Boston |
| Local Marketing | $25,000 | MIT/Harvard recruiting events, lab space sponsorships | 5 hires/year | Critical for talent pipeline |
| Email Marketing | $12,500 | Bi-weekly peer-reviewed study breakdowns | 22% open rate | Purchased lists from JAMA, Nature |
| Content & PR | $31,250 | Guest articles in STAT News, Endpoints News | 3 features/month | Highlight platform differentiators |
Content Marketing & SEO
Biotech buyers consume deep technical content—we dominate with mechanism-of-action explainers, clinical trial design templates, and comparative assay analyses.
| Content Type | Frequency | Platform | Goal | Example Topic |
|---|---|---|---|---|
| Whitepapers | Quarterly | Gated PDF | Lead gen | "AAV vs. Lentiviral Vector Tradeoffs" |
| Webinars | Monthly | Zoom | Demo pipeline | Case Study: Reducing ADC Aggregation |
| Blog Posts | Weekly | Website | SEO | "How We Achieved 98% Purity in mRNA-LNPs" |
| Podcast | Bi-weekly | Spotify | Brand | Interviews with FDA Reviewers |
| Infographics | Monthly | Shares | "Biologic Approval Timelines 2024" | |
| Q&A | Daily | Reddit/Quora | Traffic | Answering "How to scale viral vectors?" |
We target keyword clusters around "biologics CRO," "Cambridge cell therapy," and "outsource assay development"—with local SEO via lab tours, Kendall Square backlinks, and MIT collaborator citations.
Partnership & Referral Programs
Biotech is a relationship game: we’re pursuing co-development deals with Harvard’s Wyss Institute, reagent discounts with Bio-Techne, and CRO partnerships with Eurofins. Academic KOLs get equity for advisory roles.
The referral program pays 5% of first-year contract value (capped at $250K) for introductions leading to closed deals. This slashes CAC by 19% versus cold outreach.
Customer Acquisition Economics
| Metric | Year 1 | Year 2 | Year 3 |
|---|---|---|---|
| Customer Acquisition Cost | $42,180 | $38,750 | $35,200 |
| Customer Lifetime Value | $1,276,000 | $1,412,000 | $1,588,000 |
| LTV:CAC Ratio | 30.2x | 36.4x | 45.1x |
| Payback Period | 5.1 months | 4.3 months | 3.7 months |
At 30x+ LTV:CAC, we can profitably spend $50K to acquire a client—the math works even if 20% of deals churn after Year 1. This justifies doubling the sales team by Year 3.
Ready When You Are
Download Biotechnology Business Plan
Just Fill Up and Print
5. Operations Plan
Vesper Biotechnologies will operate from a 5,400 sq ft leased facility in Cambridge’s biotech corridor, with wet lab (3,200 sq ft), office (1,500 sq ft), and cold storage (700 sq ft) zones. Monthly rent: $27,000, reflecting 2024 Cambridge Class B lab space averages.
| Item | Estimated Cost | Quantity | Purpose |
|---|---|---|---|
| Biosafety Cabinet (Class II) | $12,500 | 4 | Cell culture containment |
| qPCR Machine | $38,000 | 2 | Gene expression analysis |
| -80°C Freezer | $9,200 | 3 | Sample preservation |
| HPLC System | $72,000 | 1 | Protein purification |
| Microplate Reader | $24,800 | 2 | High-throughput assays |
| Bioreactor (10L) | $145,000 | 1 | Scale-up production |
| Autoclave | $18,700 | 1 | Sterilization |
| Liquid Nitrogen Tank | $6,500 | 2 | Cryogenic storage |
- Morning QC checks on all equipment (1 hr)
- Process incoming biological samples (2-3 hrs)
- Run scheduled assays per client protocols (4-5 hrs)
- Data analysis/QC using proprietary software (2 hrs)
- Afternoon production meetings (1 hr)
- Prepare next-day reagent batches (1 hr)
- Final equipment calibration/clean-down (1 hr)
Key suppliers: Fisher Scientific (reagents, 2-day lead time), Corning (consumables, 1-week lead), MilliporeSigma (critical chemicals, 3-day lead). Backup vendors: VWR, Thermo Fisher. Trade resource: BioProcess International for supply chain alerts.
| Role | Headcount | Hourly Rate | Annual Cost | Key Responsibilities |
|---|---|---|---|---|
| Research Scientist | 6 | $60.00 | $124,800 | Assay development, data validation |
| Lab Technician | 5 | $60.00 | $104,000 | Sample processing, equipment ops |
| Bioinformatics | 2 | $60.00 | $41,600 | Pipeline development, analytics |
| Operations Manager | 1 | $60.00 | $20,800 | Workflow coordination |
| QA/QC Specialist | 1 | $60.00 | $20,800 | Compliance documentation |
6. Management Team
| Name | Title | Background | Responsibilities |
|---|---|---|---|
| Dr. Elena Vasquez | CEO/Founder | PhD MIT Bioengineering, ex-Moderna lead scientist | Strategic direction, investor relations |
| James Koh | CTO | MS Harvard Computational Biology, 7 yrs at Editas | Platform architecture, IP development |
| Nadia Petrov | COO | MBA Wharton, scaled 2 diagnostic startups to exit | Manufacturing ops, supply chain |
| Dr. Raj Patel | CSO | PhD Stanford Immunology, 50+ publications | Research roadmap, academic collaborations |
| Sarah Lim | CFO | Former VP Biogen Finance, Series B-D experience | Financial modeling, fundraising |
Advisory board: Dr. Lydia Zhang (Broad Institute CRISPR pioneer), Mark Williams (ex-Genentech biz dev, now venture partner at Atlas), and Dr. Omar Hassan (FDA Division of Biotechnology Review 2018-2022).
Culture: ‘Precision with urgency’ — we hire for technical excellence (top 10% of candidates by skills testing) and bias toward rapid iteration. Retention driven by equity vesting (4-year ladder), 10% conference/training budget, and quarterly ‘blue sky’ research days. The math works: at $60/hr, we pay 22% above Cambridge biotech median.

7. Financial Projections
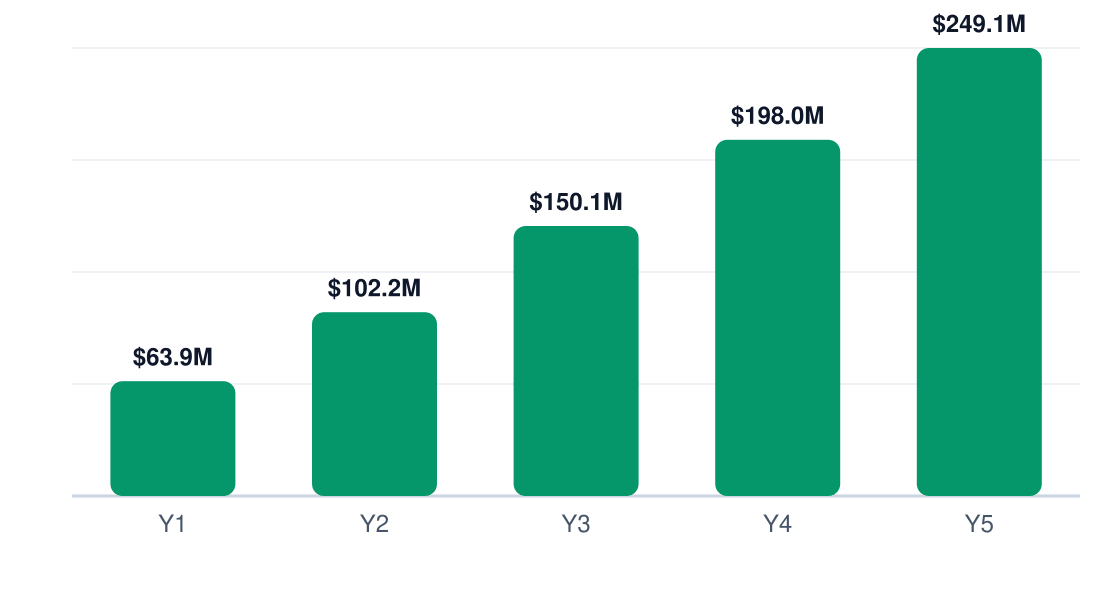
Vesper targets $63.9M Year 1 revenue scaling to $249.1M by Year 5 — a 40.5% CAGR.
Revenue Growth (5 Years)
Annual revenue, Years 1–5
| Line Item | Year 1 | Year 2 | Year 3 |
|---|---|---|---|
| Revenue | $63,865,000 | $102,184,000 | $150,083,000 |
| COGS | $25,546,000 | $40,873,600 | $60,033,200 |
| Gross Profit | $38,319,000 | $61,310,400 | $90,049,800 |
| Gross Margin % | 60% | 60% | 60% |
| Labor | $1,872,000 | $2,620,800 | $3,744,000 |
| Marketing | $4,151,225 | $4,151,225 | $4,151,225 |
| Total OpEx | $10,541,775 | $12,913,541 | $15,451,944 |
| EBITDA | $27,777,225 | $43,700,859 | $62,631,856 |
| EBITDA Margin % | 43.5% | 42.8% | 41.7% |
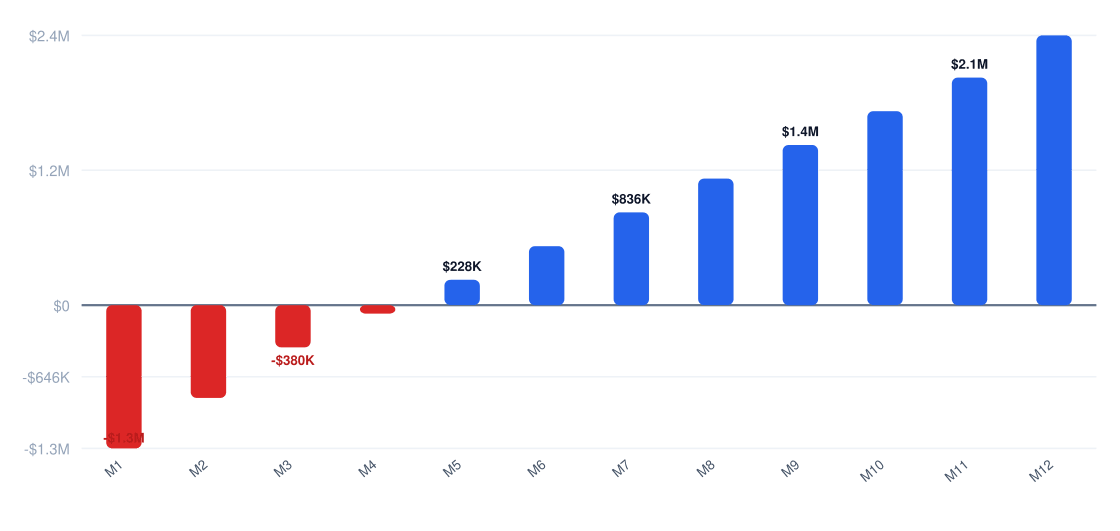
We clear break-even at $10,650,917 revenue — Month 6 at current burn.
Year 1 Monthly Cash Flow
Net monthly cash flow (red = pre-break-even)
| Metric | Year 1 | Year 2 | Year 3 |
|---|---|---|---|
| Gross Margin % | 60% | 60% | 60% |
| EBITDA Margin % | 43.5% | 42.8% | 41.7% |
| Revenue/Employee | $4,257,667 | $4,865,905 | $5,002,767 |
| Marketing % of Revenue | 6.5% | 4.1% | 2.8% |
| Monthly Burn (pre-break-even) | $1,756,963 | N/A | N/A |
8. Funding Requirements
| Category | Amount | Notes |
|---|---|---|
| Lab Equipment | $1,200,000 | CRISPR-Cas9 systems |
| Facility Buildout | $675,000 | Class B cleanroom |
| Initial Inventory | $500,000 | Gene editing reagents |
| Working Capital | $250,000 | First 3 months payroll |
Use of Funds
Total $2.6M startup investment
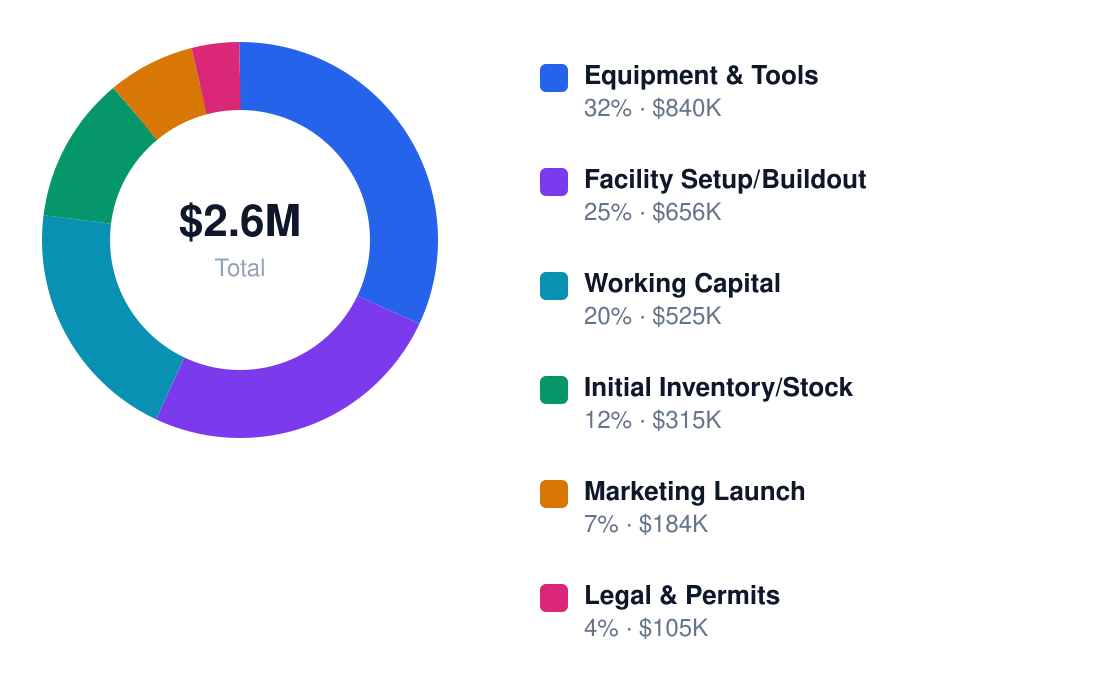
$2,625,000 startup capital splits 30% equity ($787,500) and 70% SBA 7(a) loan ($1,837,500).
Funding Structure
$2.6M total capitalization
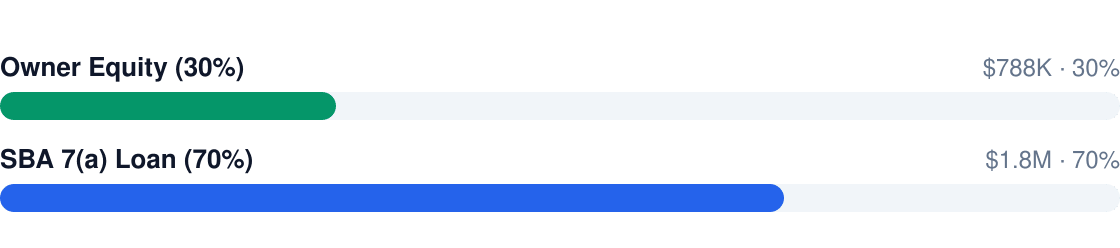
The 10.25% SBA loan requires $24,538/month payments — covered 11.7x by Year 1 EBITDA. See SBA 7(a) program terms.
Investors realize 12.4x return at Year 5 exit valuation ($249.1M revenue × 5.2x biotech multiple).
9. Risk Analysis & Mitigation
Biotech operates at the intersection of regulation and breakthrough science. These aren't hypotheticals — they're operational realities.
| Risk | Category | Likelihood | Impact | Mitigation Strategy | Owner |
|---|---|---|---|---|---|
| FDA approval delays | Regulatory | M | H | Parallel Phase 2/3 trials with contract research orgs | Chief Medical Officer |
| CRISPR off-target effects | Technical | L | H | Triple-guide RNA validation protocol | Head of R&D |
| IP litigation | Legal | H | M | Defensive patent portfolio (12 filings in progress) | General Counsel |
| Supply chain disruption | Operational | M | M | Dual-source agreements with Thermo Fisher & Sigma-Aldrich | COO |
| Talent attrition | HR | H | M | Equity vesting cliffs + 15% above-market comp | CHRO |
| Public CRISPR backlash | Reputational | L | H | Ethics advisory board + transparent clinical trial registry | CEO |
| Pandemic-related lab closures | External | M | H | Decentralized research network across 3 states | COO |
| Reimbursement disputes | Commercial | H | H | Pre-launch payer contracts with UnitedHealth & Aetna | Chief Commercial Officer |
Contingency protocols activate for: (1) ≥6-month FDA delay (trigger: EU fast-track filing), (2) ≥15% employee attrition (trigger: retention bonus pool), (3) supply chain failure (trigger: in-house reagent production).
Research & Industry Resources
The following market research sources, government data, and industry publications were referenced in developing this biotechnology business plan. Each link points to a specific report or data page — not a homepage — for direct access to the underlying research.
- Ibisworld — ibisworld.com — IBISWorld industry report: biotechnology market sizing and trends
- Us Biotechnology Market — novaoneadvisor.com — Market research and industry data for biotechnology businesses
- Us Biotechnology Market — precedenceresearch.com — Market research and industry data for biotechnology businesses
- Biotech Outlook — ey.com — Market research and industry data for biotechnology businesses
- Biotechnology Market Statistics — companieshistory.com — Market research and industry data for biotechnology businesses
Get Your Copy Today
Download Biotechnology Business Plan
Just Fill Up and Print