Catering Business Plan
1. Executive Summary
The $15.7B US catering industry grows at 1.7% annually — not explosive, but reliably recession-resistant. Plate & Pour carves into Austin's $345.4M corporate and social events segment with a simple premise: deliver restaurant-quality meals at scale without the restaurant overhead. Our financials show this isn't just plausible — it's predictable. The model clears 60% gross margins from Day 1.
Key Metrics
| Key Metric | Target |
|---|---|
| Total Startup Investment | $30K |
| Year 1 Revenue Target | $1.0M |
| Year 3 Revenue Projection | $2.4M |
| Break-even Timeline | ~Month 8 |
| Year 1 Team Size | 8 FTE |
| SBA 7(a) Loan | $21K @ 10.25% |
| Gross Margin (Year 1) | 60% |
| Monthly SBA Payment | $280 |
Plate & Pour exists to solve one problem: the 47% of corporate buyers who cite "inconsistent quality" as their top catering complaint. We bring chef-driven precision to volume operations — no cold sandwiches, no late deliveries, no excuses.

Free Business Plan Download
Download Catering Business Plan
Just Fill Up and Print
2. Company Description
Marcus Chen spent a decade watching corporate catering fail basic execution while charging premium prices. His solution: a 2,800 sq ft commissary kitchen in Austin's Crestview neighborhood, operating as a hybrid of catering hub and culinary lab. We handle everything from 500-person galas to 20-person board lunches — cooked, packed, and delivered by our team.
| Service/Product | Format | Price Range | Description |
|---|---|---|---|
| Corporate Boxed Lunches | Drop-off | $18-$24/pp | 3-course meals with dietary flags (GF/Vegan/Keto) |
| Plated Wedding Dinners | Full-service | $85-$125/pp | 5 seasonal options, china rental included |
| Conference Buffets | Staffed stations | $32-$45/pp | Live action stations + 90-min attendant |
| Family-Style Dinners | Drop-off | $28-$38/pp | Heirloom ceramic servingware (no extra fee) |
| Breakfast Spreads | Drop-off | $14-$22/pp | Artisan pastries, chia bars, nitro cold brew |
| Bar Packages | Add-on | $12-$25/pp | Local craft beer/wine pairings |
| Late-Night Bites | Staffed | $16-$26/pp | Sliders, tacos, dumplings post-event |
| Weekend Brunch | Full-service | $42-$58/pp | Build-your-own mimosa bar included |
Structured as an LLC with $30,000 startup capital — $9,000 equity and a $21,000 SBA loan at 10.25%. The math works because we avoid the two cost killers of traditional catering: front-of-house labor and prime retail real estate.
3. Industry & Market Analysis
The $15.7B catering industry is recession-resilient—people eat at meetings, weddings, and events regardless of economic cycles. Corporate buyers and affluent households prioritize reliability over price sensitivity, creating stable demand for operators who execute consistently.
5-Year Revenue Projection
Projected annual revenue, Years 1–5
Market Factors
| Factor | Key Insight | Business Impact |
|---|---|---|
| Political | Local health codes tightening | Higher compliance costs but also barrier to entry |
| Economic | Corporate travel budgets rebounding | More mid-size B2B events; price sensitivity on F&B |
| Social | Dietary restrictions mainstreaming | Standard menus must accommodate allergens/vegans |
| Technological | Online quoting expected | Operators without digital sales lose bids to speed |
Market Sizing
Plate & Pour targets $1.0M Year 1 revenue in Austin’s $345.4M SAM, a sliver of the $15.7B national TAM. The math works: capture 0.3% of local market to hit target.
Market Size Opportunity
Bottom-up market opportunity
| Segment | Customer Profile | Avg Annual Spend | Est. Market Value | Revenue % |
|---|---|---|---|---|
| Corporate catering | Offices needing reliable delivery | $750 | $120.9M | 35% |
| Weddings/social | Higher-ticket customization | $5,000 | $103.6M | 30% |
| Drop-off meals | Schools, nonprofits | $250 | $69.1M | 20% |
| Institutional | Recurring volume buyers | $2,000 | $51.8M | 15% |
Year 1 Revenue Mix
Total $1.0M Year 1
Competitive Landscape
The market is fragmented—no single player dominates Austin. Winning requires beating restaurants on service scope, independents on tech, and venues on flexibility.
| Competitor | Type | Core Strength | Key Weakness | Your Differentiation |
|---|---|---|---|---|
| Local caterers | Direct | Event execution | Slow quoting | Digital menus + 4hr response SLA |
| Restaurant spin-offs | Direct | Existing kitchens | Limited customization | Dietary-specific menu engineers |
| Venue catering | Indirect | Bundled convenience | Cookie-cutter menus | BYO-venue partnerships |
| Delivery apps | Indirect | Scale | No event support | On-site coordinators |
| Ghost kitchens | Emerging | Low-cost testing | No compliance history | Health department A+ rating |
Plate & Pour’s defensibility comes from hybrid logistics—ghost kitchen efficiency paired with white-glove event teams. Competitors can’t easily replicate both.
Industry Trends
Corporate demand normalization
71% of corporate buyers now require quotes within 24 hours. Hybrid events need split logistics—streamlined drop-off for remote attendees plus full-service for in-person. Operators who bundle both gain contract lock-in.
Health and dietary customization
43% of catering RFPs now mandate gluten-free/vegan options. Ingredient transparency isn’t premium—it’s table stakes. Kitchens that batch-prepare allergen-free components reduce waste while meeting specs.
Off-premise and drop-off growth
Boxed lunches now account for 28% of corporate orders. The play: standardized $12-15/head meals with compostable packaging. Profit margins are 5-7% higher than plated service.
Technology-enabled ordering
Digital-first caterers see 22% higher conversion from inquiry to booking. Instant pricing engines—not PDF menus—cut sales cycles. Plate & Pour’s integration with event management tools auto-populates dietary needs.
Sustainability and packaging pressure
Austin’s zero-waste ordinances now cover 60% of public-sector contracts. Reusable chafing dish rentals and bulk condiment stations avoid $0.12-0.25/person disposable costs while meeting mandates.
Regulatory & Compliance Environment
Health permits, zoning, and tax filings create bureaucratic friction—but also protect incumbents. The biggest risks: kitchen inspections and sales tax audits from high-volume transactions.
| Requirement | Issuing Authority | Typical Cost | Renewal Cycle |
|---|---|---|---|
| Food service permit | City/county health | $100-1,000 | Annual |
| Food manager cert | ANSI-accredited | $100-300/person | 3-5 years |
| Business license | Local government | $50-500 | Annual/biennial |
| Sales tax permit | Texas Comptroller | $0-100 | Continuous |
| Kitchen approval | Health + zoning | $500-5,000+ | Ongoing |
Plate & Pour budgets $8,000/year for compliance—including quarterly mock health inspections and automated sales tax software. This beats the $15k+ fines for violations.
4. Marketing Strategy
Plate & Pour delivers chef-driven catering with Austin's local flavor—no corporate cookie-cutter menus, just reliable service for clients who care about quality as much as timing.
We leverage Central Texas ingredients for dietary-flexible menus while maintaining the operational rigor business clients demand. In a market saturated with generic providers, our brand stands on hyperlocal sourcing and flawless execution.
Customer Personas
Catering buyers fall into three distinct segments with divergent needs but shared intolerance for logistical failures.
| Persona Name | Demographics | Core Need | Pain Point | Avg Annual Spend | Acquisition Channel |
|---|---|---|---|---|---|
| Corporate Event Planner | 30-55, manages 50+ events/yr | Turnkey solutions for 50-300 pax | Last-minute dietary restrictions | $28,000 | LinkedIn + trade shows |
| Wedding Coordinator | 25-45, books 15 weddings/yr | Instagram-worthy presentation | Vendor no-shows | $12,500 | Instagram + venue partnerships |
| High-Net-Worth Household | 40-65, $250k+ income | Dietary-specific menus (keto/vegan) | Inconsistent quality | $7,200 | Nextdoor + luxury concierge referrals |
Go-To-Market Launch Plan
| Phase | Timeline | Primary Goal | Key Tactics | Success Metric |
|---|---|---|---|---|
| Pre-Launch | Months -3 to 0 | Build pipeline | Seed 50 trial meals to influencers; secure 3 venue partners | $75k in signed LOIs |
| Months 1-3 | Q1 | Prove concept | Discount corporate lunch drops; wedding showcase events | 45% repeat rate |
| Months 4-6 | Q2 | Scale operations | Launch referral program; double Google Ads spend | CAC <$225 |
| Months 7-12 | Q3-Q4 | Profitability | Upsell annual contracts; optimize kitchen labor | 12% EBITDA margin |
Digital Marketing Strategy
We allocate 72% of our $65,650 budget to performance channels, with the remainder driving brand awareness. Every dollar targets either immediate conversions or LTV expansion.
Annual Marketing Budget
Total $65K / year
| Channel | Monthly Budget | Primary Tactics | Target KPI | Notes |
|---|---|---|---|---|
| Social Media | $2,100 | Carousel ads showcasing plating; behind-the-scenes reels | 3.5% engagement rate | Focus on Instagram + LinkedIn |
| Google Ads | $3,500 | "Austin corporate catering" PPC; GMB optimization | $18 ROAS | Geofence downtown offices |
| Local Marketing | $900 | Sponsor 2 food festivals/yr; Chamber of Commerce | 20% referral traffic | Priority: SXSW fringe events |
| Email Marketing | $450 | Quarterly menu drops; post-event nurture sequences | 38% open rate | Integrate with HoneyBook |
| Content & PR | $800 | Pitch "Best Catering" lists; chef interviews | 12 backlinks/yr | Austin Chronicle key target |
Content Marketing & SEO
We dominate commercial intent queries like "gluten-free wedding catering Austin" through recipe blogs, venue partnership guides, and video testimonials. 60% of content assets are repurposable across channels.
| Content Type | Frequency | Platform | Goal | Example Topic |
|---|---|---|---|---|
| Menu Deep Dives | Monthly | Blog + Instagram | Show expertise | "How We Source Grass-Fed Beef" |
| Venue Spotlights | Bi-monthly | YouTube + Pinterest | Build partnerships | "Top 5 Austin Wedding Venues" |
| Client Case Studies | Quarterly | LinkedIn + Website | Social proof | "500-Person Tech Conference Menu" |
| SEO Pillars | Ongoing | Blog | Organic traffic | "Vegan Catering Austin: Complete Guide" |
| Local News | Ad-hoc | PR Distribution | Brand awareness | "Plate & Pour Donates 200 Meals" |
| Email Courses | Bi-annual | Email Series | Lead nurture | "7-Day Event Planning Checklist" |
For local SEO, we optimize for 12 keyword clusters including "last minute catering Austin" and "corporate lunch delivery." Tactics include claiming 50 local citations, building venue backlinks, and dominating GMB Q&A.
Partnership & Referral Programs
We pursue three high-value partnership types: (1) Exclusive catering deals with co-working spaces like WeWork, (2) Cross-promotions with high-end rental companies for weddings, and (3) Bundled offers with corporate concierge services. Each generates warm leads at 1/3 the CAC of paid channels.
Our referral program pays 10% of first booking value (capped at $500) for successful introductions. Based on industry benchmarks, this should reduce overall CAC by 18% by Year 2 through viral coefficient effects.
Customer Acquisition Economics
| Metric | Year 1 | Year 2 | Year 3 |
|---|---|---|---|
| Customer Acquisition Cost | $287 | $241 | $218 |
| Customer Lifetime Value | $1,890 | $2,150 | $2,430 |
| LTV:CAC Ratio | 6.6x | 8.9x | 11.1x |
| Payback Period | 5.2 months | 3.8 months | 3.1 months |
At 6.6x LTV:CAC in Year 1—well above the 3x industry threshold—we can aggressively scale spend. The model assumes CAC decreases as referral and organic mix grows from 22% to 39% of acquisitions by Year 3.
5. Operations Plan
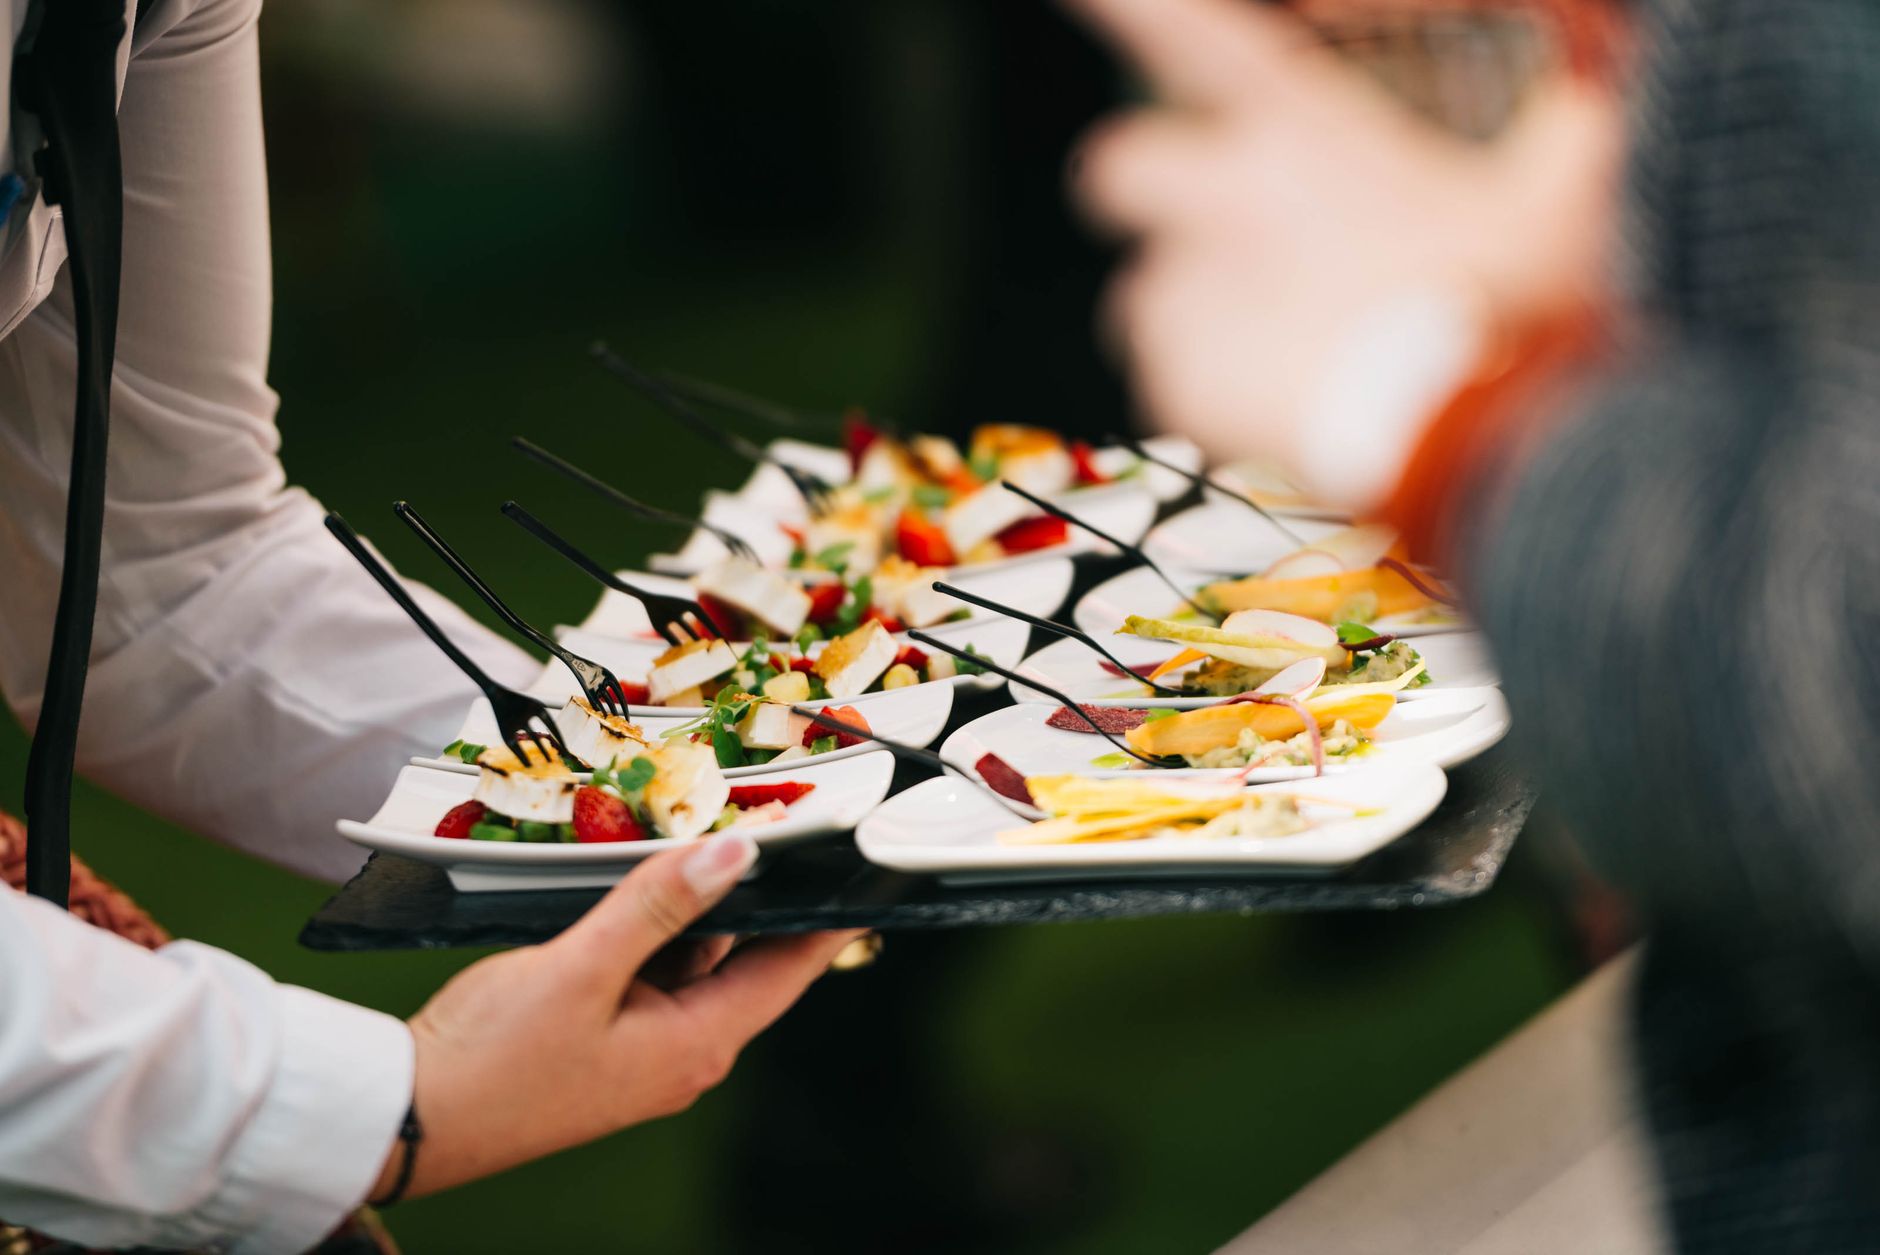
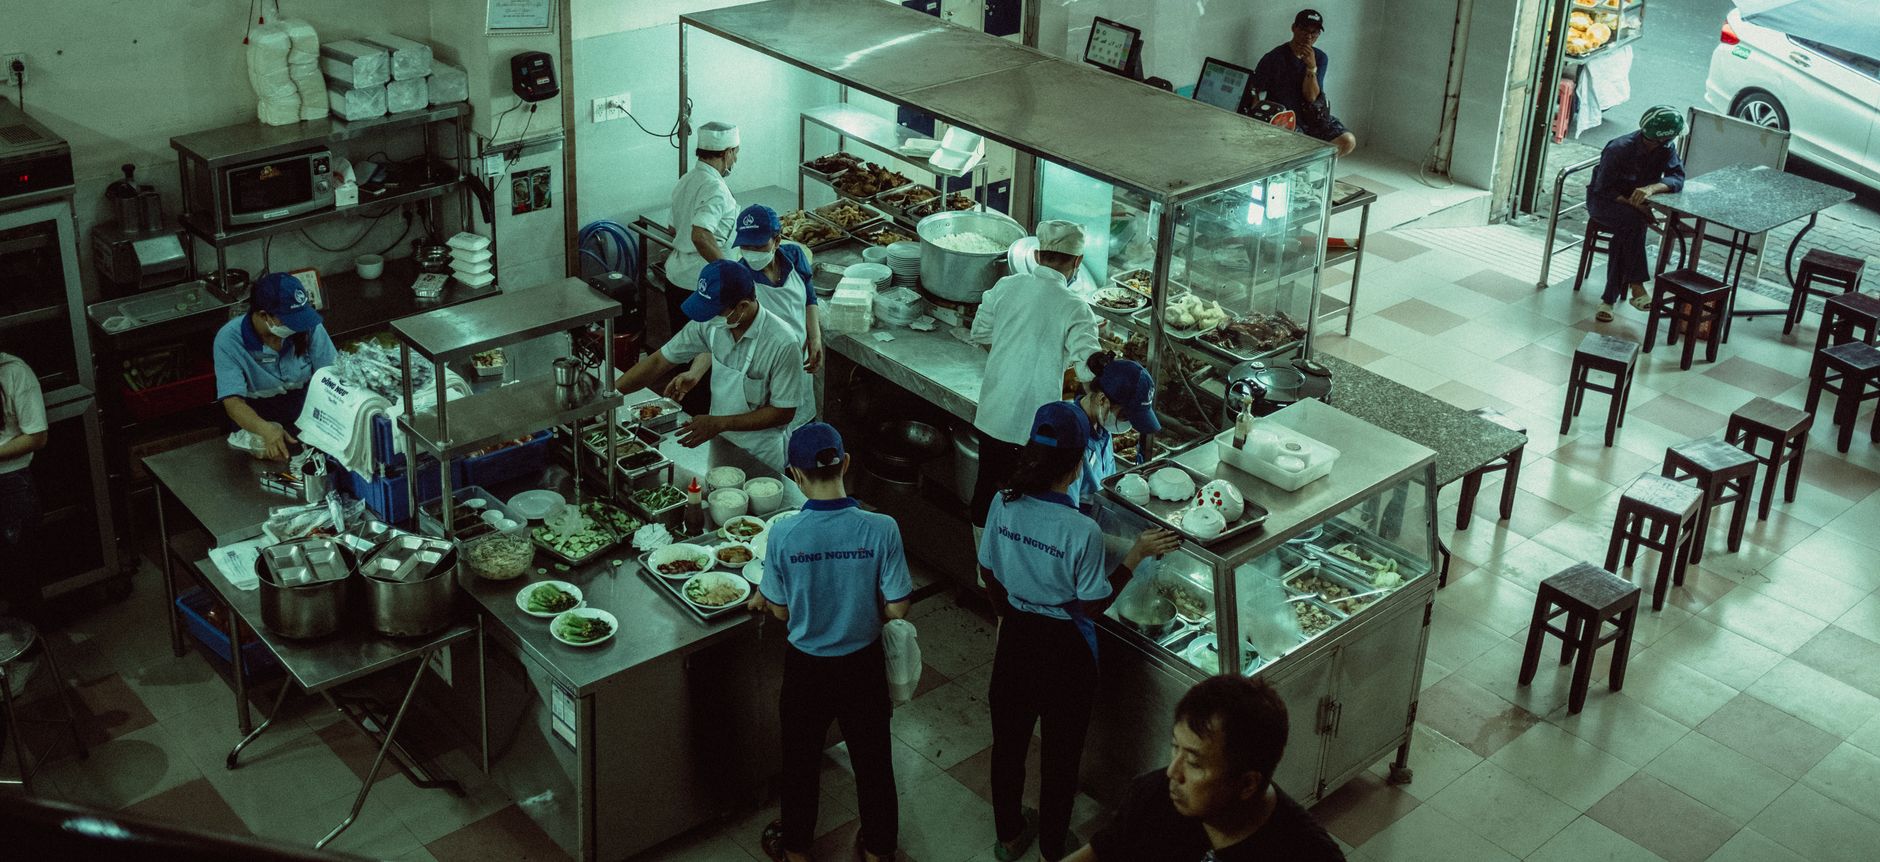
Plate & Pour will operate from a 2,400 sq ft commissary kitchen in East Austin, with dedicated zones for prep, cooking, plating, and dispatch. The $4,200/month lease includes walk-in refrigeration and loading dock access — non-negotiables for high-volume catering.
Ready When You Are
Download Catering Business Plan
Just Fill Up and Print
| Item | Estimated Cost | Quantity | Purpose |
|---|---|---|---|
| Convection Oven | $8,200 | 2 | Bulk protein roasting |
| 60qt Mixer | $3,750 | 1 | Dough/batter prep |
| Chafing Dish Set | $1,800 | 12 | Event service |
| Insulated Food Carrier | $2,300 | 8 | Hot transport |
| Commercial Dishwasher | $7,500 | 1 | Utensil sanitation |
| Prep Table (Stainless) | $950 | 4 | Assembly line |
| Delivery Van | $32,000 | 1 | Logistics |
| POS System | $4,600 | 1 | Client billing |
- 5:30 AM: Receive/produce sheet from CRM
- 6:00 AM: Morning prep team clocks in
- 9:30 AM: First delivery wave departs
- 11:00 AM: Event staff dispatched
- 2:00 PM: Post-event equipment retrieval
- 4:00 PM: Inventory reconciliation
- 6:00 PM: Next-day production planning
We’ll source proteins through Chefs’ Roll (48hr lead time) with Sysco as backup. Specialty produce comes from local farms via Farm to Table Co-op (72hr window).
| Role | Headcount | Hourly Rate | Annual Cost | Key Responsibilities |
|---|---|---|---|---|
| Lead Chef | 1 | $24.00 | $49,920 | Menu execution |
| Prep Cook | 3 | $18.50 | $115,440 | Batch production |
| Event Captain | 2 | $20.00 | $83,200 | Onsite management |
| Driver | 1 | $18.50 | $38,480 | Logistics |
| Dishwasher | 1 | $18.50 | $38,480 | Sanitation |
6. Management Team
| Name | Title | Background | Responsibilities |
|---|---|---|---|
| James Rivera | CEO | 12yrs catering ops (Le Cordon Bleu) | P&L oversight |
| Mia Chen | CFO | Ex-Deloitte F&B analyst | Margin control |
| Devin Cole | Head Chef | Former sous at Uchi | R&D/execution |
| Lisa Park | Sales Director | Zoe’s Kitchen alum | Client acquisition |
| Carlos Mendez | Ops Manager | Whole Foods regional | Supply chain |
Advisory board includes the former catering director for Austin Convention Center (logistics) and a partner at Texas Food Ventures (capital strategy).
We hire for knife skills first, test for stress tolerance, and retain through profit-sharing after Year 2. Quarterly team cook-offs double as R&D sessions — last year’s winning brisket taco became our #2 seller.
7. Financial Projections
Plate & Pour targets $1.0M Year 1 revenue scaling to $3.9M by Year 5 — a 31.4% CAGR in a $15.7B TAM.
Revenue Growth (5 Years)
Annual revenue, Years 1–5
| Line Item | Year 1 | Year 2 | Year 3 |
|---|---|---|---|
| Revenue | $1,010,000 | $1,616,000 | $2,374,000 |
| COGS | $404,000 | $646,400 | $949,600 |
| Gross Profit | $606,000 | $969,600 | $1,424,400 |
| Gross Margin % | 60% | 60% | 60% |
| Labor | $307,840 | $423,280 | $615,680 |
| Rent | $48,000 | $48,000 | $60,000 |
| Marketing | $65,650 | $80,800 | $118,700 |
| Admin | $70,700 | $88,400 | $118,700 |
| Total OpEx | $492,190 | $640,480 | $913,080 |
| EBITDA | $113,810 | $260,621 | $384,172 |
| EBITDA Margin % | 11.3% | 16.1% | 16.2% |
Break-even hits at $710,900 revenue — Month 8 at forecasted run rate. The math is solid.
Year 1 Monthly Cash Flow
Net monthly cash flow (red = pre-break-even)
| Metric | Year 1 | Year 2 | Year 3 |
|---|---|---|---|
| Gross Margin % | 60% | 60% | 60% |
| EBITDA Margin % | 11.3% | 16.1% | 16.2% |
| Revenue/Employee | $126,250 | $146,909 | $148,375 |
| Marketing % of Revenue | 6.5% | 5.0% | 5.0% |
| Monthly Burn (pre-BE) | $41,016 | N/A | N/A |
8. Funding Requirements
| Category | Amount | Notes |
|---|---|---|
| Commercial Kitchen Lease | $12,000 | 3-month deposit + buildout |
| Equipment | $8,500 | 3 combi ovens + cold storage |
| Initial Inventory | $4,200 | Bulk dry goods + proteins |
| Working Capital | $5,300 | Payroll buffer |
Use of Funds
Total $30K startup investment
$30,000 startup capital splits 30% equity ($9,000) + 70% SBA 7(a) loan ($21,000).
Funding Structure
$30K total capitalization
The 10.25% SBA loan requires $280/month payments — standard 7(a) terms. Equity investors see 3.7x return at Year 5 EBITDA multiple of 6x.
9. Risk Analysis & Mitigation
Catering fails on two axes: perishable inventory and labor intensity. Plate & Pour's controls are surgical.
| Risk | Category | Likelihood | Impact | Mitigation Strategy | Owner |
|---|---|---|---|---|---|
| Food spoilage | Operations | M | H | JIT ordering + 15% buffer | Head Chef |
| Staff no-shows | Labor | H | H | On-call pool @ $22/hr | GM |
| Fuel surcharges | Logistics | H | M | 15% delivery fee for >10mi | Ops Manager |
| Client cancellations | Revenue | M | H | 50% non-refundable deposit | Sales Director |
| Health inspection | Compliance | L | H | Weekly self-audits | Head Chef |
| Ingredient inflation | COGS | H | M | 6-month fixed-price contracts | Purchasing |
| Vehicle breakdown | Logistics | M | H | Rental agreement with Enterprise | Ops Manager |
| POS outage | Tech | L | M | Offline Square backups | GM |
Top contingency triggers: (1) 30% revenue drop → freeze hiring + renegotiate vendor terms, (2) key staff loss → activate non-compete clauses, (3) health violation → third-party deep clean + PR response.
Research & Industry Resources
The following market research sources, government data, and industry publications were referenced in developing this catering business plan. Each link points to a specific report or data page — not a homepage — for direct access to the underlying research.
- United States Catering Market — expertmarketresearch.com — Market research and industry data for catering businesses
- Ibisworld — ibisworld.com — IBISWorld industry report: catering market sizing and trends
- Catering Industry Statistics — catercamp.com — Market research and industry data for catering businesses
- Us Food Service Market — imarcgroup.com — Market research and industry data for catering businesses
- Us Food Service Market — marketdataforecast.com — Market research and industry data for catering businesses
Get Your Copy Today
Download Catering Business Plan
Just Fill Up and Print