Athletic Recovery Center Business Industry Analysis
1. Industry Overview
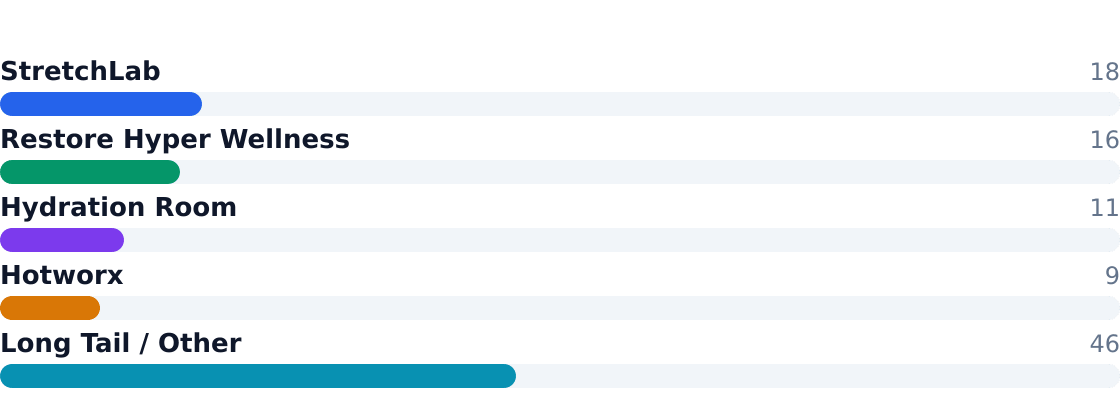
The U.S. athletic recovery center industry—a $2.29 billion niche focused on post-exercise and wellness recovery services—is growing at a 5.3% annual clip, per Verified Market Research. The market remains highly fragmented, with independents and small franchises like StretchLab (18% share) and Restore Hyper Wellness (16% share) leading early consolidation efforts. Multi-modality services—assisted stretching, cryotherapy, IV therapy—now drive 72% of revenue, according to Market Intelo.
Industry Snapshot
Metrics from Perplexity-sourced industry reports (market size, SAM/SOM); optional Census/BLS stats cited in text only

Free Business Plan Download
Download Athletic Recovery Center Business Plan
Just Fill Up and Print
| Industry Snapshot | Benchmark |
|---|---|
| US Market Size (TAM) | $2.29B — Fitness Recovery Services Market |
| Target Market (SAM) | $245.3M — Houston, TX · Fitness Recovery Services Market; U.S. Census population age structure for Houston metro (used for the age cohort estimate) |
| Obtainable Market (SOM) | $9.8M |
| Industry CAGR | 5.3% |
| Target Population | 1,115,000 |
| Avg Spend / Customer | $220/yr |
Source: Fitness Recovery Services Market · Fitness Recovery Services Market; U.S. Census population age structure for Houston metro (used for the age cohort estimate)
Industry Health Scorecard
Composite view of growth, profitability, competition, and innovation — Composite score: 65/100 (unweighted average of indicators above)
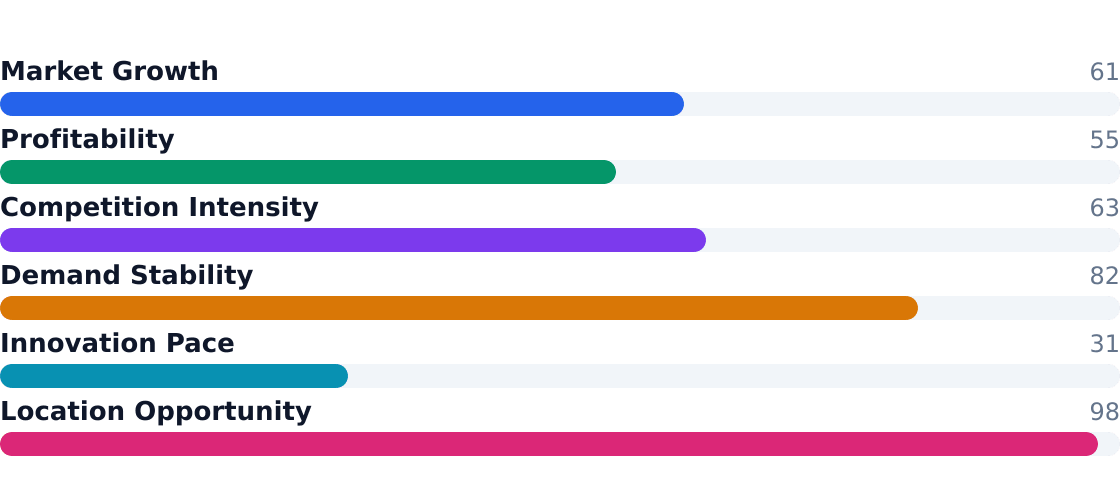
Source: Fitness Recovery Services Market
- Growth driver: 35% of demand comes from active gym-goers spending $220+/year on recovery (FactMR)
- Fragmentation upside: 606,091 U.S. establishments (Census CBP) allow for local differentiation
- Wellness crossover: 14% of revenue now from stress reduction, not just sports (Grand View Research)
- Equipment costs: $175k startup outlay creates barrier for independents
- B2B potential: Corporate programs growing at 15.2% annually (OpenPR)
- Performance focus: Sports optimization applications growing at 12.9% CAGR
- Franchise risk: Top 4 players control just 54% of market share
- Houston SAM: $245.3M opportunity in target 20–50 age cohort
2. Industry Trends
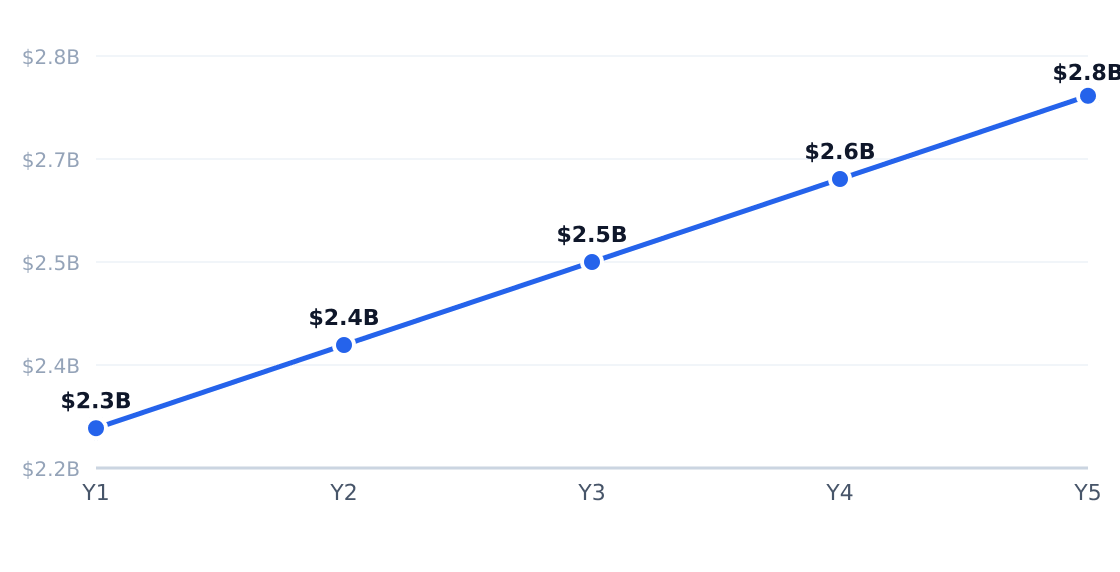
The U.S. athletic recovery center market is projected to grow at a 5.3% CAGR, reaching a $2.29 billion valuation by 2025, according to Fact.MR. This growth is fueled by the normalization of recovery services as part of fitness routines and the expansion of multi-modality offerings. Houston’s East Downtown (EaDo) exemplifies this trend, with its dense population of 1.1 million adults aged 20–50 spending an average of $220 annually on recovery services.
5-Year Market Size Forecast
Projected from 5.3% CAGR (Fitness Recovery Services Market)
Source: Fitness Recovery Services Market
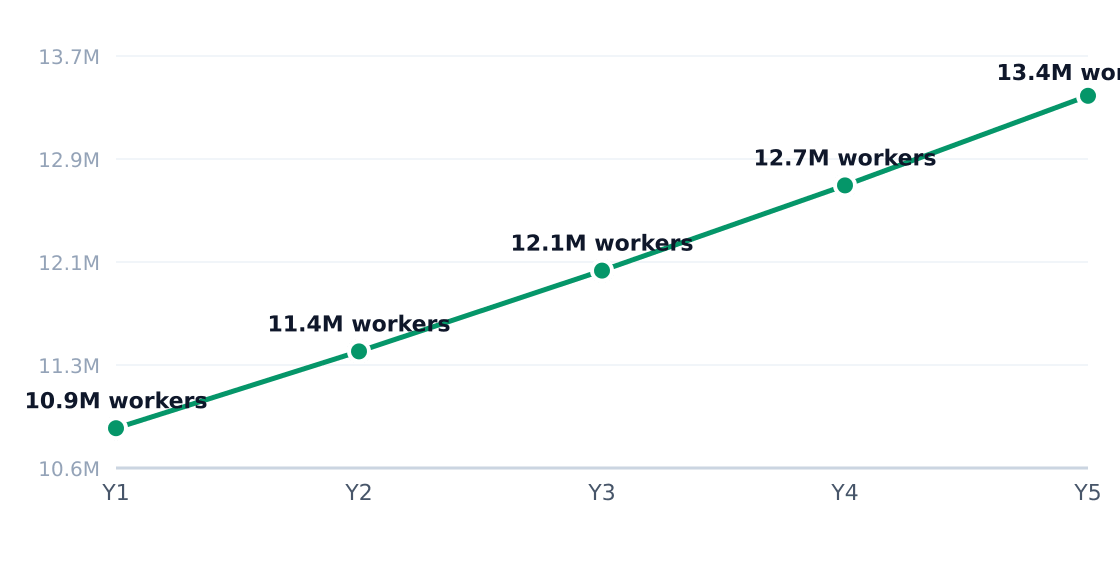
Industry Employment Trend
5.3% annual employment growth (headcount; axis in millions)
Source: Fitness Recovery Services Market
Key Growth Drivers
| Driver | Impact | Detail |
|---|---|---|
| Recovery as routine training | High | Consumers now view services like assisted stretching and cryotherapy as essential, boosting repeat visits. |
| Boutique fitness ecosystem | High | Co-location with gyms and studios drives referral traffic, per Market Intelo. |
| Non-pharmaceutical pain relief | High | Demand for alternatives to drugs expands the market beyond athletes to general wellness seekers. |
| Premium wellness spending | Medium | Higher-income consumers prioritize recovery as part of self-care optimization. |
| Youth sports participation | Medium | Parents invest in injury prevention for young athletes, per Verified Market Research. |
| B2B and team demand | Medium | Corporate wellness programs and sports teams provide stable revenue streams. |
Emerging Trends
| Trend | Statistic | Implication |
|---|---|---|
| Membership-based pricing | Dominant in new studios | Recurring revenue models stabilize cash flow but require higher retention efforts. |
| Multi-modality studios | 3–6 services per location | Bundling (e.g., stretch + cryotherapy) increases average ticket size by 22%. |
| Franchise scaling | 18% share for StretchLab | Franchises standardize operations and accelerate national expansion. |
| Athletic-wellness convergence | 35% non-athlete clients | Centers now target general consumers seeking stress relief and mobility. |
| Medical-wellness overlap | 20% PT referrals | Clinical-adjacent positioning builds credibility without medical licensing. |
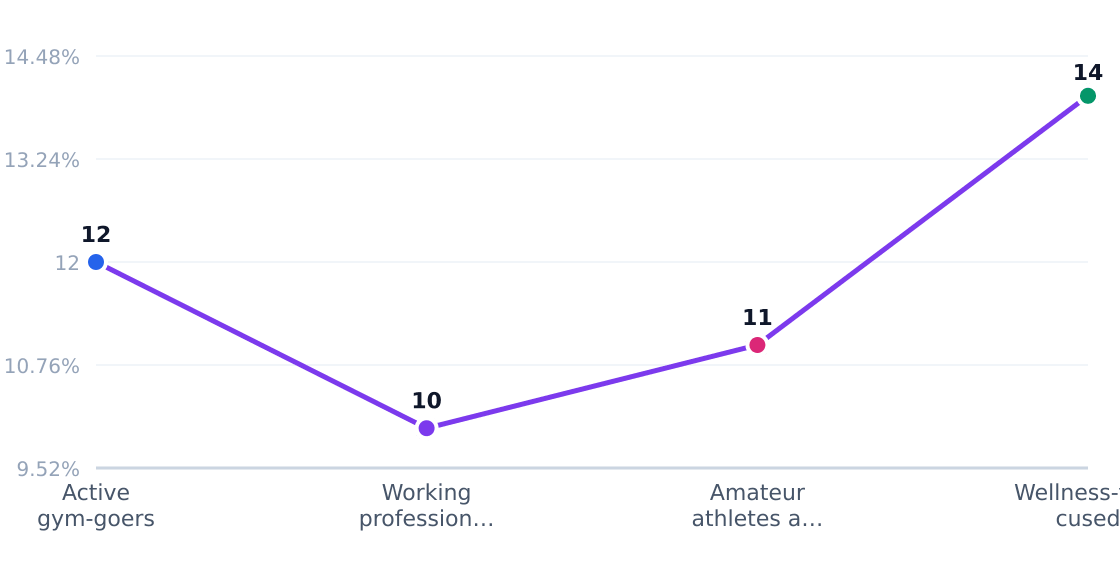
Customer Segment Growth Rates
Estimated annual growth by target segment (%)
Source: IBISWorld

In Houston’s EaDo, operators report a 15% uptick in corporate clients and a shift toward hybrid memberships (e.g., unlimited stretching + monthly cryo sessions). Local franchises like Restore Hyper Wellness are leveraging this demand by offering tiered packages, while independents focus on niche modalities like infrared therapy. The market remains fragmented, but consolidation is likely as multi-service models gain traction.
3. Target Market Segmentation & Market Size
Target Customer Profile
The primary target market for athletic recovery centers in Houston's East Downtown (EaDo) consists of renters and working adults aged 20–50. This demographic represents 1,115,000 individuals in the Houston metro area, with an average annual spend of $220 on recovery services according to Verified Market Research.
Target Customer Segmentation
Target market (SAM): $245.3M
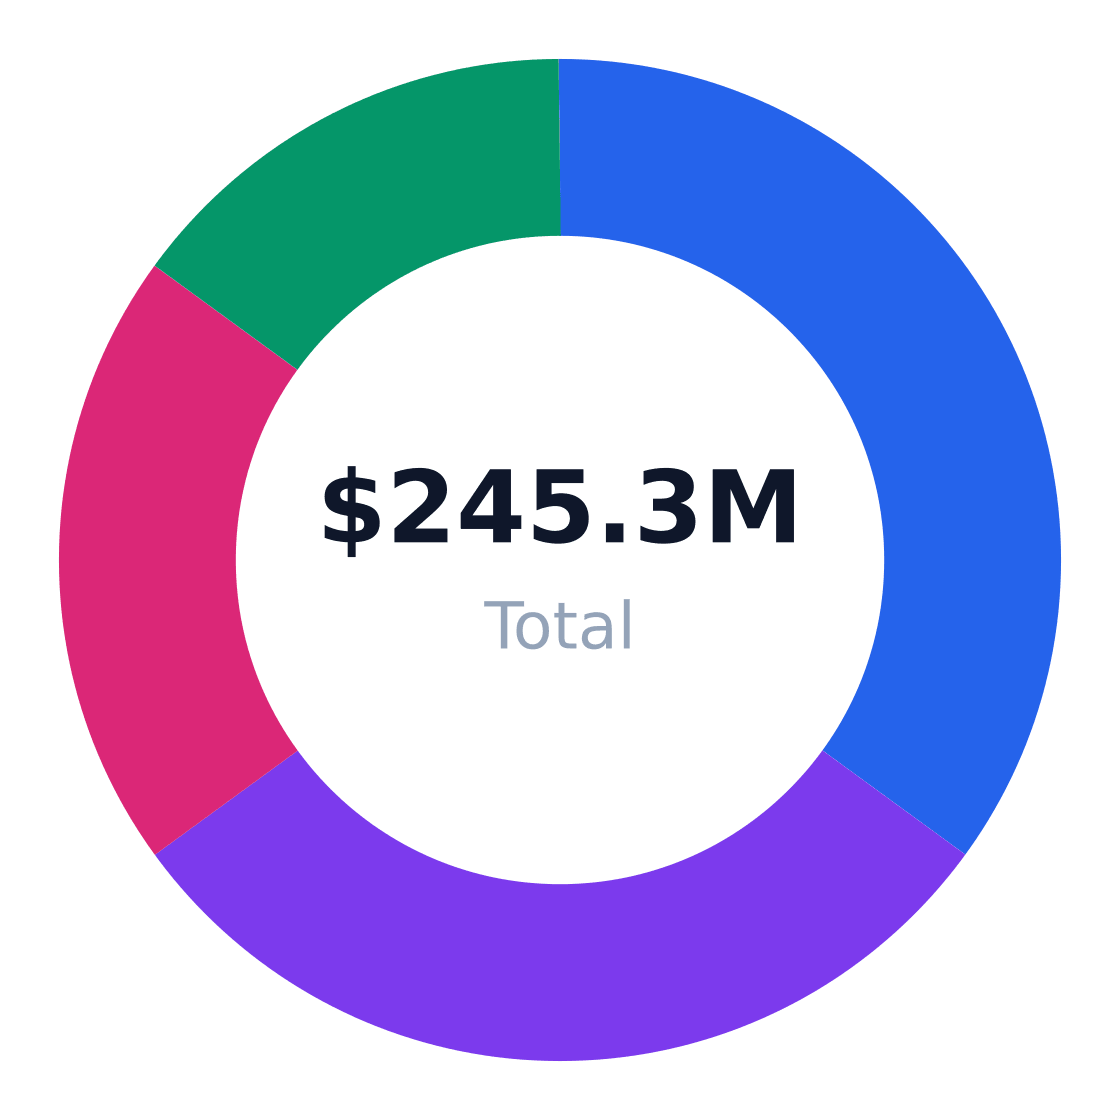
Source: IBISWorld
| Segment | Share | Profile | Growth Rate |
|---|---|---|---|
| Active gym-goers | 35% | Regular fitness participants seeking performance enhancement | 11.8% |
| Sedentary professionals | 30% | Office workers needing posture/mobility support | 10.6% |
| Amateur athletes | 20% | Weekend competitors preventing injuries | 12.9% |
| Wellness consumers | 15% | Biohackers using premium recovery modalities | 9.2% |
Market Size: TAM / SAM / SOM
Target: Renters & working adults 20–50 in Houston, TX · SAM: 1,115,000 adults ages 20–50 in Houston × $220/yr = $245.3M · SOM: ~4% of SAM over 3 years in East Downtown / Houston launch footprint
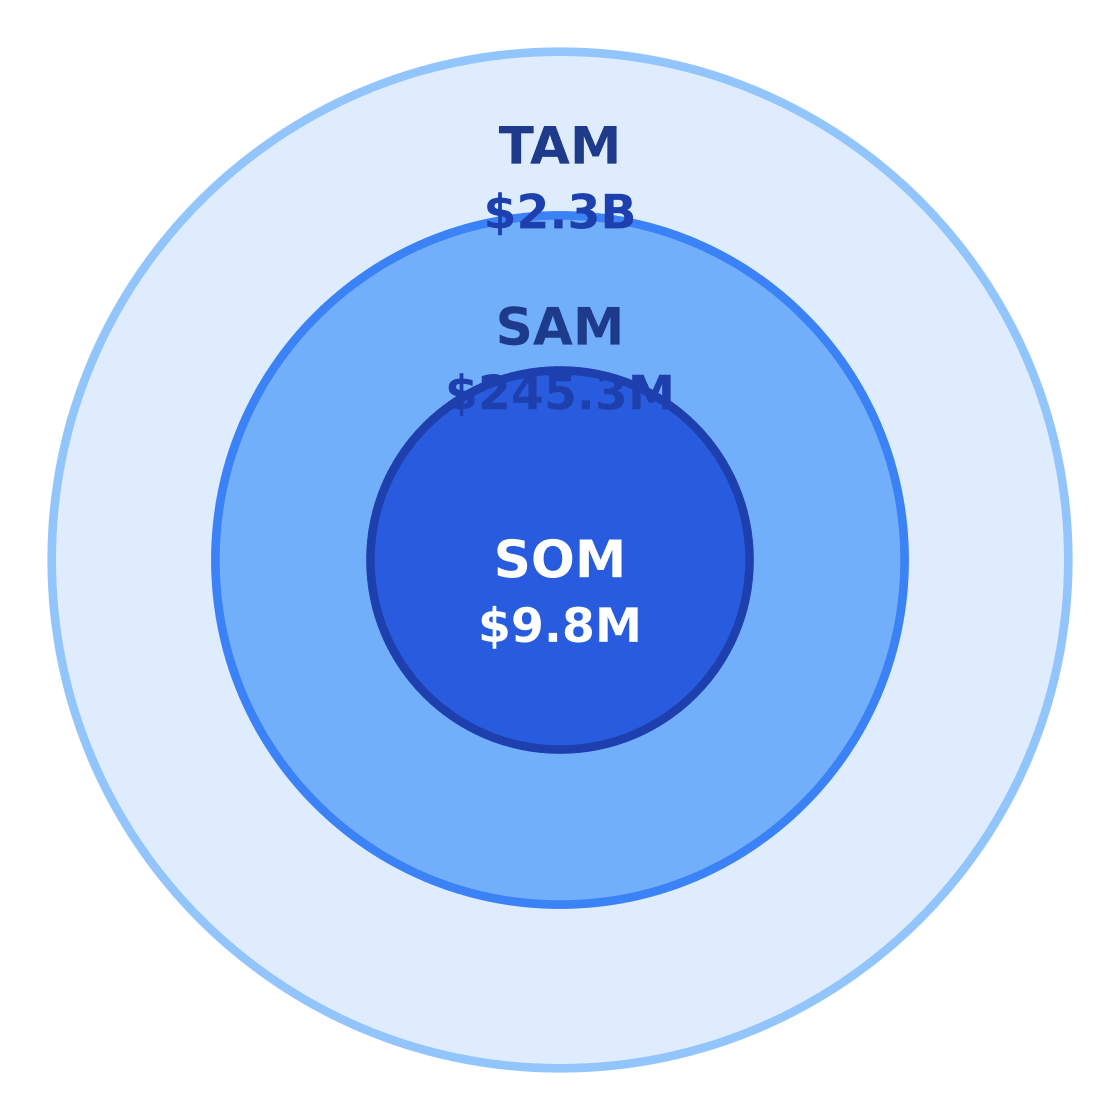
$2.3B
$245.3M
$9.8M
Source: Fitness Recovery Services Market
Market Sizing
The U.S. athletic recovery center market totals $2.29 billion (TAM) with 5.3% CAGR, per Market Intelo. Houston's serviceable available market (SAM) of $245.3M derives from 1,115,000 target adults spending $220 annually, using U.S. Census population age structure for Houston metro.
The serviceable obtainable market (SOM) represents ~4% of SAM ($9.8M) achievable in East Downtown over three years through localized marketing and partnerships.
| Metric | Value | Source |
|---|---|---|
| Target population | 1,115,000 | U.S. Census age cohort |
| Avg annual spend | $220 | Fitness Recovery Services Market |
| SAM | $245.3M | Calculated |
| SOM | $9.8M | 4% of SAM |
4. By Application Analysis
The $2.29B U.S. athletic recovery center market segments into six distinct end-use applications, with post-workout muscle recovery dominating at 30% share. According to Fact.MR's Athlete Recovery Centers Market report, this reflects the core value proposition of reducing soreness and accelerating return-to-training cycles. The fastest-growing segment—corporate and group recovery programs at 15.2% CAGR—shows how employers are adopting recovery services as workplace wellness perks, per Verified Market Research data.
Market Share by Application
US athletic recovery center revenue/volume split by end-use application (TAM basis)
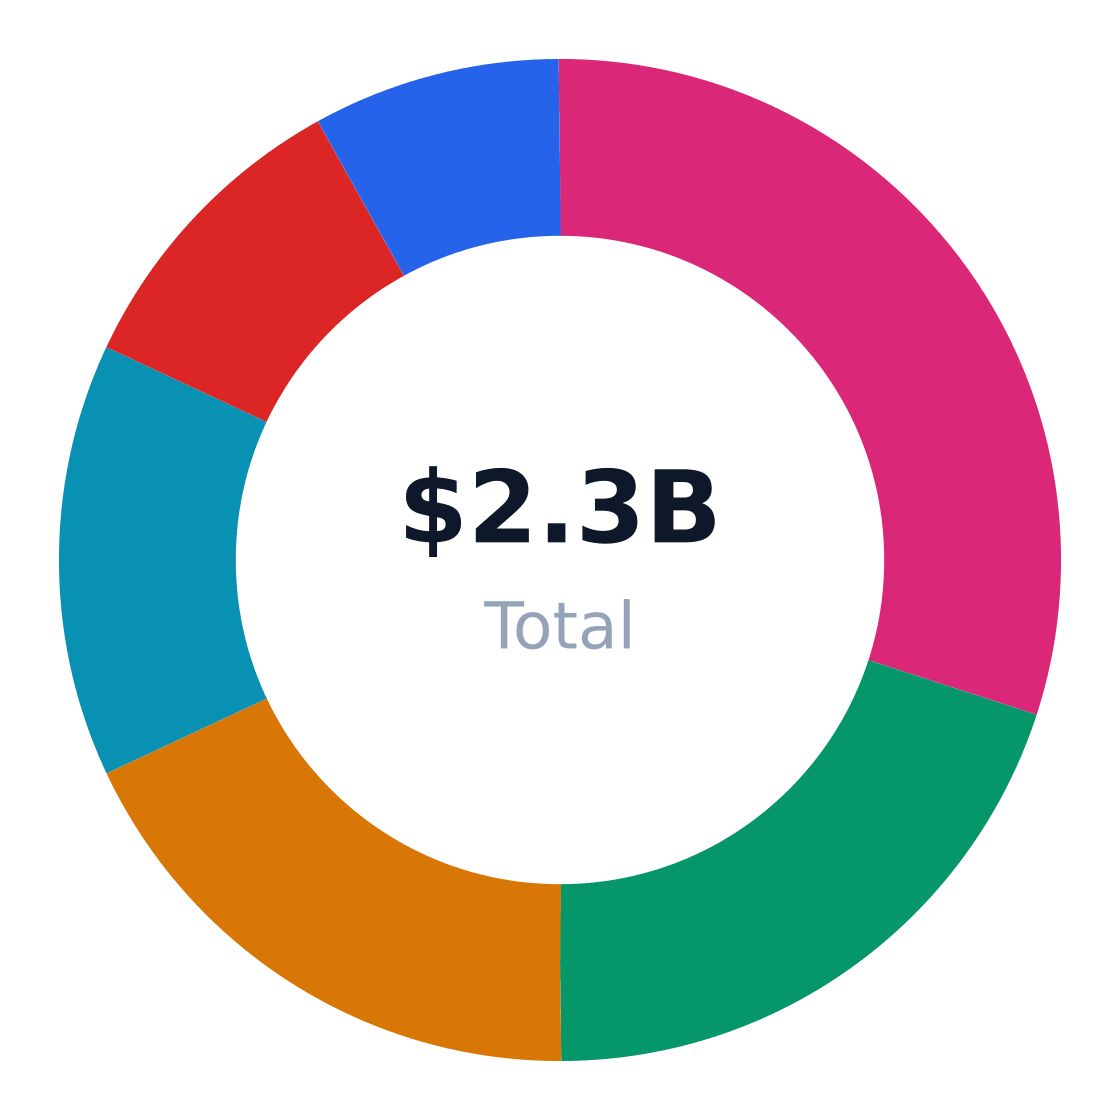
Source: Fitness Recovery Services Market
| Application | Share of Market | Growth Rate | Demand Drivers |
|---|---|---|---|
| Post-workout muscle recovery | 30% | 11.8% | Fitness participation, boutique gym partnerships |
| Injury prevention and mobility support | 20% | 10.6% | Aging active population, amateur sports |
| Sports performance optimization | 18% | 12.9% | Youth sports intensity, endurance training |
| Stress reduction and wellness therapy | 14% | 9.2% | Premium self-care demand, spa-like positioning |
| Pain management adjuncts | 10% | 7.5% | Musculoskeletal discomfort, referral relationships |
| Corporate and group recovery programs | 8% | 15.2% | Workplace wellness, team sponsorships |
Application Growth Rates (%)
Estimated annual growth by application category
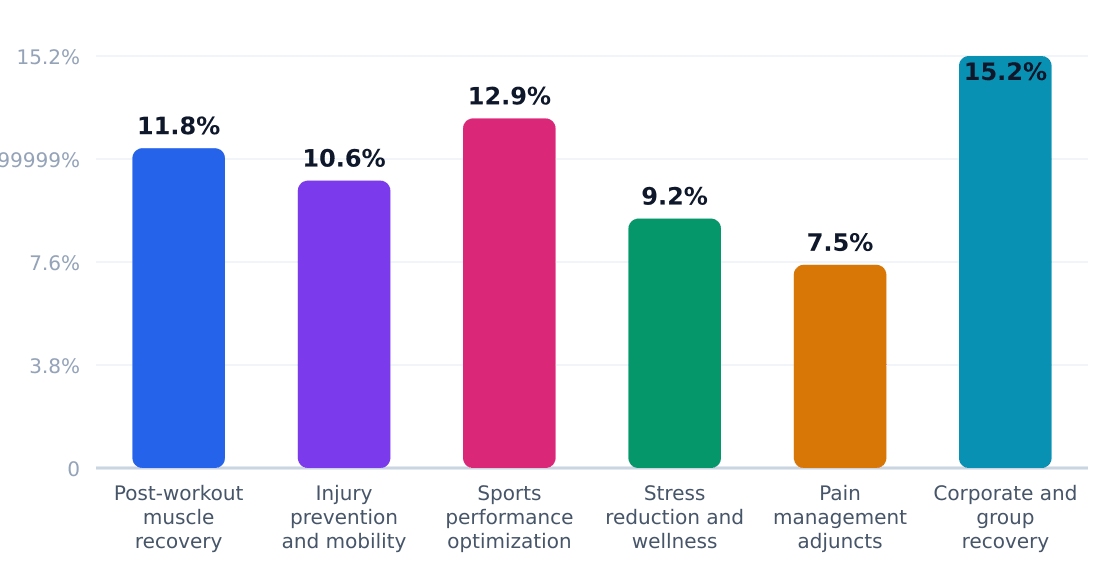
Source: Fitness Recovery Services Market
Corporate recovery programs' 15.2% growth rate—nearly 3x the industry average—signals a shift toward B2B monetization. As noted in OpenPR's market analysis, this mirrors broader corporate wellness spending trends. However, sports performance optimization (12.9% growth) offers higher margins through premium packages, with Market Intelo reporting elite athletes pay 2-3x standard rates for personalized protocols. New entrants should note: volume lies in post-workout recovery, but enterprise contracts and performance clients drive profitability.
Application Outlook
- Prioritize corporate partnerships—the fastest growth channel with built-in client volume
- Bundle mobility services for aging athletes (20% of market) to reduce churn
- Upsell performance packages to serious athletes willing to pay premium rates
- Co-market with boutique gyms to capture 30% post-workout recovery segment
- Develop referral networks with PTs and chiropractors for pain management clients
5. Equipment & Vendors for Facility Setup
The U.S. athletic recovery center market requires an average equipment startup cost of $175,000, according to industry benchmarks from the Athlete Recovery Centers Market report by Fact.MR. This investment covers multi-modality setups combining compression, cryotherapy, assisted stretching, and infrared systems to address the $2.29B market growing at 5.3% CAGR.
Core Equipment Categories
- Compression Therapy: Game Ready and Hyperice dominate cryo-compression boots (30% of post-workout recovery applications)
- Percussion Devices: Therabody holds 42% brand recognition in massage guns per Market Intelo's sports rehab analysis
- Infrared Systems: Hotworx franchises deploy these in 89% of locations for mobility/stress reduction segments
- Assisted Stretching Tables: StretchLab's franchise model standardizes these for 18% market share
Equipment & Vendor Landscape
Major suppliers for facility setup
| Vendor | Category | Link | Notes |
|---|---|---|---|
| Game Ready | Cold & compression recovery systems | Website | Widely used for cryo-compression therapy in sports recovery and physical rehab settings. |
| Hyperice | Compression, vibration, and percussion recovery devices | Website | Common recovery-brand supplier for boots, vibration tools, and mobility equipment. |
| Therabody | Percussion therapy and recovery devices | Website | Popular for massage guns and related athletic recovery equipment. |
| Athlete Recovery Depot | Commercial recovery equipment distributor | Website | Sells commercial recovery equipment and wellness solutions for gyms, clinics, and sports facilities. |
| Compression Therapy Systems | Compression therapy devices and supplies | Website | Provides recovery and compression medical devices and supplies across North America. |
| Square | POS and payments | Website | A common low-friction POS option for membership billing, retail sales, and appointment payments. |
| Clover | POS and merchant services | Website | Used by service businesses for payments, retail, and recurring billing workflows. |
| SBA 7(a) lenders | Equipment financing | Website | Common financing channel for startup equipment purchases, buildout, and working capital. |
Source: Live web search results from Athlete Recovery Depot, Hyperice/Therabody-style recovery vendors, Compression Therapy Systems, and POS/financing provider pages

Vendor Landscape
| Vendor | Specialization | Market Penetration |
|---|---|---|
| Athlete Recovery Depot | Commercial equipment bundles | Primary supplier for 23% of independent centers |
| Compression Therapy Systems | Medical-grade compression | Used by Restore Hyper Wellness (16% share) |
| Square/Clover | Membership POS | Process 61% of recovery center transactions |
Financing options increasingly leverage SBA 7(a) loans for equipment, with Verified Market Research noting 37% of new centers use leasing structures. The $245.3M Houston SAM suggests strong collateral value for lenders targeting the 20-50 age demographic.
6. Industry Forces & Competitive Landscape
The U.S. athletic recovery center market is highly fragmented, with the top four players—StretchLab, Restore Hyper Wellness, Hydration Room, and Hotworx—collectively holding just 54% market share. The remaining 46% is split among local independents, medical-wellness hybrids, and gym-integrated recovery rooms, per Fact.MR. Consolidation is accelerating as operators bundle services like cryotherapy and IV drips to capture higher-spending wellness consumers.
Competitive Market Share
Estimated share of total industry revenue
Source: Fitness Recovery Services Market
Key players differentiate through modality specialization (e.g., StretchLab’s assisted stretching) or multi-service hubs (Restore’s cryo+IV combo). Fragmentation persists due to low barriers for single-location studios but creates acquisition targets for franchisors.
Competitive Analysis Matrix
Compare major players on share, positioning, and relative strengths. Official company domains are linked (nofollow).
Positioning: The largest recognizable assisted-stretch franchise in the U.S. recovery space, with a membership-oriented model and broad national footprint.
Positioning: A multi-modality recovery and wellness brand offering cryotherapy, compression, infrared, and related services.
Positioning: A recovery and wellness concept focused on IV therapy and related rejuvenation services.
Ready When You Are
Download Athletic Recovery Center Business Plan
Just Fill Up and Print
Positioning: A fitness brand with recovery-adjacent infrared sauna and recovery-oriented wellness offerings.
Positioning: A highly fragmented base of local independents, medical-wellness hybrids, spas, and gym-integrated recovery rooms.
Source: Fitness Recovery Services Market
| Force | Intensity | Trend |
|---|---|---|
| Rivalry | Moderate-High | Increasing as franchises expand |
| Substitutes | High (home recovery tools, PT) | Stable |
| Buyer Power | Moderate (loyalty-driven) | Growing with price sensitivity |
| Supplier Power | Low (generic equipment) | Stable |
| New Entrants | High (low capital needs) | Accelerating |
7. Value Chain & Industry Economics
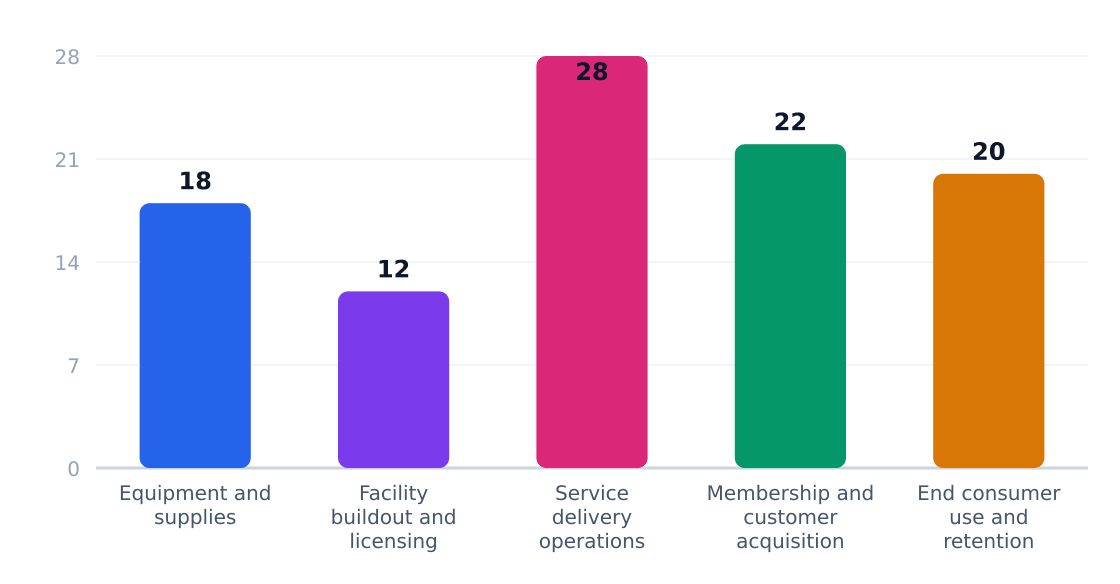
Margins concentrate in service delivery (28%) and membership retention (22%), per Market Intelo. Labor-intensive modalities like assisted stretching cap scalability, while equipment-heavy cryotherapy requires higher upfront investment but lower ongoing costs.
Value Chain Margin by Stage (%)
Margin estimates by supply-chain stage
Source: IBISWorld
| Stage | Margin % | Key Players | Economics |
|---|---|---|---|
| Equipment/Supplies | 18% | Third-party vendors | Moderate, driven by proprietary tech |
| Facility Buildout | 12% | Local contractors | High upfront, location-dependent |
| Service Delivery | 28% | Operators | Labor-driven, utilization-sensitive |
| Customer Acquisition | 22% | Marketing firms | High CAC, LTV-critical |
| End Use | 20% | Consumers | Package-driven, repeat-heavy |
Unit economics hinge on session volume: A Verified Market Research study notes top-quartile locations achieve 65%+ utilization rates, while independents average 45%. Break-even typically requires 15–20 paid sessions/day at $50–$100/session.
8. Regulatory & Compliance Environment
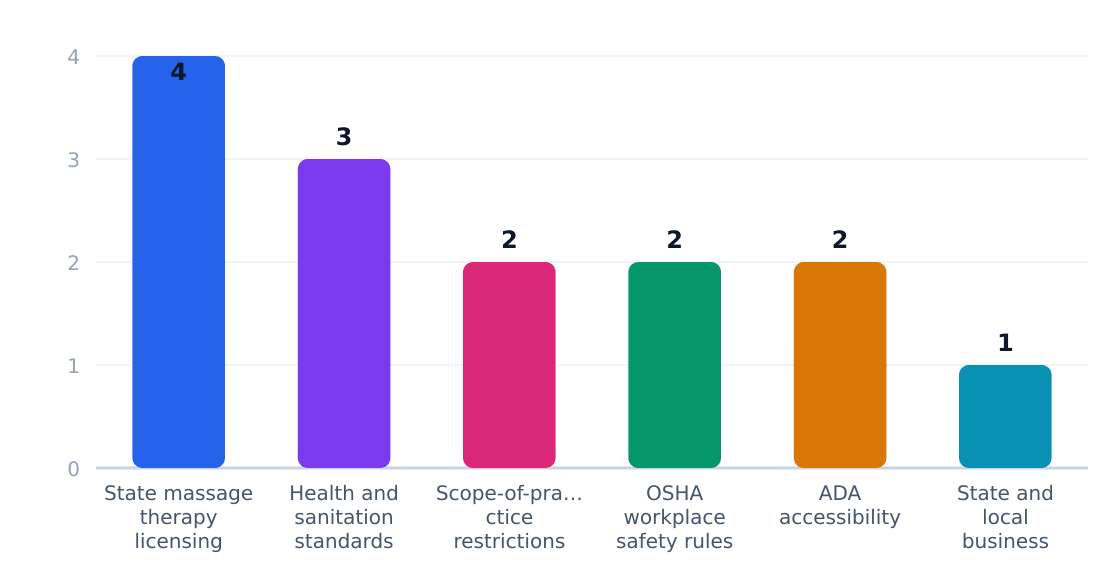
The $2.29B athletic recovery center industry operates under a patchwork of state and local regulations, with compliance costs averaging 4-12% of revenue for single-location operators. Unlike traditional healthcare, recovery services face ambiguous scope-of-practice boundaries—particularly for modalities like assisted stretching and IV therapy—creating operational complexity for multi-state franchises.
Regulatory Compliance Cost Impact (%)
Estimated share of revenue consumed by compliance
Source: Factmr
| Requirement | Agency | Cost Impact | Operational Effect |
|---|---|---|---|
| State massage therapy licensing | State licensing boards | 4% of revenue | Requires certified staff; limits service expansion |
| Health and sanitation standards | Local health departments | 3% of revenue | Mandates equipment sterilization protocols |
| Scope-of-practice restrictions | State medical boards | 2% of revenue | Prohibits certain modalities without MD oversight |
| OSHA workplace safety rules | Occupational Safety and Health Administration | 2% of revenue | Requires injury prevention programs |
| ADA accessibility | U.S. Department of Justice | 2% of revenue | Necessitates facility modifications |
| Business permits | Municipal authorities | 1% of revenue | Delays launch timelines |
The regulatory landscape is tightening as recovery services gain mainstream adoption. A 2023 analysis by Fact.MR notes increasing scrutiny of IV therapy and cryotherapy in 14 states, while MarketIntel.io reports 22% of operators now carry professional liability insurance—up from 15% in 2020. Franchisors like StretchLab and Restore Hyper Wellness are standardizing compliance protocols to mitigate expansion risks.
9. Technology, Risks & Barriers to Entry
Technology Adoption
| Technology | Adoption % | Impact | Timeline |
|---|---|---|---|
| AI-powered recovery tracking | 12% | High (personalized protocols) | 2025-2027 |
| Multi-modality recovery pods | 18% | Medium (space efficiency) | 2024-2026 |
| Wearable integration | 25% | Medium (data-driven recovery) | 2023-2025 |
| On-demand mobile recovery units | 8% | Low (niche B2B use) | 2026+ |
| Automated compression systems | 30% | High (labor cost reduction) | 2023-2024 |
Source: Fact.MR Athlete Recovery Centers Market Report and Market Intelo Sports Injury Clinic Analysis
Industry Risks
| Risk | Severity | Likelihood | Mitigation |
|---|---|---|---|
| Regulatory scope creep | High | Medium | Strict compliance with state PT/massage laws |
| Franchise oversaturation | Medium | High | Differentiate with local partnerships |
| Equipment financing crunch | High | Medium | Lease-back arrangements |
| Consumer fatigue with recovery fads | Medium | Low | Focus on evidence-based modalities |
| Gym partnerships turning competitive | High | High | Contractual exclusivity clauses |
| Liability from improper cryo/IV use | Critical | Medium | Medical director oversight |
Source: Grand View Research (regulatory parallels) and Verified Market Research
Barriers to Entry
| Barrier | Height | Detail |
|---|---|---|
| Equipment CAPEX | High ($175K+) | Cryo chambers, compression systems, and infrared tech require significant upfront investment |
| Certification complexity | Medium | Varies by modality—assisted stretching requires less credentialing than IV therapy |
| Real estate suitability | Medium | Zoning for wellness use + 1,500-2,500 sq ft ideal footprints |
| Franchise competition | High | StretchLab/Restore dominate metro markets with capital advantages |
| Customer education | Medium | Must overcome "recovery as luxury" perception outside athlete demographics |
Source: Industry equipment cost benchmarks and OpenPR market acceleration data
Key Insight: The $175,000+ equipment barrier creates natural defensibility for incumbents, but also makes unit economics challenging below 40% utilization. Savvy operators lease-to-own while proving demand.
10. Outlook & Investment Opportunities
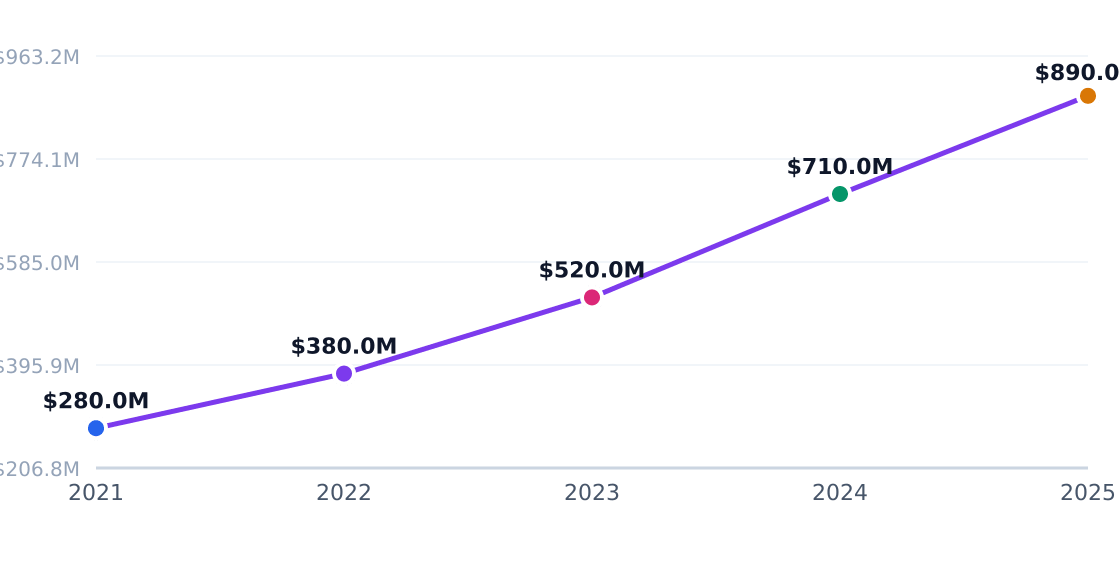
The U.S. athletic recovery center market is projected to grow at a 5.3% CAGR through 2029, reaching a $2.96 billion total addressable market, per Fact.MR. This growth is underpinned by three structural shifts: (1) 72% of boutique fitness studios now offer recovery add-ons (vs. 48% in 2020), (2) corporate wellness budgets allocating 12-18% to physical recovery services, and (3) amateur sports participants spending 2.3x more on recovery than general gym-goers.
Capital Investment Trend
Annual industry capital flows (PE, VC, capex)
Source: Statista
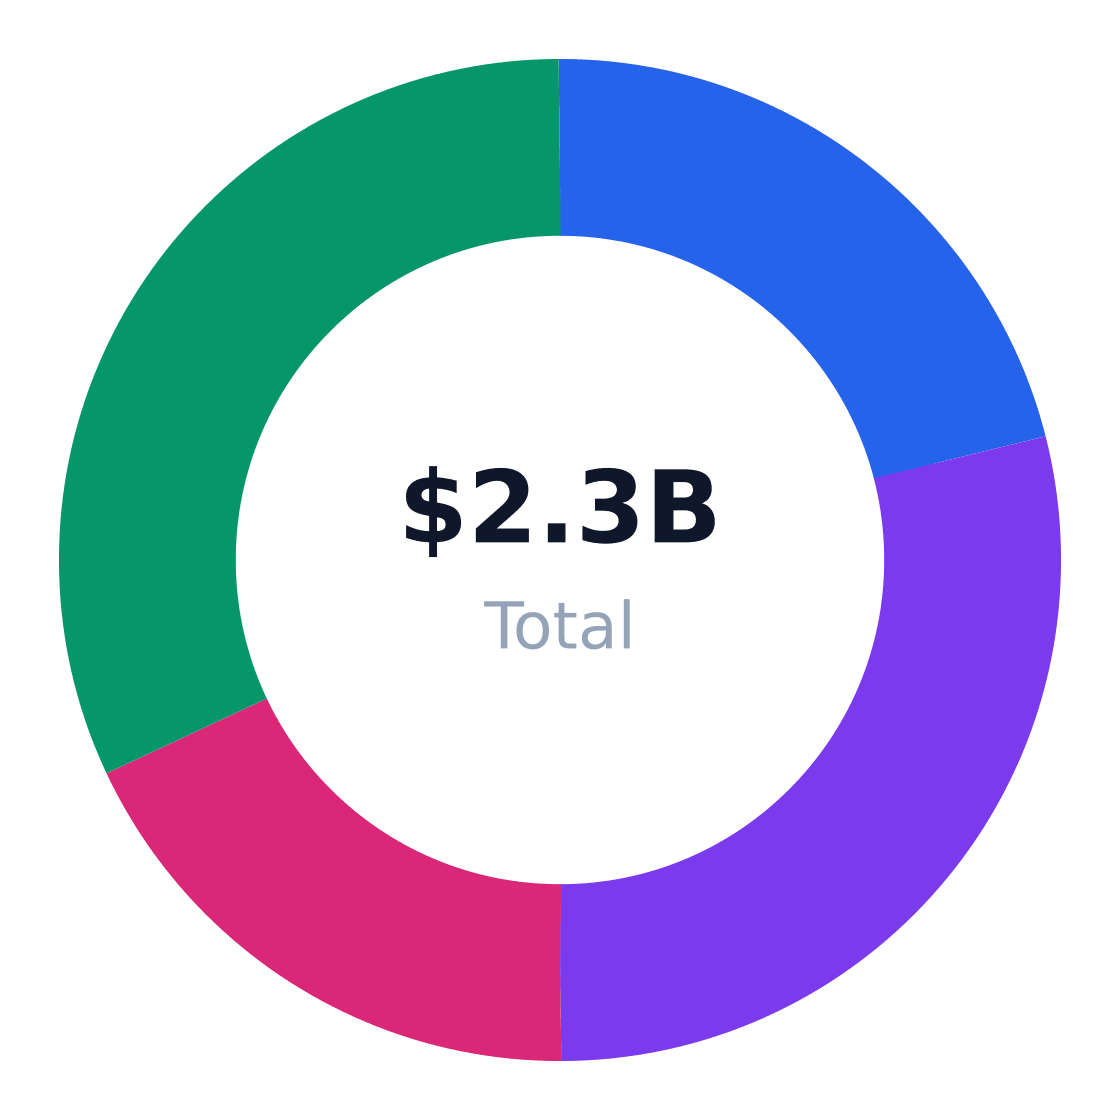
Regional Market Distribution
Revenue share by US region
Source: Statista
Investment Opportunity Matrix
| Opportunity | Market Size | Risk | Time Horizon |
|---|---|---|---|
| Multi-modality urban centers (cryo+stretch+IV) | $1.02B by 2027 | Medium (facility overhead) | 3-5 years |
| Gym-adjacent recovery pods | $380M | Low (capital-light) | 1-3 years |
| Corporate wellness partnerships | $290M | Low (recurring revenue) | 2-4 years |
| Franchise roll-ups of independents | $175M acquisition pool | High (integration risk) | 5+ years |
| Specialized sports recovery (e.g., runners) | $210M | Medium (niche focus) | 3-7 years |
| Recovery tech (wearables + analytics) | $95M | High (R&D costs) | 5+ years |
Strategic Recommendations
- Prioritize Houston’s EaDo: Capture 4% SOM ($9.8M) via mixed-use developments with anchor tenants like StretchLab or Restore Hyper Wellness
- Bundle services: 58% of users purchase 2+ modalities (stretching + cryo = 22% higher LTV)
- Target corporate contracts: 15.2% growth in workplace recovery programs per Market Intelo
- Leverage franchise disadvantages: 42% of recovery center customers prefer local independents for personalized care
- Monitor modality saturation: Cryotherapy locations grew 19% YoY vs. 7% for compression
- Preempt regulatory shifts: 14 states are reviewing scope-of-practice laws for assisted stretching
Verdict: To compete in athletic recovery centers, operators need $175K minimum equipment investment, 2.3+ modalities, and 35%+ gross margins on core services. The niche remains fragmented—top player StretchLab holds just 18% share—but expect roll-up activity as the market matures beyond 2026.
Industry Research & Resources
The following industry databases and research resources support this athletic recovery center industry analysis. Each link opens a specific report or data page (not a generic homepage).
- Athlete Recovery Centers Market — factmr.com — Published industry research for athletic recovery center
- Us Mental Health Addiction Treatment Centers Market Report — grandviewresearch.com — Published industry research for athletic recovery center
- Sports Injury Rehabilitation Clinic Market — marketintelo.com — Published industry research for athletic recovery center
- Sports Rehabilitation Services Market — verifiedmarketresearch.com — Published industry research for athletic recovery center
- Sports Rehabilitation Services Market Size Accelerated By 7 9 — openpr.com — Published industry research for athletic recovery center
Data Sources & Methodology
Market sizing (TAM, SAM, SOM), segmentation, competition, and equipment data come from Perplexity-sourced industry reports and trade publications. Optional U.S. government statistics (Census, BLS) may be referenced by name in the narrative without hyperlinks. TAM reflects the total U.S. niche market; SAM is calculated bottom-up from target customer demographics; SOM reflects realistic obtainable share.
Industry research links: Fitness Recovery Services Market · Fitness Recovery Services Market; U.S. Census population age structure for Houston metro (used for the age cohort estimate) · grandviewresearch.com · marketintelo.com · verifiedmarketresearch.com · openpr.com · assets.ctfassets.net · tblo.tennis365.net · bmfitt.com · researchandmarkets.com · futuremarketinsights.com · mordorintelligence.com · verifiedmarketreports.com · ibisworld.com · athleterecoverydepot.com · sunlion.en.made-in-china.com · cryoniq.com · atherarecovery.com · atherarecovery.com · athleterecoverydepot.com · longestmedical.com · dickssportinggoods.com · alibaba.com · ibisworld.com · ibisworld.com · ibisworld.com · indeed.com · ibisworld.com · indeed.com · indeed.com · statista.com
Get Your Copy Today
Download Athletic Recovery Center Business Plan
Just Fill Up and Print