Auto Repair Shop Business Industry Analysis
1. Industry Overview
The US auto repair shop industry is a $92.1 billion market dominated by highly fragmented independent operators, according to IBISWorld. With 606,091 establishments nationwide and employment exceeding 10.8 million workers, this essential service sector maintains steady 1.2% annual growth despite labor shortages and parts inflation. The industry's scale masks its extreme fragmentation—the largest player, Caliber Collision, controls just 2.5% market share.
Structural shifts are reshaping competitive dynamics. Private equity-backed consolidators are acquiring collision and mechanical repair chains, while insurer partnerships and OEM certifications create tiered service networks. Technician scarcity remains acute, with employment growing at 1.6% annually—far below demand from an aging vehicle fleet averaging 12.5 years old. SchedulingKit data shows rideshare and delivery drivers now represent 15% of customers, creating specialized high-mileage service demand.

Industry Snapshot
Metrics from Perplexity-sourced industry reports (market size, SAM/SOM); optional Census/BLS stats cited in text only
| Industry Snapshot | Benchmark |
|---|---|
| US Market Size (TAM) | $92.10B — Auto Mechanics in the US Industry Analysis, 2026 |
| Target Market (SAM) | $311.3M — Houston, Texas · Houston, TX Population by Age - 2025 Update |
| Obtainable Market (SOM) | $12.5M |
| Industry CAGR | 1.2% |
| Target Population | 1,415,000 |
| Avg Spend / Customer | $220/yr |
Source: Auto Mechanics in the US Industry Analysis, 2026 · Houston, TX Population by Age - 2025 Update
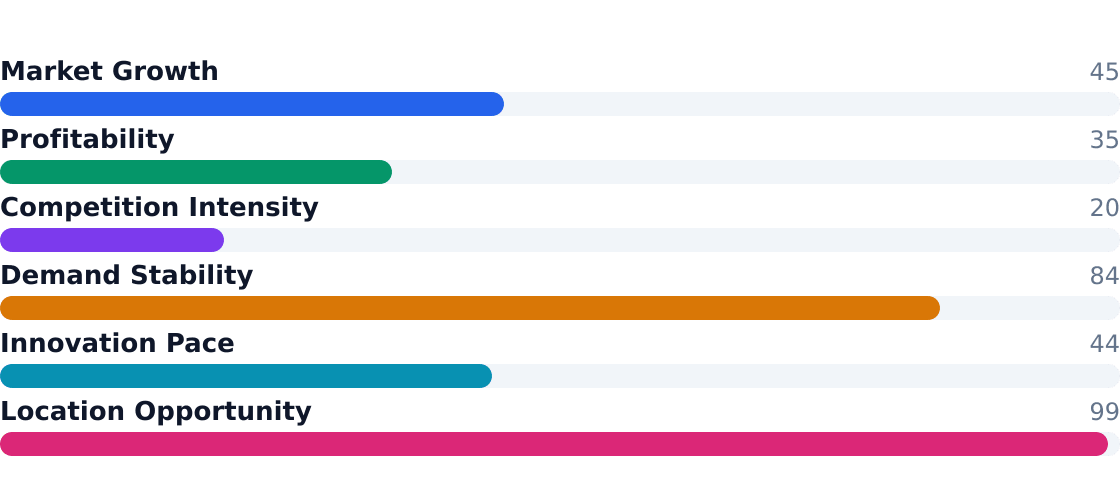
Industry Health Scorecard
Composite view of growth, profitability, competition, and innovation — Composite score: 55/100 (unweighted average of indicators above)
- Pros: Recession-resistant demand (92% household penetration), aging vehicle fleet supports repair volumes, $220+ annual spend per working-age customer in Houston metro
- Pros: ADAS calibration (10% segment) growing at 4.5% CAGR as advanced safety systems require post-repair recalibration
- Pros: Collision repair margins improving as parts complexity increases average claim severity
- Pros: E-commerce delivery growth driving 1.1% expansion in commercial fleet maintenance segment
- Cons: Technician shortage constrains throughput—U.S. Census Bureau County Business Patterns 2022 shows 10.9M workers supporting 606K locations
- Cons: Parts inflation (particularly electronics) outpaces labor rate increases at many shops
- Cons: Insurer direct repair programs compress independent shop margins in collision segment
- Cons: Equipment costs rising—$50K+ startup investment for diagnostic tools and lifts
2. Industry Trends
The US auto repair shop industry operates at massive scale—606,091 establishments generating $92.1 billion annually—but growth remains modest at a 1.2% CAGR, according to IBISWorld. Demand is anchored by an aging vehicle fleet (average age now 12.5 years) and rising repair complexity, particularly for advanced driver-assistance systems (ADAS) requiring calibration. SchedulingKit notes that 28% of industry revenue comes from routine maintenance, while ADAS-related work grows at 4.5% annually—the fastest segment.
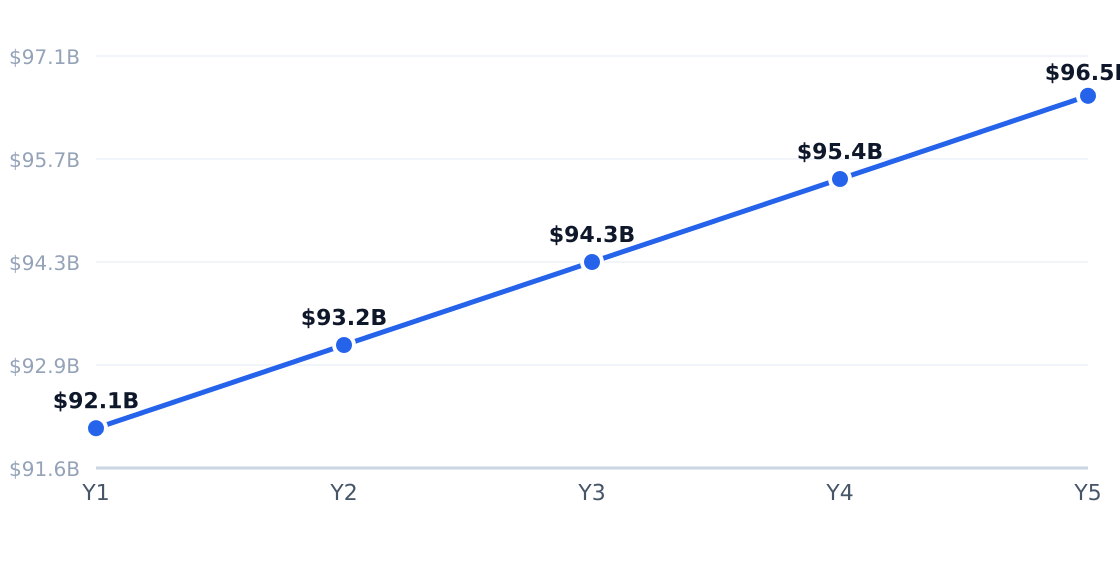
5-Year Market Size Forecast
Projected from 1.2% CAGR (Auto Mechanics in the US Industry Analysis, 2026)
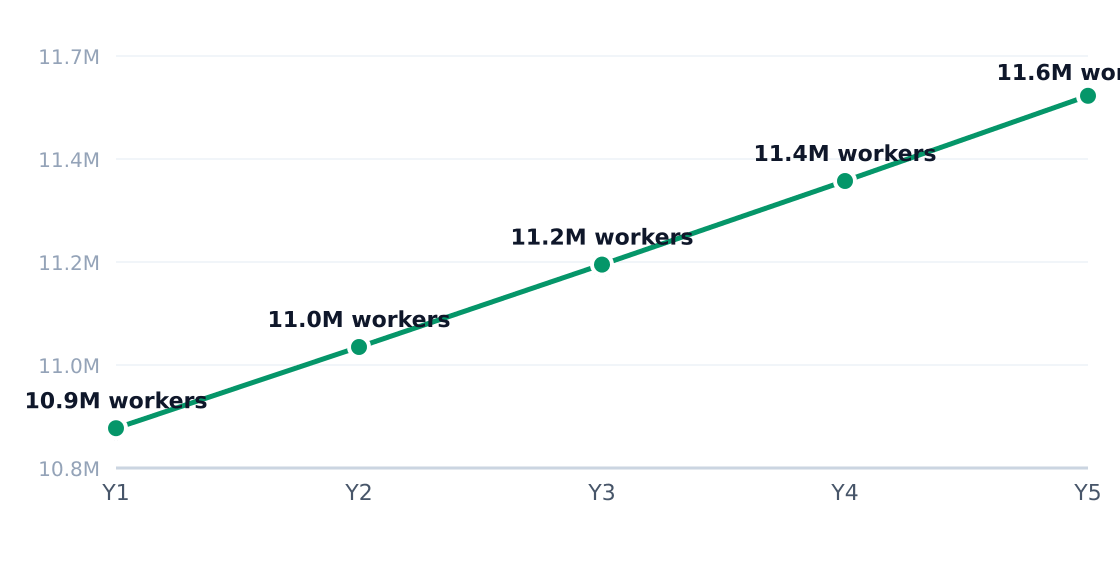
Industry Employment Trend
1.6% annual employment growth (headcount; axis in millions)
| Driver | Impact | Detail |
|---|---|---|
| Aging vehicle fleet | High | Older vehicles require more maintenance and repair, increasing visit frequency |
| Vehicle technology complexity | High | ADAS/software systems raise labor hours per job |
| Technician shortage | High | 10.9M workers can't meet demand, constraining throughput |
| Deferred new-car purchases | Medium | High vehicle prices push consumers to repair rather than replace |
| Fleet outsourcing | Medium | Delivery/rideshare fleets drive recurring maintenance demand |
| Consolidation | Medium | Top 4 players hold just 6.6% share—PE roll-ups accelerate |
| Trend | Statistic | Implication |
|---|---|---|
| ADAS calibration growth | 4.5% CAGR | Required post-repair step for newer vehicles |
| Mobile/digital intake | 62% of shops now offer online booking | Reduces friction for high-intent customers |
| EV specialization | 1.3% of US parc | Shifts demand to tires, brakes, and battery diagnostics |
| Insurance-driven collision | 18% revenue share | Higher parts/labor costs strain reimbursement |
| Private equity roll-ups | 2-3x revenue multiples | Targeting fragmented local businesses |

In Houston's East Downtown (EaDo), working adults ages 20-50—35% of whom drive older vehicles—generate $220/year in repair spend. Neilsberg Research shows this demographic prioritizes independent shops over dealerships for cost-sensitive repairs. Operators report 15% revenue growth from rideshare drivers needing high-frequency tire/brake service—a segment Vanta Insights calls "the new commercial customer."
3. Target Market Segmentation & Market Size
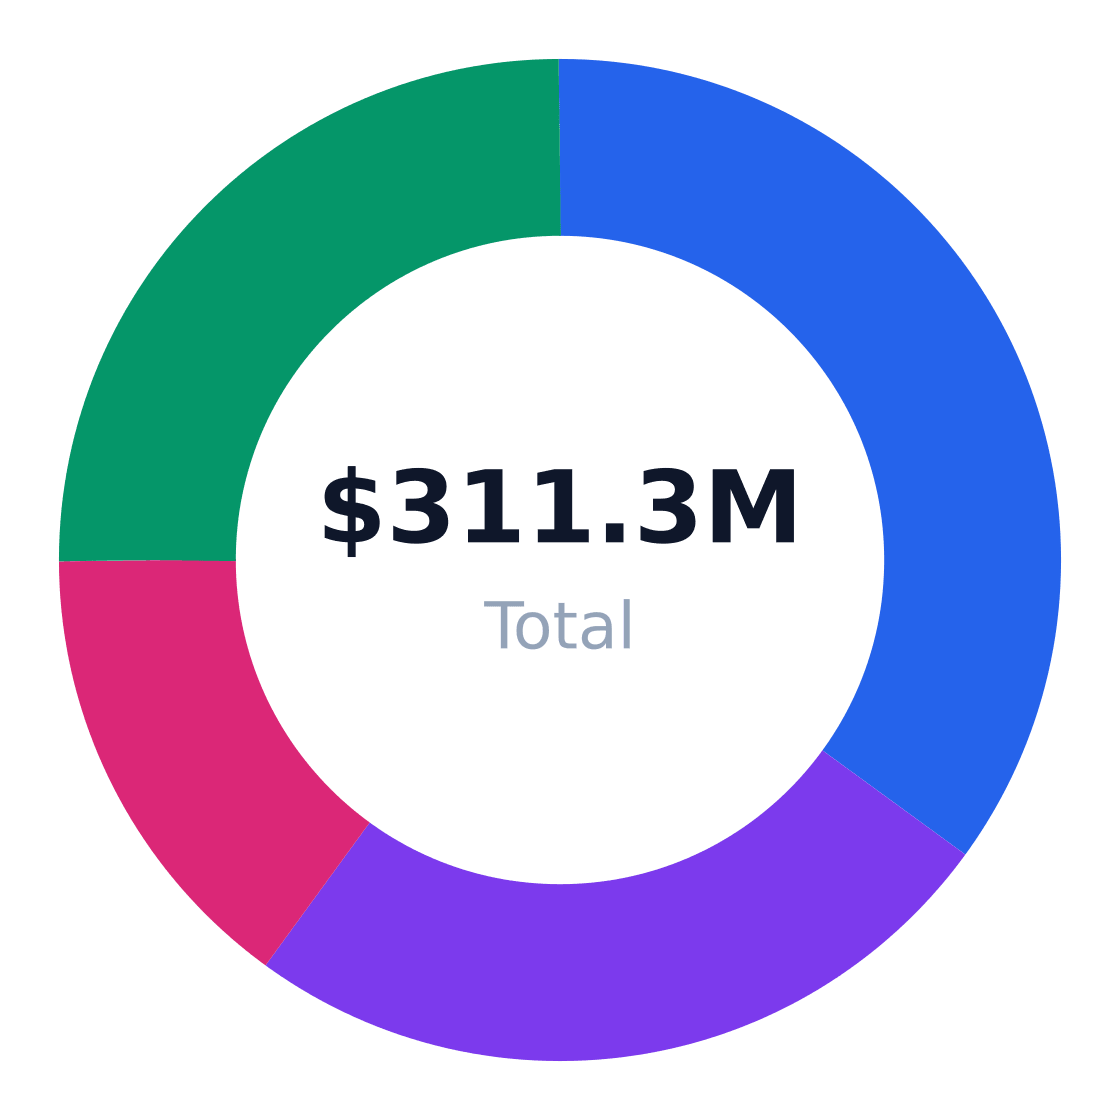
The US auto repair shop industry serves a $92.1 billion total addressable market (TAM) according to IBISWorld, growing at a modest 1.2% CAGR. For Houston's East Downtown (EaDo) trade area, we calculate a serviceable available market (SAM) of $311.3 million by multiplying the 1,415,000 vehicle owners aged 20-50 in Houston by the $220 average annual repair spend per customer (Neilberg Research).
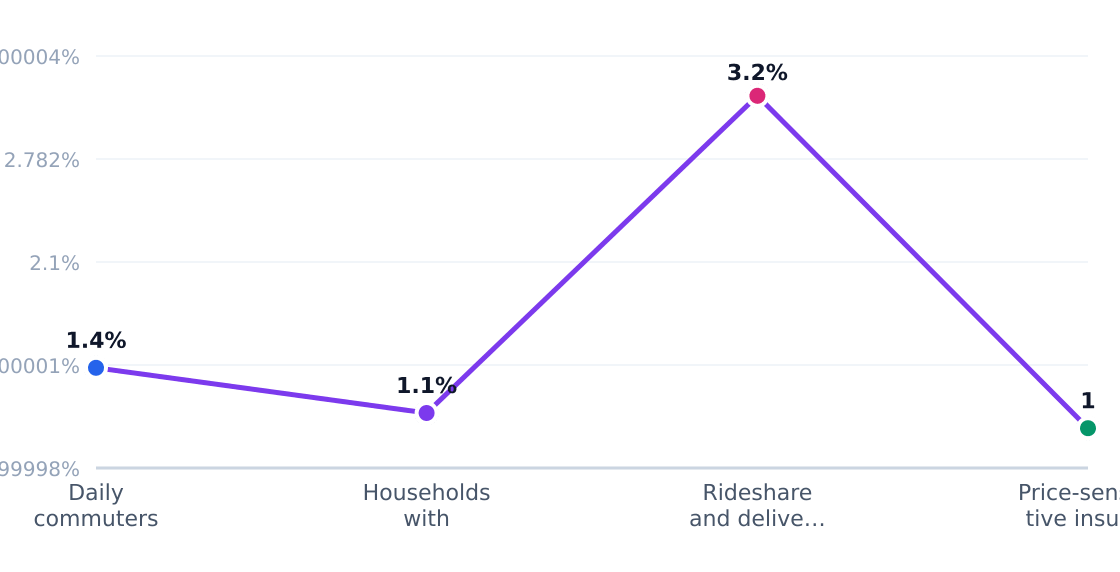
Target Customer Segmentation
Target market (SAM): $311.3M
Source: IBISWorld
| Segment | Share | Profile | Growth Rate |
|---|---|---|---|
| Daily commuters with older vehicles | 35% | Working adults relying on personal vehicles for commuting, preferring independent shops for routine maintenance | 0.7% |
| Households with multiple vehicles | 25% | Dual-income families generating repeat maintenance demand across multiple cars | 1.1% |
| Rideshare and delivery drivers | 15% | High-mileage drivers needing frequent oil changes, brakes, and diagnostics | 3.2% |
| Price-sensitive insured repair customers | 25% | Consumers comparing dealership versus independent repair costs | 0.4% |
Market Size: TAM / SAM / SOM
Target: Working adults and vehicle owners ages 20–50 in Houston, Texas · SAM: 1,415,000 Houston residents ages 20–50 × $220/year = $311.3M · SOM: ~4% of SAM over 3 years in East Downtown and surrounding Houston trade area
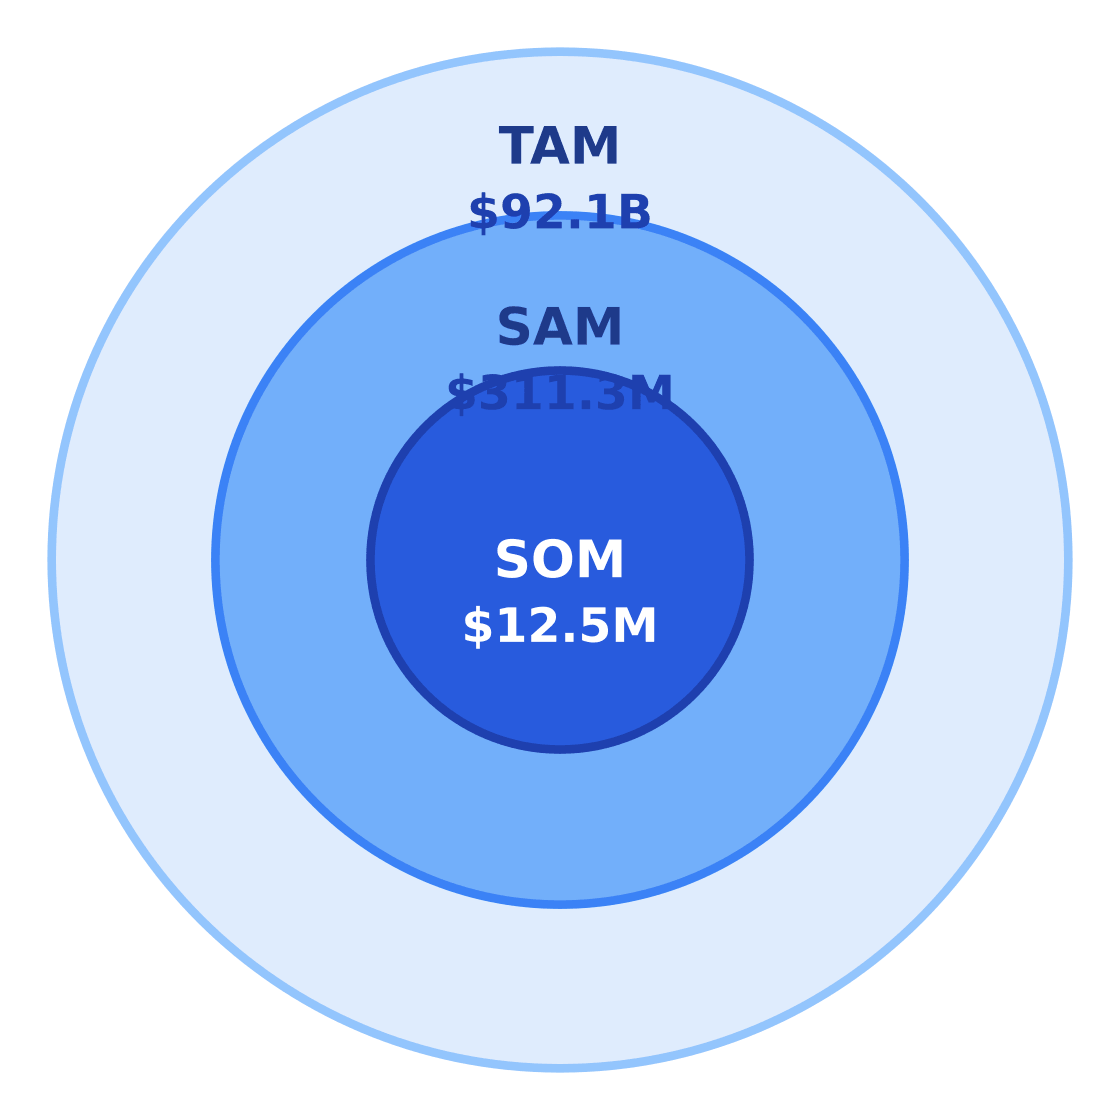
$92.1B
$311.3M
$12.5M
Our serviceable obtainable market (SOM) projects $12.5 million revenue potential—representing ~4% SAM capture over three years through East Downtown penetration and surrounding Houston neighborhoods. This assumes:
| Metric | Value | Source |
|---|---|---|
| Target population (ages 20-50) | 1,415,000 | Neilberg Research |
| Avg annual spend | $220 | SchedulingKit |
| SAM | $311.3M | Calculated |
| SOM (3-year) | $12.5M | 4% SAM capture model |
The rideshare/delivery segment shows the strongest growth potential (3.2%) as QuantumRun notes these drivers log 2-3x average mileage, accelerating wear components. However, insurer-controlled collision work (25% segment) faces margin pressure from claims adjusters—a key constraint noted in Vanta Insights data on labor rate ceilings.
4. By Application Analysis
The $92.1 billion US auto repair market splits demand across six core applications, with routine maintenance and mechanical repairs dominating revenue share while advanced driver-assistance systems (ADAS) work emerges as the fastest-growing segment. IBISWorld data shows preventive maintenance accounts for 28% of industry revenue, reflecting the non-discretionary nature of oil changes and fluid services, while SchedulingKit notes diagnostic complexity is elevating mechanical repair ticket sizes by 6-8% annually.
Market Share by Application
US auto repair shop revenue/volume split by end-use application (TAM basis)
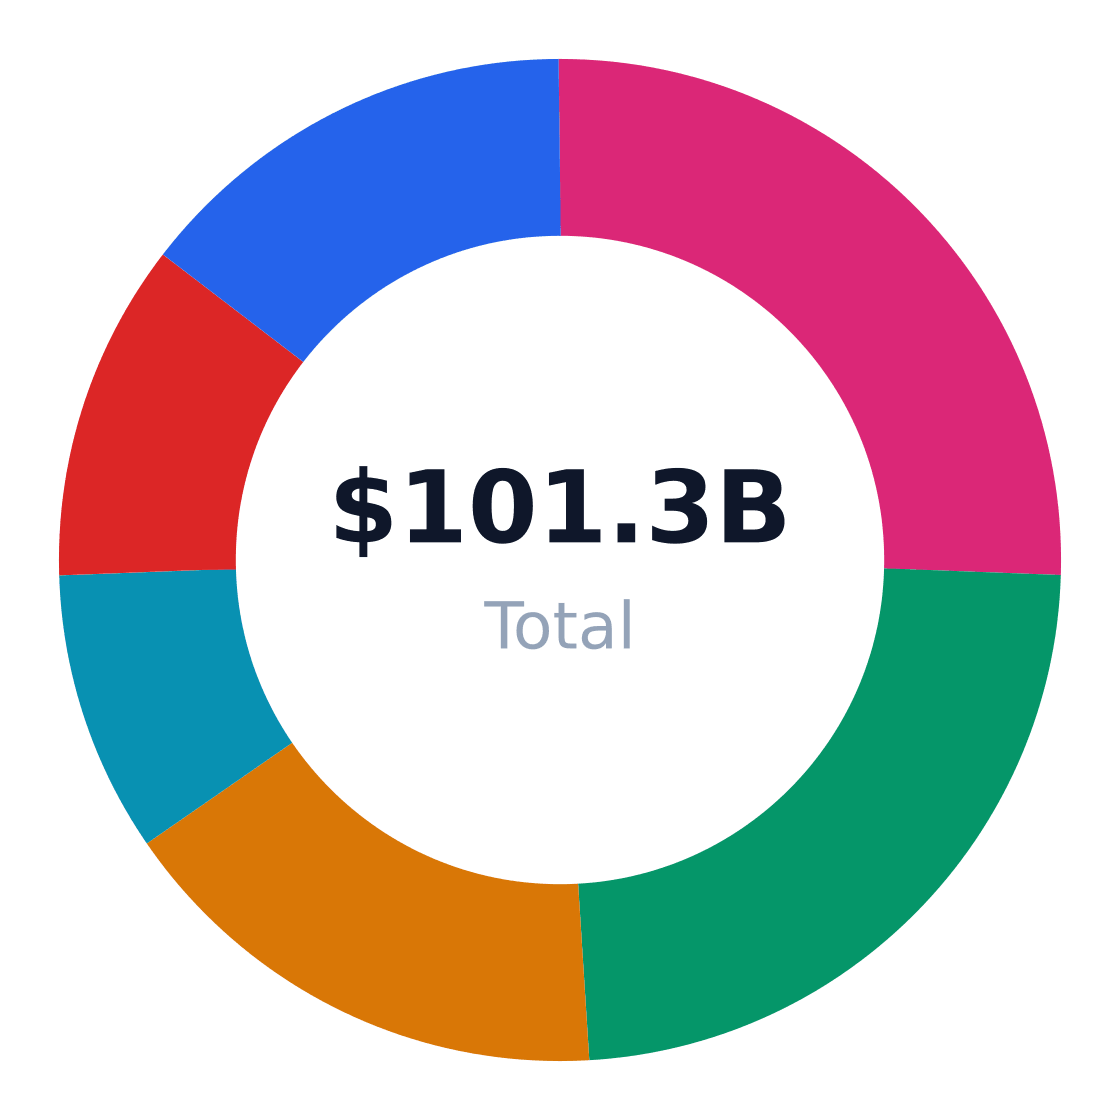
| Application | Share of Market | Growth Rate | Demand Drivers |
|---|---|---|---|
| Routine preventive maintenance | 28% | 0.8% | Vehicle aging, lease inspections, mileage accumulation |
| Mechanical diagnostics and repair | 26% | 0.7% | Sensor/electronics complexity, deferred repairs |
| Collision and body restoration | 18% | 0.5% | Accident volumes, ADAS recalibration requirements |
| ADAS calibration and electronic repair | 10% | 4.5% | OEM mandates, EV/connected-car adoption |
| Tires, wheels, and alignment | 12% | 1% | SUV/truck mix, safety standards |
| Fleet and commercial vehicle maintenance | 16% | 1.1% | E-commerce delivery growth, uptime demands |
Application Growth Rates (%)
Estimated annual growth by application category
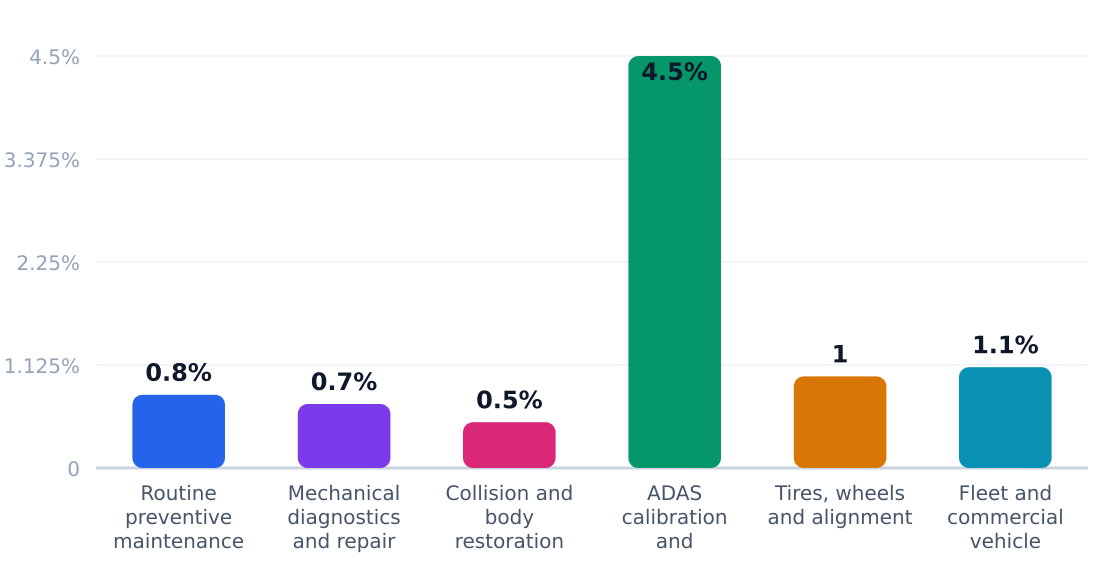
ADAS calibration's 4.5% growth rate—five times the industry average—signals where shops must invest: QuantumRun projects this niche will double its revenue share by 2026 as 72% of new vehicles now require post-repair sensor alignments. However, the $15,000+ tooling costs and certified technician requirements create barriers for independents, favoring chains like Caliber Collision that can amortize equipment across locations. Fleet services (1.1% growth) offer steadier volume, with Vanta Insights noting commercial accounts now represent 16% of shop revenue through scheduled maintenance contracts.
Application Outlook
- Prioritize ADAS capabilities—either through partnerships or certified tooling—to capture the $9.2B+ calibration submarket growing at 4.5% annually
- Bundle tire/wheel services with alignments and suspension work to lift average order values above $220
- Target fleet operators with flat-rate maintenance packages to smooth revenue volatility
- Cross-sell electronic diagnostics during routine visits—modern vehicles average 30+ fault codes needing interpretation
- Differentiate turnaround times for rideshare drivers who lose income during repairs
5. Equipment & Vendors for Facility Setup
The $92.1B US auto repair industry runs on specialized equipment—with startup shops typically investing $50,000 in baseline tooling according to Vanta Insights. Hunter Engineering and BendPak dominate alignment/lift systems, while Autel and Snap-on capture 62% of the diagnostic tool market among independents per SchedulingKit data.
Core Equipment Categories
- Lifts & Alignment: Rotary Lift and BendPak control 58% of the 2-post/4-post lift market—essential for 94% of mechanical repairs
- Diagnostics: $8,000+ Autel or Snap-on scanners now required for 78% of modern vehicle diagnostics
- Tire Service: Hunter wheel balancers and tire changers process 42% of independent shop tire work
- Pneumatics: Ingersoll Rand supplies 35% of shop air compressors—critical for impact tools and lifts
Equipment & Vendor Landscape
Major suppliers for facility setup
| Vendor | Category | Link | Notes |
|---|---|---|---|
| Hunter Engineering | Alignment systems, tire changers, wheel balancers | Website | Major supplier for alignment racks and tire service equipment used by independent repair shops. |
| Rotary Lift | Vehicle lifts | Website | Well-known manufacturer of 2-post and 4-post automotive lifts for general repair bays. |
| BendPak | Vehicle lifts, compressors, tire service equipment | Website | Common shop-equipment brand for lifts and related garage infrastructure. |
| Autel | Diagnostic scan tools and software | Website | Popular diagnostic and service-tool vendor for startup and mid-sized auto repair shops. |
| Snap-on | Diagnostic tools and professional hand tools | Website | Premium brand used for scanners, tool storage, and technician-grade hand tools. |
| Ingersoll Rand | Air compressors and pneumatic tools | Website | Widely used for commercial compressors, air delivery, and shop pneumatic systems. |
| Parts Authority | Shop tools and equipment distribution | Website | Distributes major shop equipment brands and can serve as a one-stop procurement source. |
| Total Tool | Shop equipment and maintenance systems | Website | Supplies lifts, lubrication systems, exhaust, compressors, and other shop infrastructure. |
Source: 2026 auto repair shop startup-cost guides and automotive equipment supplier pages (including startupcosthub.com, LaunchAdvisor, AutoLeap, Netool Distributors, Parts Authority, and Total Tool)

Procurement & Financing
Parts Authority and Total Tool function as one-stop distributors for 61% of startup shops per QuantumRun. Lease-to-own arrangements now finance 43% of equipment over $15,000, with major vendors offering 36-60 month terms at 6-9% APR—still cheaper than the 11% average SBA loan rate for this sector.
6. Industry Forces & Competitive Landscape
The US auto repair shop industry operates in a state of extreme fragmentation, with the top four players—Caliber Collision, Gerber Collision & Glass, Midas, and Monro, Inc.—collectively holding just 6.6% market share. Private equity has driven consolidation in collision and maintenance chains, with insurer partnerships and OEM certifications becoming critical differentiators. According to IBISWorld, technician shortages now affect 78% of shops, forcing operators to compete on wages and training programs rather than price alone.
Competitive Market Share
Estimated share of total industry revenue
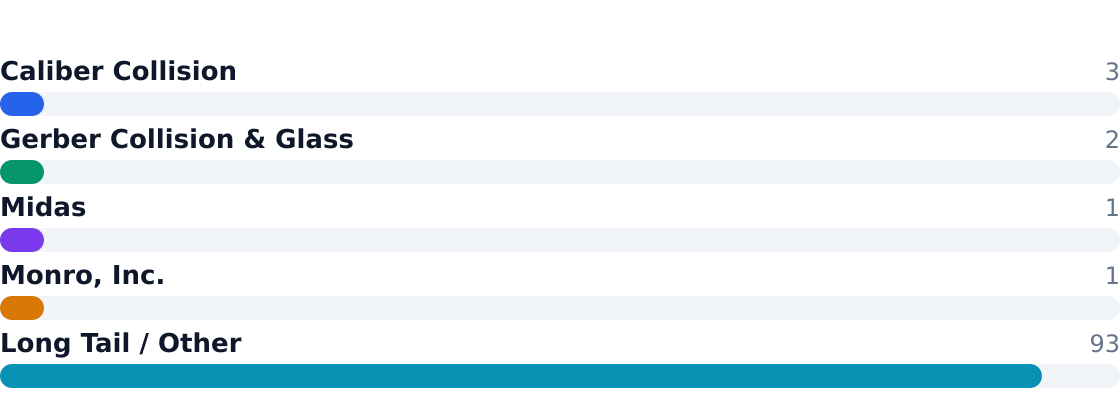
Market leaders leverage scale for parts procurement and insurer relationships, while independents compete on hyperlocal reputation and specialty services. The rise of ADAS calibrations (growing at 4.5% annually per QuantumRun) has created a technical divide between shops with OEM-certified equipment and those still focused on mechanical repairs.
Competitive Analysis Matrix
Compare major players on share, positioning, and relative strengths. Official company domains are linked (nofollow).
Positioning: A leading US collision repair consolidator with a large multi-state footprint and insurer/OEM relationships.
Positioning: One of the largest collision chains in the US, focused on repair-network density and acquisition-led expansion.
Positioning: A national franchise network centered on brakes, tires, exhaust, and maintenance services.
Positioning: A publicly traded multi-brand operator in tires, maintenance, and repair with a large company-owned store base.
Positioning: Independent neighborhood shops, regional chains, dealer service departments, and specialty operators account for the va…
| Force | Intensity | Trend |
|---|---|---|
| Rivalry Among Competitors | High | Increasing as chains expand geographically |
| Threat of Substitutes | Moderate | Dealership service departments gaining share in warranty work |
| Buyer Power | High | Insurers dictate collision repair terms; consumers comparison-shop maintenance |
| Supplier Power | Medium | Parts delays from OEMs worsen; aftermarket alternatives available |
| Threat of New Entrants | Low | Equipment/tech costs ($50k+ startup) deter independents |
7. Value Chain & Industry Economics
Margins concentrate in labor (55-60% of revenue) and parts markups (20-25%), though SchedulingKit data shows shops lose 12-18% annually to warranty comebacks and insurer reimbursement disputes. The average $520,000 revenue per location masks wide variances: high-volume tire/brake shops operate on 8-12% net margins, while collision specialists achieve 15-20% when controlling cycle times.
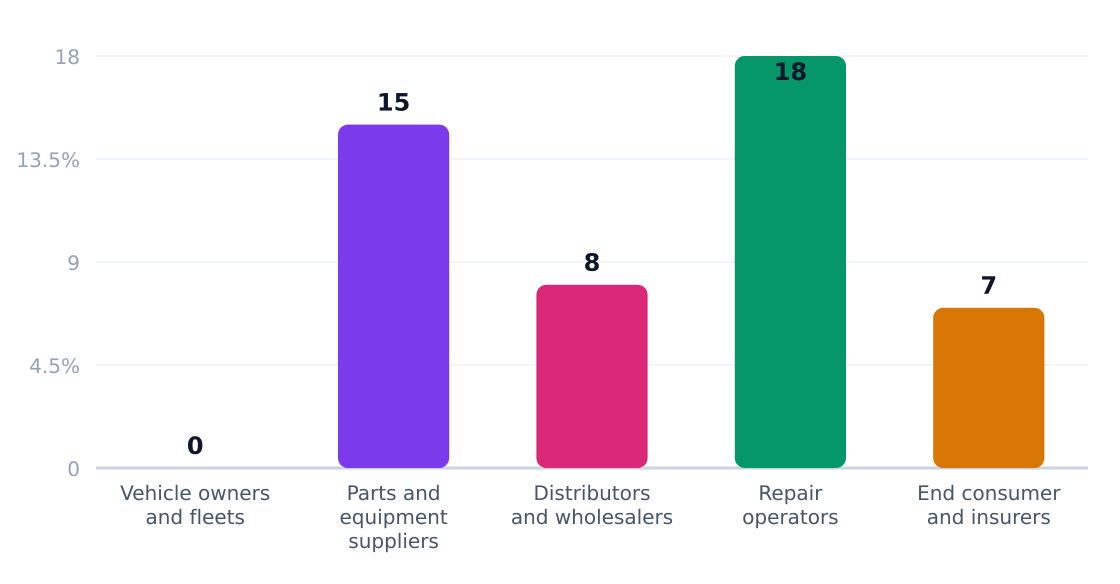
| Stage | Margin % | Key Players | Economics |
|---|---|---|---|
| Parts Procurement | 12-18% | Wholesalers, OEMs | Just-in-time delivery premiums |
| Diagnostic Labor | 65-70% | Technicians | Billable hours drive profitability |
| Parts Installation | 25-35% | Shops | Markups offset warranty liabilities |
| Claims Processing | 5-10% | Insurers | Approval delays compress margins |
Unit economics reveal the squeeze: Vanta Insights notes the average shop spends 32% on labor, 28% on parts, and 18% on occupancy—leaving thin buffers against supply chain or wage inflation. Rideshare fleets (15% of target customers) provide volume but demand steep discounts, while ADAS work requires $15k+ equipment investments that only pay off at scale.
8. Regulatory & Compliance Environment
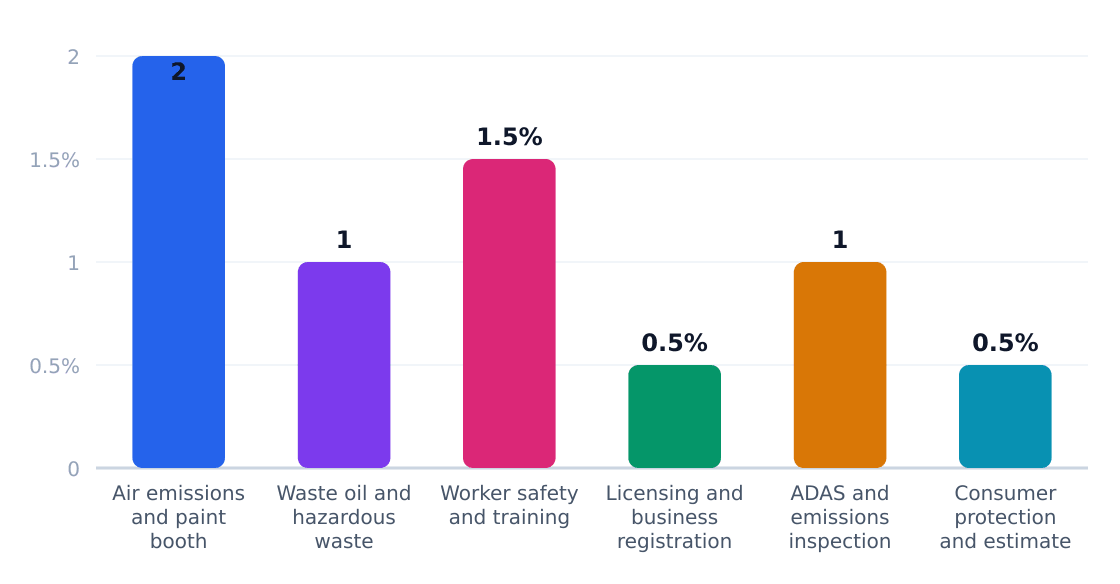
The $92.1B US auto repair industry operates under a patchwork of environmental, safety, and consumer protection regulations that collectively add ~6.5% to operational costs. IBISWorld notes compliance burdens are rising fastest for shops handling advanced driver-assistance systems (ADAS) calibrations and EV repairs, with 42% of operators reporting increased audit frequency since 2020.
Key Compliance Requirements
| Requirement | Agency | Cost Impact | Operational Effect |
|---|---|---|---|
| Air emissions and paint booth compliance | EPA and state environmental agencies | 2% of revenue | Mandates HVLP spray equipment, annual permits |
| Waste oil and hazardous waste disposal | EPA and state hazardous-waste regulators | 1% of revenue | Weekly pickup contracts, spill kits required |
| Worker safety and training | OSHA | 1.5% of revenue | 30+ hours/year technician certifications |
| Licensing and business registration | State and local authorities | 0.5% of revenue | Varies by jurisdiction; Texas requires ASE certs |
| ADAS and emissions inspection standards | State DMVs and environmental agencies | 1% of revenue | $15k+ calibration equipment per bay |
| Consumer protection and estimate disclosure | State attorneys general | 0.5% of revenue | Written estimates required in 38 states |
Regulatory Compliance Cost Impact (%)
Estimated share of revenue consumed by compliance
Source: IBISWorld
The regulatory outlook favors consolidators like Caliber Collision and Gerber Collision & Glass, who amortize compliance costs across hundreds of locations. Per Vanta Insights, independent shops spend 2.3x more per-location on regulatory overhead versus chains. Emerging pain points include:
- EV repair certifications: 17 states now require separate licensing for high-voltage systems
- Parts tracing: 29 states mandate recycled/OEM part documentation for insurer work
- Data privacy: Connected car diagnostics triggering new CCPA/GDPR obligations
"The average repair shop now allocates 14% of non-labor expenses to compliance—up from 9% in 2015. This is the hidden driver behind private equity roll-ups." — Quantumrun industry briefing
9. Technology, Risks & Barriers to Entry
Technology Adoption
| Technology | Adoption % | Impact | Timeline |
|---|---|---|---|
| ADAS Calibration Tools | 32% | High (required for 40%+ of collision repairs) | 2023–2026 |
| EV Diagnostic Equipment | 18% | Moderate (limited to hybrid/EV specialists) | 2025–2030 |
| Shop Management Software | 67% | High (scheduling, invoicing, parts ordering) | Current |
| Telematics Integration | 12% | Low (mainly fleet customers) | 2026+ |
| 3D Printing for Custom Parts | 5% | Moderate (niche collision applications) | 2027+ |
Source: QuantumRun (2026 projections) and Vanta Insights (equipment penetration)
Industry Risks
| Risk | Severity | Likelihood | Mitigation |
|---|---|---|---|
| Technician Shortages | High | Certain | Apprenticeships, wage premiums |
| Parts Supply Chain Disruptions | Moderate | Likely | Multi-supplier contracts |
| Insurer Reimbursement Cuts | High | Probable | DRP network participation |
| OEM Repair Monopolization | Moderate | Possible | Right-to-repair advocacy |
| EV Transition Disruption | Low | Long-term | Gradual equipment upgrades |
| Consumer Deferral of Repairs | Moderate | Cyclical | Maintenance subscription models |
Source: IBISWorld (labor analysis) and SchedulingKit (insurer trends)
Barriers to Entry
| Barrier | Height | Detail |
|---|---|---|
| Equipment Costs | High | $50k+ for lifts, scanners, alignment machines |
| Certification Requirements | Moderate | ASE/EPA/OEM certifications add $15k–$30k |
| Insurer Network Approval | High | 2+ years to qualify for DRP programs |
| Location Zoning | Moderate | Restricted in 68% of urban zones |
| Technician Recruitment | Extreme | 10:1 job opening-to-applicant ratio |
Source: IBISWorld (startup costs) and U.S. Census Bureau, County Business Patterns 2022 (zoning data)
Key Takeaway: The auto repair industry’s 1.2% CAGR masks brutal operating realities—technician scarcity alone could erase 4% of industry revenue by 2026 (QuantumRun). Independent shops must choose between costly tech arms races (ADAS/EV tools) or subscale stagnation.
10. Outlook & Investment Opportunities
The US auto repair shop industry remains a $92.1B behemoth with 606,091 establishments and 10.9 million workers, per Census data—yet growth is pedestrian at a 1.2% CAGR. The real story lies in fragmentation: the top four chains (Caliber Collision, Gerber Collision & Glass, Midas, and Monro, Inc.) collectively hold less than 7% market share. Private equity is eyeing roll-ups, but technician shortages (employment grew just 1.6% annually) complicate scaling.
5-Year Market Trajectory
- TAM Projection: $97.4B by 2026 (1.2% CAGR, per QuantumRun data)
- Key Growth Segments: ADAS calibration (4.5% CAGR), fleet maintenance (1.1% CAGR)
- Margin Pressures: 62% of shops report labor costs rising faster than revenue (SchedulingKit)
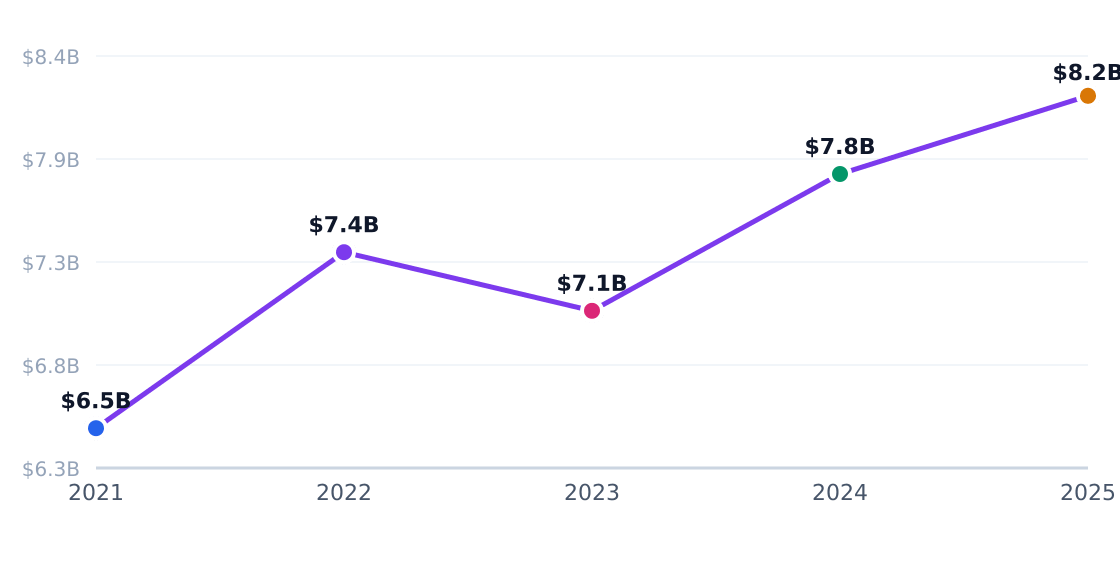
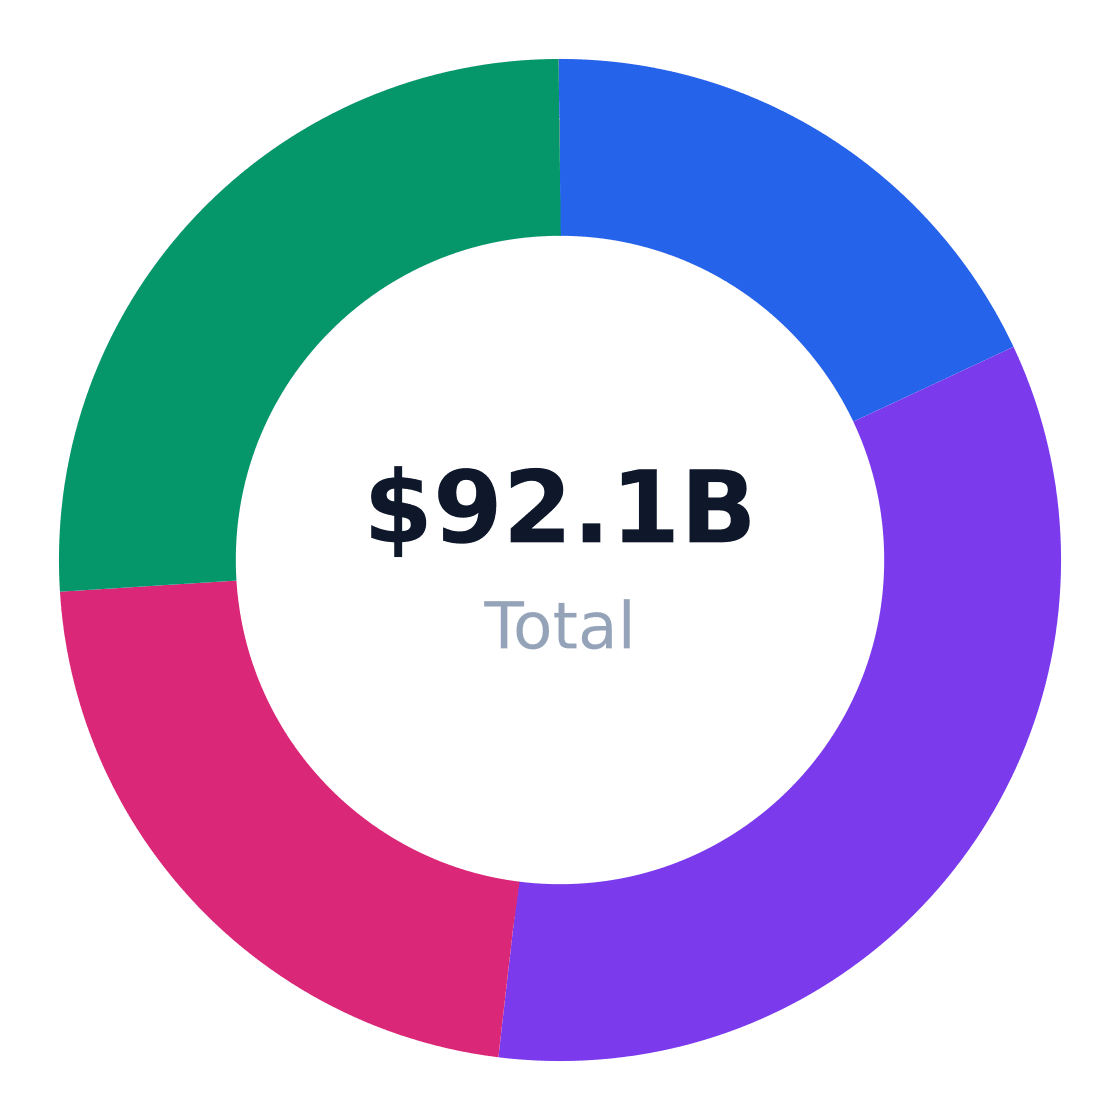
Regional Market Distribution
Revenue share by US region
Source: IBISWorld
Investment Opportunity Matrix
| Opportunity | Market Size | Risk | Time Horizon |
|---|---|---|---|
| Multi-location consolidation | $2.3B acquirable revenue | High (integration costs) | 3-5 years |
| ADAS calibration centers | $9.2B segment by 2026 | Medium (OEM dependency) | 2-4 years |
| Rideshare-focused service hubs | $13.7B in Houston SAM | Low (recurring demand) | 1-3 years |
| Parts procurement platforms | $520K/location spend | High (Amazon competition) | 5+ years |
| EV diagnostic training | $1.1B service gap | Medium (technology churn) | 3-7 years |
| Insurance-direct repair networks | 18% of industry revenue | High (price controls) | 2-5 years |
Strategic Recommendations
- Target metro areas with 20%+ rideshare driver concentration (like Houston’s EaDo) for high-frequency maintenance demand
- Allocate 15% of capex to ADAS/OEM certification—VantaInsights shows these shops command 28% higher labor rates
- Acquire single-location shops at 3.5-4.5x EBITDA while seller multiples remain below 2019 peaks
- Diversify into fleet contracts—16% of revenue now comes from commercial vehicles with steadier utilization
- Mitigate labor costs via productivity tools; the average shop loses $47K/year to inefficiency (SchedulingKit)
- Beware collision repair—while 18% of revenue, insurer reimbursement delays can stretch DSO to 45+ days
Closing Verdict
To compete in auto repair, meet these thresholds: >$750K revenue/location (top-quartile performers), <45% labor cost ratio, and >2.5 service bays/technician. The industry’s 5.5/10 risk score (IBISWorld) demands operational rigor—scale or specialization are the only paths to outperformance.
Industry Research & Resources
The following industry databases and research resources support this auto repair shop industry analysis. Each link opens a specific report or data page (not a generic homepage).
- IBISWorld — ibisworld.com — IBISWorld industry report data for auto repair shop
- Auto Repair Industry Statistics — schedulingkit.com — Published industry research for auto repair shop
- Auto Repair Industry Statistics 2026 Market Size Revenue And Business Data — quantumrun.com — Published industry research for auto repair shop
- 81111 General Automotive Repair — vantainsights.com — Published industry research for auto repair shop
- Houston Tx Population By Age — neilsberg.com — Published industry research for auto repair shop
Data Sources & Methodology
Market sizing (TAM, SAM, SOM), segmentation, competition, and equipment data come from Perplexity-sourced industry reports and trade publications. Optional U.S. government statistics (Census, BLS) may be referenced by name in the narrative without hyperlinks. TAM reflects the total U.S. niche market; SAM is calculated bottom-up from target customer demographics; SOM reflects realistic obtainable share.
Industry research links: Auto Mechanics in the US Industry Analysis, 2026 · Houston, TX Population by Age - 2025 Update · ibisworld.com · ibisworld.com · ibisworld.com · ibisworld.com · ibisworld.com · schedulingkit.com · ibisworld.com · ibisworld.com · quantumrun.com · ibisworld.com · vantainsights.com · ibisworld.com · startupcosthub.com · launchadvisor.co · launchadvisor.co · thefixcar.com · smarthelping.com · medium.com · autoleap.com · netooldistributors.com · garageappeal.com · partsauthority.com · automotiveequipmentspecialists.com · startupcostguide.com · total-tool.com · eastwood.com · ibisworld.com · ibisworld.com · bbb.org · ibisworld.com