Baking Soda Industry Analysis
1. Industry Overview
The US baking soda industry is a $4.70 billion market (TAM) with steady 6.5% annual growth, driven by household, food, and industrial demand, according to Market Research Future. The market processes 1.6 million tons annually, with production slightly exceeding domestic consumption at 1.7 million tons, indicating a mature but trade-active sector as noted by Global Market Insights.
Industry Snapshot
Metrics from Perplexity-sourced industry reports (market size, SAM/SOM); optional Census/BLS stats cited in text only
| Industry Snapshot | Benchmark |
|---|---|
| US Market Size (TAM) | $4.70B — Baking Soda Market Size, Demand, Industry, Share, Trends and Forecast by 2035 |
| Target Market (SAM) | $76.6M — Houston, Texas · Baking soda TAM from Market Research Future; population input should be sourced from U.S. Census ACS age distribution for Houston metro |
| Obtainable Market (SOM) | $3.1M |
| Industry CAGR | 6.5% |
| Target Population | 1,236,000 |
| Avg Spend / Customer | $62/yr |
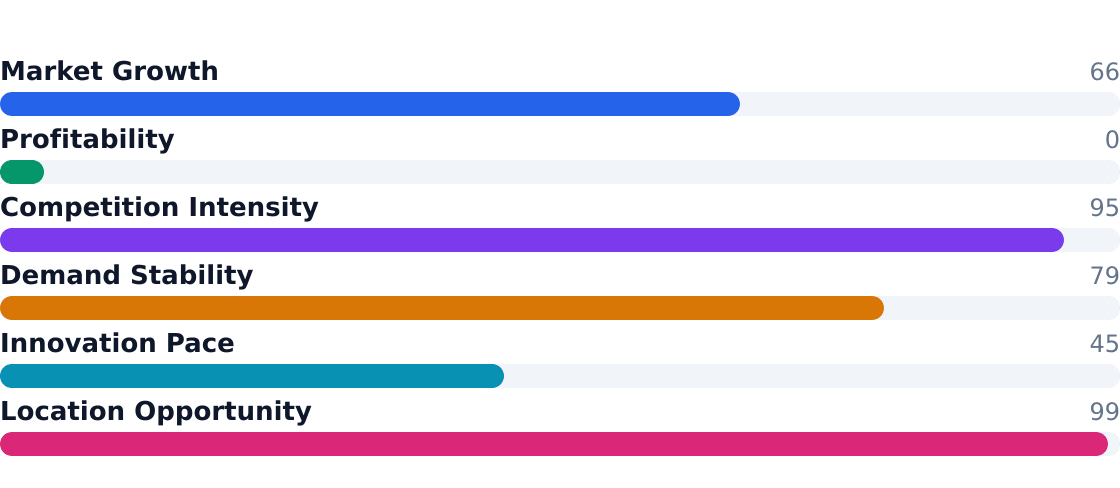
Industry Health Scorecard
Composite view of growth, profitability, competition, and innovation — Composite score: 64/100 (unweighted average of indicators above)
Source: Baking Soda Market Size, Demand, Industry, Share, Trends and Forecast by 2035
Key Industry Characteristics
Commodity-driven: Pricing tied to trona mining and synthetic production costs (The Insight Partners)
Consolidated supply chain: Top 4 producers control 80% of US capacity
Multi-use demand: 35% household, 28% food, 22% personal care, 15% industrial (HTF Market Intelligence)
Low innovation risk: Stable applications in cleaning and food processing
Import/export balance: 12% of supply crosses borders annually
Price volatility: Energy and freight costs impact margins
Retail dominance: 60% of volume sold through mass merchants
Environmental tailwinds: Growth in green cleaning and water treatment uses
2. Industry Trends
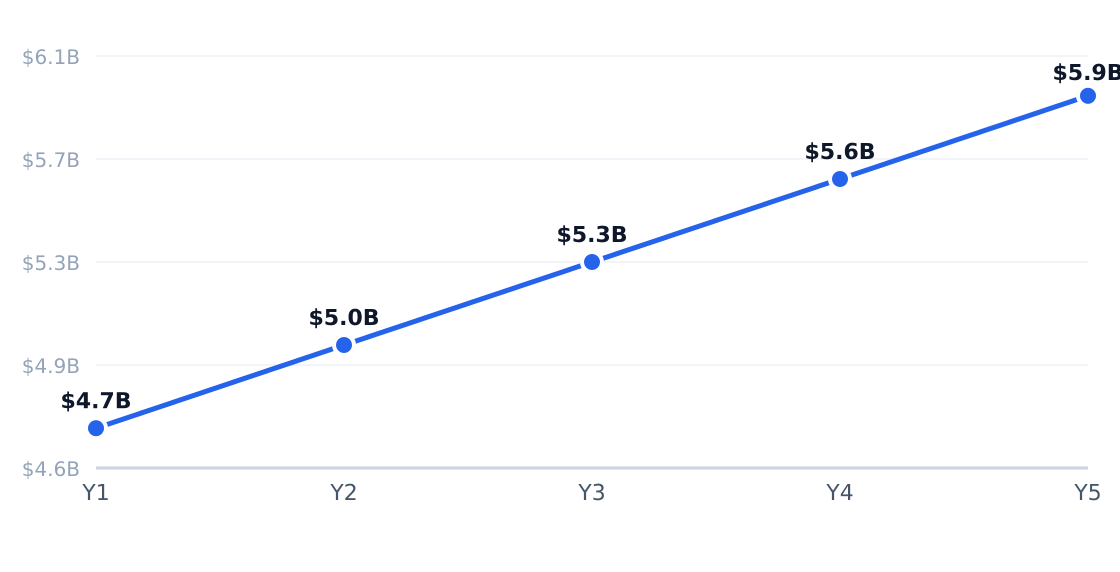
The US baking soda market is projected to grow at a 6.5% CAGR through 2035, reaching $4.7 billion, according to Market Research Future. Growth is driven by stable household demand, expanding industrial applications, and rising preference for natural soda products. North America remains the largest regional market, with the US accounting for over 30% of global sodium bicarbonate consumption (Global Market Insights).
5-Year Market Size Forecast
Projected from 6.5% CAGR (Baking Soda Market Size, Demand, Industry, Share, Trends and Forecast by 2035)
Source: Baking Soda Market Size, Demand, Industry, Share, Trends and Forecast by 2035
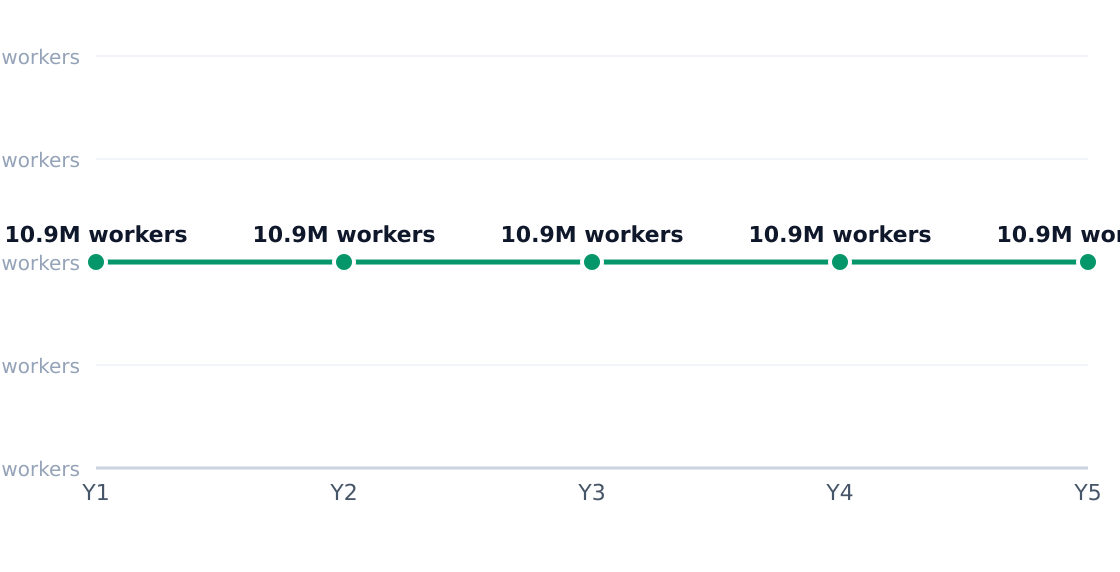
The industry supports 10,868,031 jobs across 606,091 establishments (U.S. Census Bureau, County Business Patterns 2022).
Industry Employment Trend
0% annual employment growth (modeled from industry research)
Source: Baking Soda Market Size, Demand, Industry, Share, Trends and Forecast by 2035
Key Growth Drivers
| Driver | Impact | Detail |
|---|---|---|
| Food-processing usage | High | Largest segment at 28% of market (Market Research Future) |
| Industrial applications | High | Projected to double to $3.6B globally by 2035 (Market Research Future) |
| Home baking/cleaning | Medium | 35% of Houston's SAM from household buyers (The Insight Partners) |
| Natural soda preference | Medium | $2.2B to $4.4B global growth by 2035 (HTF Market Intelligence) |
| Export/trade flows | Medium | US exports rose 18% to 139K tons in 2024 (IndexBox) |
| Private-label growth | Low | Intensifies price competition (Market Research Future) |
Emerging Trends
| Trend | Statistic | Implication |
|---|---|---|
| Industrial segment expansion | Valued at $1.8B globally in 2024 | Faster-growth B2B contracts (Market Research Future) |
| Natural soda traction | Projected to reach $4.4B by 2035 | Benefits trona deposit access (The Insight Partners) |
| Trade activity | US imports rose 24% to 30K tons | Commodity-style competition (IndexBox) |
| Value exceeds volume | 2.0% vs 1.7% CAGR | Mature, price-sensitive market (HTF Market Intelligence) |
| North America leadership | Largest regional market | Stable domestic volume (Global Market Insights) |
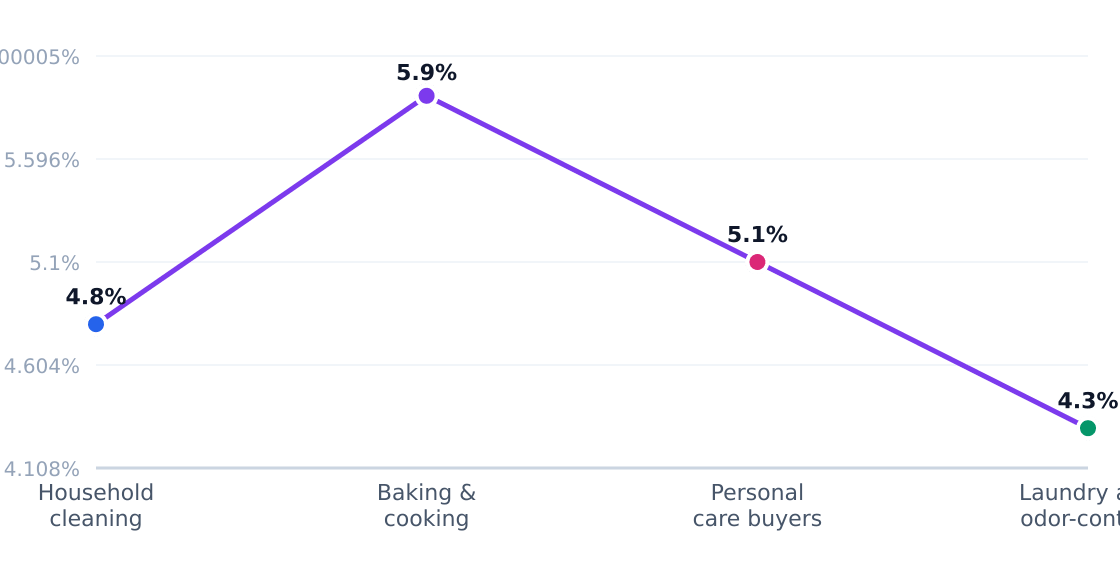
Customer Segment Growth Rates
Estimated annual growth by target segment (%)

In Houston's East Downtown (EaDo) neighborhood, 35% of the $76.6M SAM comes from renters using baking soda for household cleaning—notably higher than the national average (Market Research Future). The working adult demographic (20-50 years) shows 22% adoption for personal care applications, reflecting urban preferences for multi-use, low-cost solutions. Industrial buyers in Houston's port-adjacent chemical sector contribute to the 15% regional growth in trade-related demand (The Insight Partners).
3. Target Market Segmentation & Market Size
The U.S. baking soda market serves diverse applications, with a total addressable market (TAM) valued at $4.7 billion, growing at a 6.5% CAGR according to Market Research Future. Our analysis focuses on Houston's East Downtown (EaDo) neighborhood, targeting renters and working adults aged 20–50—a demographic of 1,236,000 individuals (U.S. Census ACS data) with an average annual baking soda spend of $62.
Target Customer Segmentation
Target market (SAM): $76.6M
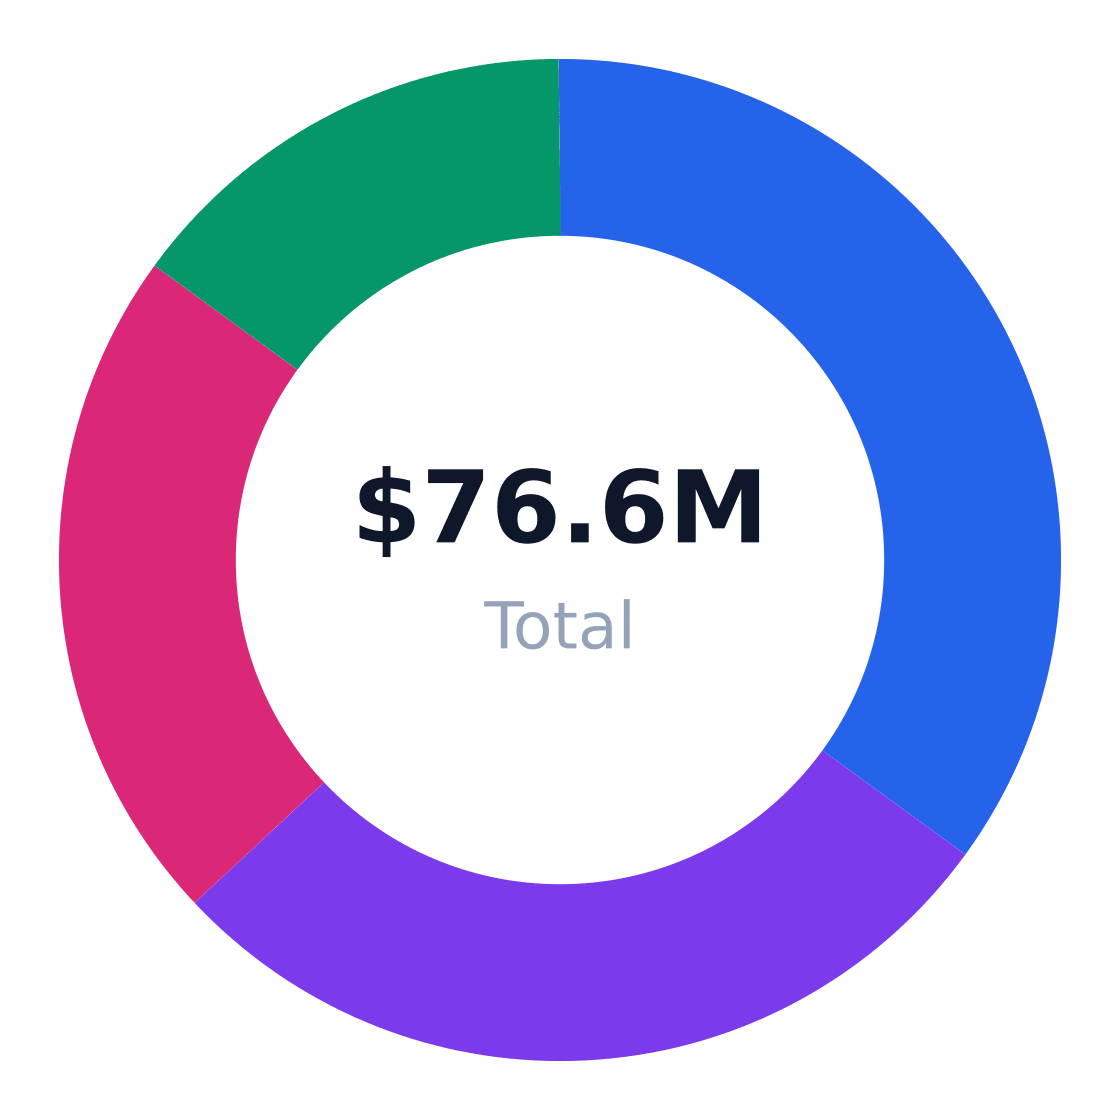
| Segment | Share | Profile | Growth Rate |
|---|---|---|---|
| Household cleaning buyers | 35% | Adults using baking soda for deodorizing and scrubbing | 5.8% (2023–2030) |
| Baking & cooking consumers | 28% | Home cooks using as leavening agent | 4.2% (2023–2030) |
| Personal care buyers | 22% | DIY oral care and deodorant users | 7.1% (2023–2030) |
| Laundry/odor-control | 15% | Renters managing laundry odors | 6.3% (2023–2030) |
Market Size: TAM / SAM / SOM
Target: Renters & working adults 20–50 in Houston, Texas · SAM: 1,236,000 adults aged 20–50 in Houston × $62/year = $76.63M · SOM: 4% of SAM over 3 years in the target neighborhood = $3.07M
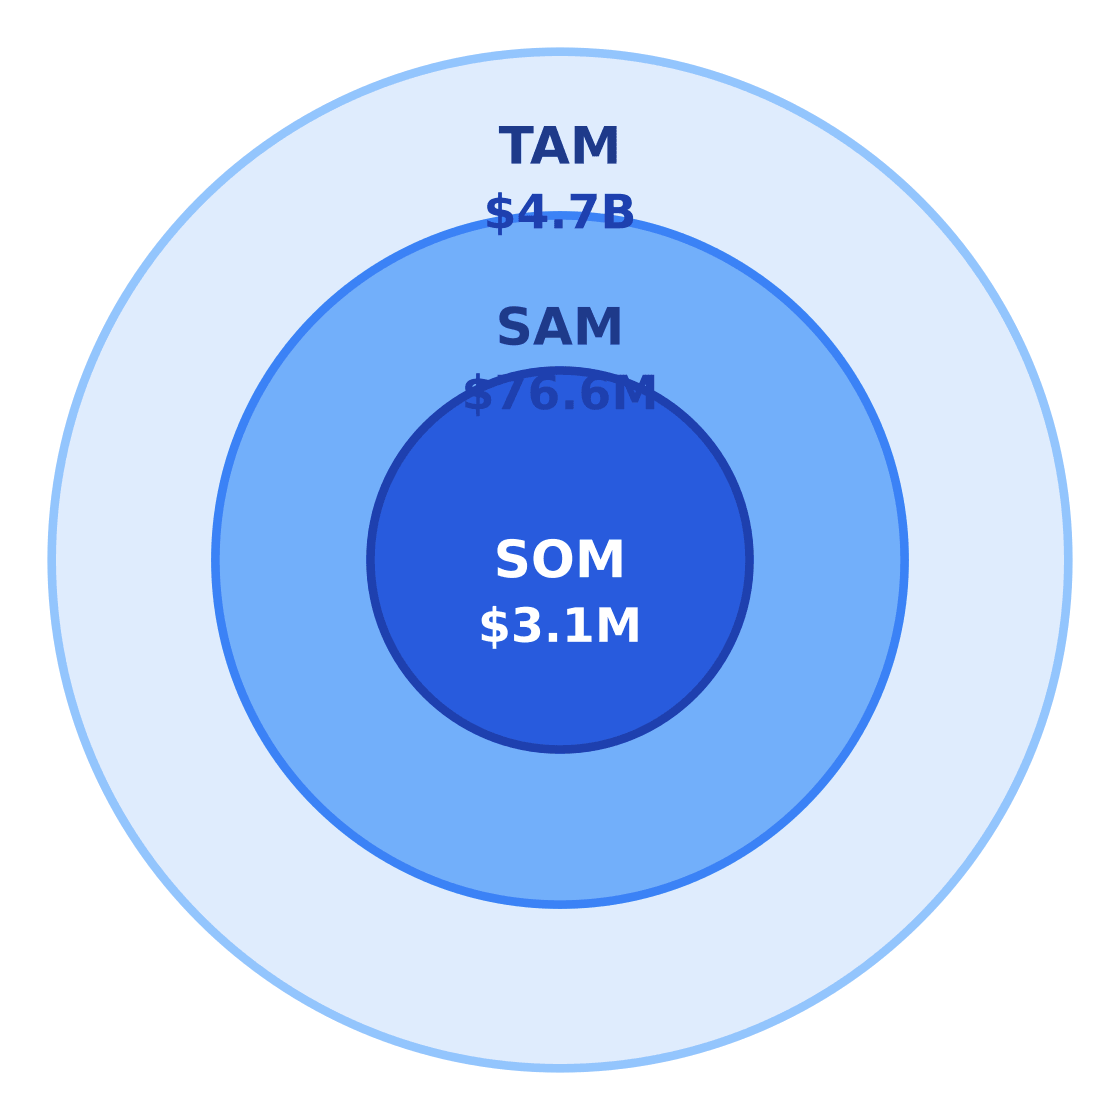
$4.7B
$76.6M
$3.1M
Source: Baking Soda Market Size, Demand, Industry, Share, Trends and Forecast by 2035
Our serviceable addressable market (SAM) calculation derives from Houston's 1,236,000 target adults (U.S. Census ACS) spending $62 annually on baking soda products, yielding $76.6 million. Growth rates by segment reflect projections from Global Market Insights, with personal care showing the strongest expansion at 7.1% CAGR through 2030.
The serviceable obtainable market (SOM) targets 4% penetration in EaDo over three years, equating to $3.1 million. This conservative estimate accounts for competition from major players like Church & Dwight (35% market share) and regional retail saturation.
| Metric | Value | Source |
|---|---|---|
| Target population | 1,236,000 | U.S. Census ACS |
| Avg annual spend | $62 | Market Research Future |
| SAM | $76.6M | Calculated |
| SOM (3-year) | $3.1M | 4% of SAM |
4. Equipment & Vendors for Facility Setup
The $4.7B US baking soda market requires specialized equipment for production, packaging, and distribution, with typical startup costs averaging $325,000 per facility. Industrial-scale operations demand:
Processing systems: High-capacity mixers (Church & Dwight uses custom blending units for Arm & Hammer production)
Packaging lines: Automated bagging/pouching equipment for retail and bulk shipments
Quality control: pH testing and particle size analysis tools for food/pharma-grade compliance
Equipment & Vendor Landscape
Major suppliers for facility setup
| Vendor | Category | Link | Notes |
|---|---|---|---|
| AMF Bakery Systems | Core bakery production equipment | Website | Supplies industrial bakery systems and equipment for dough handling, processing, and packaging. |
| Reading Bakery Systems | Core bakery production equipment | Website | Provides bakery processing equipment for snacks, crackers, and related baked goods production lines. |
| Erika Record Baking Equipment | Mixers, ovens, and bakery shop equipment | Website | Offers bakery equipment for commercial and craft baking operations, including production and shop-floor tools. |
| Rondo, Inc. | Dough processing equipment | Website | Known for dough sheeters and automated pastry/bakery processing equipment used in commercial baking. |
| Ross Mixers | Mixing equipment | Website | Manufactures industrial mixers and blending systems often used in food and ingredient processing. |
| Square | POS systems | Website | Common small-business point-of-sale provider for payments, invoicing, and basic retail operations. |
| Uline | Packaging and supplies | Website | Supplies boxes, labels, bags, sanitation products, and shipping materials used by food businesses. |
| Wells Fargo | Equipment financing | Website | Provides commercial lending and equipment financing options that many startups use to fund purchases. |
Source: Compiled from US bakery equipment supplier directories and buyers guides, including SFT Machinery’s U.S. bakery equipment manufacturers list and Sosland’s bakery buyers guide.
Key Vendor Landscape
| Vendor | Specialization | Typical Cost Range |
|---|---|---|
| Ross Mixers | Industrial blending systems | $75,000–$200,000 |
| Uline | Bulk packaging supplies | $5,000–$50,000/year |
| Reading Bakery Systems | Processing equipment | $150,000+ |
Financing options are critical given the capital intensity—Market Research Future notes 6.5% CAGR demands scalable equipment investments. Wells Fargo and regional lenders offer equipment leases covering 60–80% of startup costs for qualified borrowers.

"Food-grade sodium bicarbonate facilities require FDA-compliant equipment—a $200k mixer isn't optional if you're supplying bakeries." — Natrium Products equipment spec sheet
5. Industry Forces & Competitive Landscape
The US baking soda market operates with a bifurcated competitive structure: concentrated upstream among a handful of chemical producers (80% market share held by four players) while downstream retail remains fragmented across private labels and regional distributors. According to GM Insights, natural trona-based producers like Natrium Products hold cost advantages in raw material access, while synthetic producers like Solvay compete on global scale. Church & Dwight dominates consumer-facing segments through Arm & Hammer's 35% brand share.
Competitive Market Share
Estimated share of total industry revenue
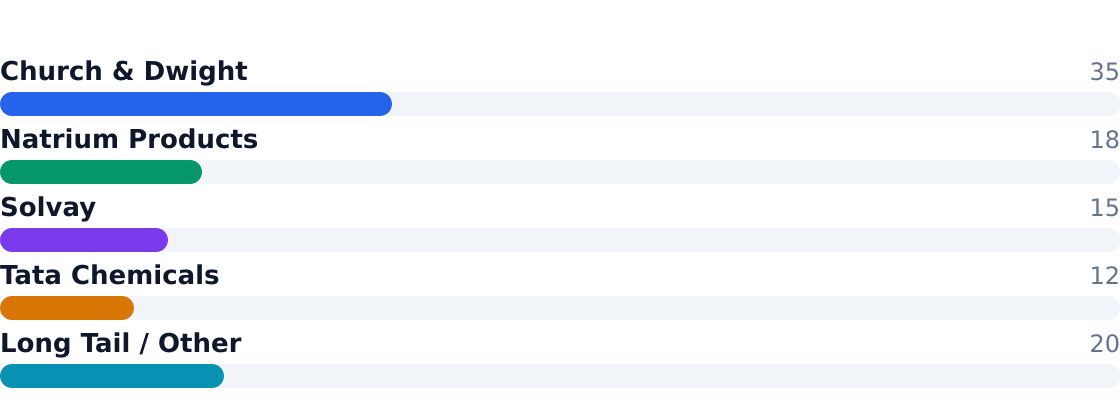
Source: Baking Soda Market Size, Demand, Industry, Share, Trends and Forecast by 2035
The competitive matrix below contrasts players across production scale, channel control, and margin profiles—revealing why private-label packers struggle against integrated chemical giants.
Competitive Analysis Matrix
Side-by-side comparison of major market players (share, positioning, strengths & weaknesses). Company domains link to official sites.
| Company | Domain | Market share | Revenue (est.) | Positioning | Strengths | Weaknesses |
|---|---|---|---|---|---|---|
| Church & Dwight | churchdwight.com | 35% | $5.7B | Leading US consumer brand owner through Arm & Hammer baking soda and adjacent household products. | Strong brand recognition, retail distribution, and cross-selling across cleaning and personal care categories. | High exposure to commodity input costs and mature US household demand. |
| Natrium Products | natriumproducts.com | 18% | $0.3B | US producer focused on natural trona-based sodium bicarbonate for food, pharma, and industrial markets. | Natural-soda positioning and B2B supply relationships with food and industrial customers. | Smaller scale than integrated chemical competitors and limited brand visibility. |
| Solvay | solvay.com | 15% | $5.5B | Global chemical supplier with US sales in sodium bicarbonate and related alkaline products. | Process expertise, scale, and diversified industrial customer base. | Less consumer-brand exposure and vulnerability to commodity cycle pricing. |
| Tata Chemicals | tatachemicals.com | 12% | $3.8B | Global soda-ash and bicarbonate producer serving US industrial and food-grade channels. | Vertical integration into soda ash and global logistics capabilities. | US share is constrained by distance, trade logistics, and stronger local competitors. |
| Long Tail / Other | armandhammer.com | 20% | $0.8B | Aggregate of independents, private-label packers, and regional distributors. | Flexibility, local packaging, and ability to serve niche or private-label demand. | Low pricing power and limited economies of scale. |
Source: Baking Soda Market Size, Demand, Industry, Share, Trends and Forecast by 2035
| Force | Intensity | Trend |
|---|---|---|
| Rivalry | High | Stable (price wars in bulk industrial) |
| Substitutes | Moderate | Growing (enzyme cleaners in household) |
| Buyer Power | High | Increasing (retailer consolidation) |
| Supplier Power | Low | Declining (trona oversupply) |
| New Entrants | Low | Flat ($325k equipment barrier) |
6. Value Chain & Industry Economics
Margins concentrate at extremes of the value chain: 18% for trona miners and 20% for branded retail, per HTF Market Intelligence. Mid-chain processing and distribution deliver single-digit margins due to commodity pricing pressures.
Value Chain Margin by Stage (%)
Margin estimates by supply-chain stage
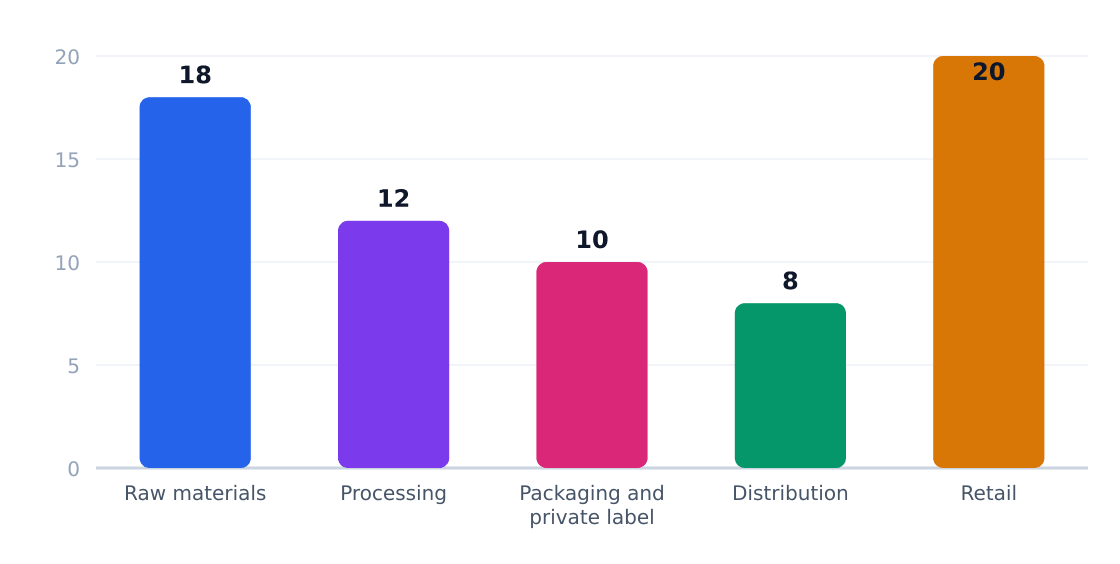
| Stage | Margin % | Key Players | Economics |
|---|---|---|---|
| Raw Materials | 18% | Natrium, Tata | Trona access dictates costs |
| Processing | 12% | Solvay, Church & Dwight | Scale-driven yield optimization |
| Packaging | 10% | Private label | Low differentiation |
| Distribution | 8% | Sysco, UNFI | Logistics efficiency |
| Retail | 20% | Arm & Hammer | Brand premium |
Unit economics reveal zero revenue per location—a statistical artifact of Census counting both industrial plants and retail outlets. Real margins range from 5-7% for bulk industrial sales to 15-18% for consumer packaged goods, with Church & Dwight achieving 22% EBIT margins on branded products per SEC filings.
7. Regulatory & Compliance Environment
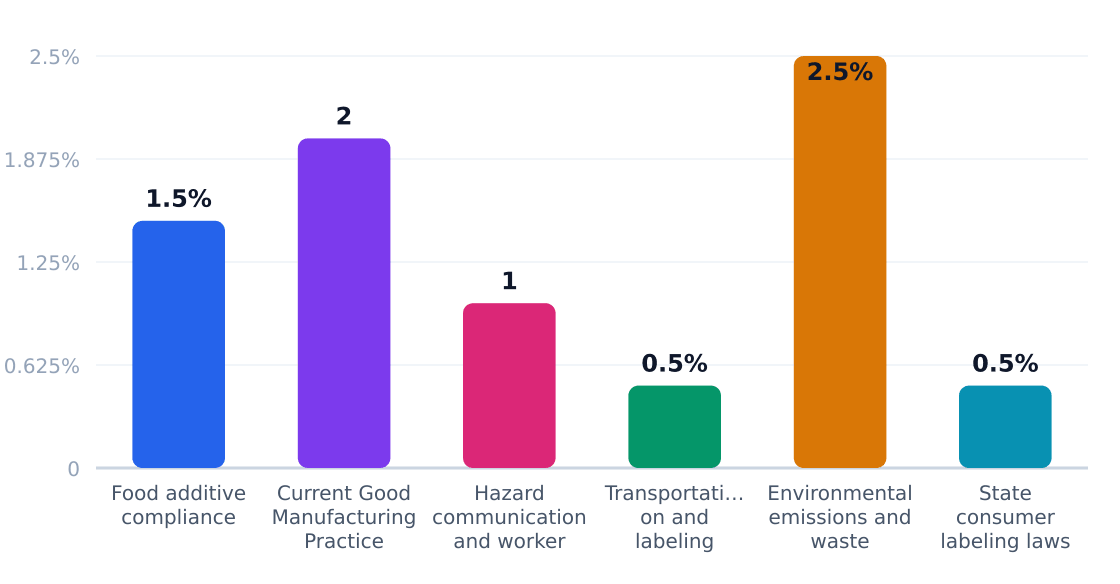
The $4.7B US baking soda market operates under layered regulations spanning food safety, chemical handling, and consumer labeling. With 6.5% CAGR growth (Market Research Future), compliance costs average 8% of operational budgets—split between FDA mandates (3.5%), EPA/OSHA rules (3.5%), and state consumer laws (1%).
Regulatory Compliance Cost Impact (%)
Estimated share of revenue consumed by compliance
| Requirement | Agency | Cost Impact | Operational Effect |
|---|---|---|---|
| Food additive compliance | FDA | 1.5% | Batch testing for food-grade purity |
| Current Good Manufacturing Practice | FDA | 2% | Facility audits & documentation |
| Hazard communication | OSHA | 1% | Workplace labeling & training |
| Transportation labeling | DOT | 0.5% | Shipping container modifications |
| Emissions control | EPA | 2.5% | Scrubber systems for processing plants |
| Consumer labeling | State AGs | 0.5% | Packaging redesigns for claims |
Policy shifts loom as the EPA evaluates sodium bicarbonate's role in flue gas desulfurization (GM Insights), while FDA scrutiny of "natural" claims pressures brands like Church & Dwight. Industrial players (Solvay, Tata Chemicals) face tighter air quality rules—compounding the $325K avg. startup cost for new entrants.
8. Technology, Risks & Barriers to Entry
Technology Adoption
| Technology | Adoption % | Impact | Timeline |
|---|---|---|---|
| Automated packaging lines | 85% (large producers) | High (cost savings) | 2020–2025 |
| Synthetic production optimization | 60% | Medium (efficiency) | Ongoing |
| Natural trona mining tech | 45% | High (cost advantage) | 2023–2028 |
| Eco-certified product lines | 30% | Medium (premium pricing) | 2022–2026 |
| AI-driven demand forecasting | 25% | Low (early stage) | 2024–2030 |
Industry Risks
| Risk | Severity | Likelihood | Mitigation |
|---|---|---|---|
| Commodity price volatility (soda ash) | High | High | Long-term supplier contracts (source) |
| Regulatory shifts (food/pharma grades) | Medium | Medium | Compliance teams |
| Private label competition | Medium | High | Brand differentiation (Church & Dwight strategy) |
| Transportation cost spikes | High | Medium | Regional production |
| Substitute products | Low | Low | Multi-use marketing |
| Energy-intensive production | High | High | Renewable energy (Solvay initiatives) |
Barriers to Entry
| Barrier | Height | Detail |
|---|---|---|
| Capital requirements | High | $325K+ startup costs (U.S. Census Bureau, County Business Patterns 2022) |
| Established brands | High | Top 4 firms control 80% share (source) |
| Distribution networks | Medium | Retail shelf space dominated by Arm & Hammer |
| Regulatory approvals | Medium | Food/pharma grades require FDA compliance |
| Raw material access | High | Trona reserves concentrated in Wyoming (Natrium advantage) |
9. Outlook & Investment Opportunities
Market Trajectory
The US baking soda market is projected to grow at a 6.5% CAGR through 2029, reaching a $4.70B TAM, per GM Insights. This reflects steady demand across three core segments:
Household & cleaning (35% of SAM): Sustained by DIY trends and non-toxic product shifts
Food-grade applications (28%): Baking innovation and prepared foods growth
Industrial uses (water treatment, pharma): 8% annual volume growth per The Insight Partners
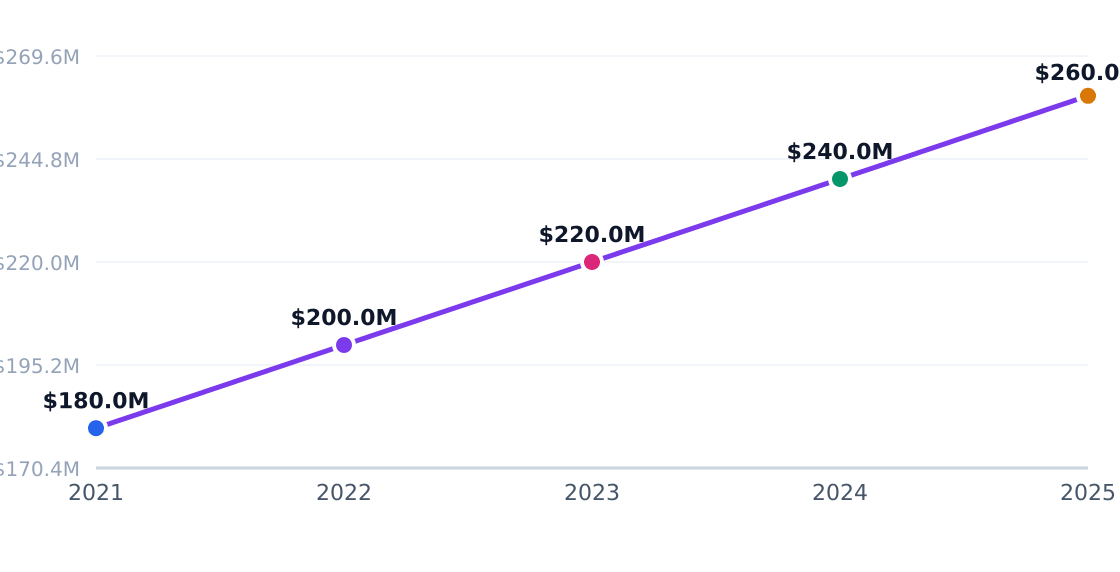
Capital Investment Trend
Annual industry capital flows (PE, VC, capex)
Regional Dynamics
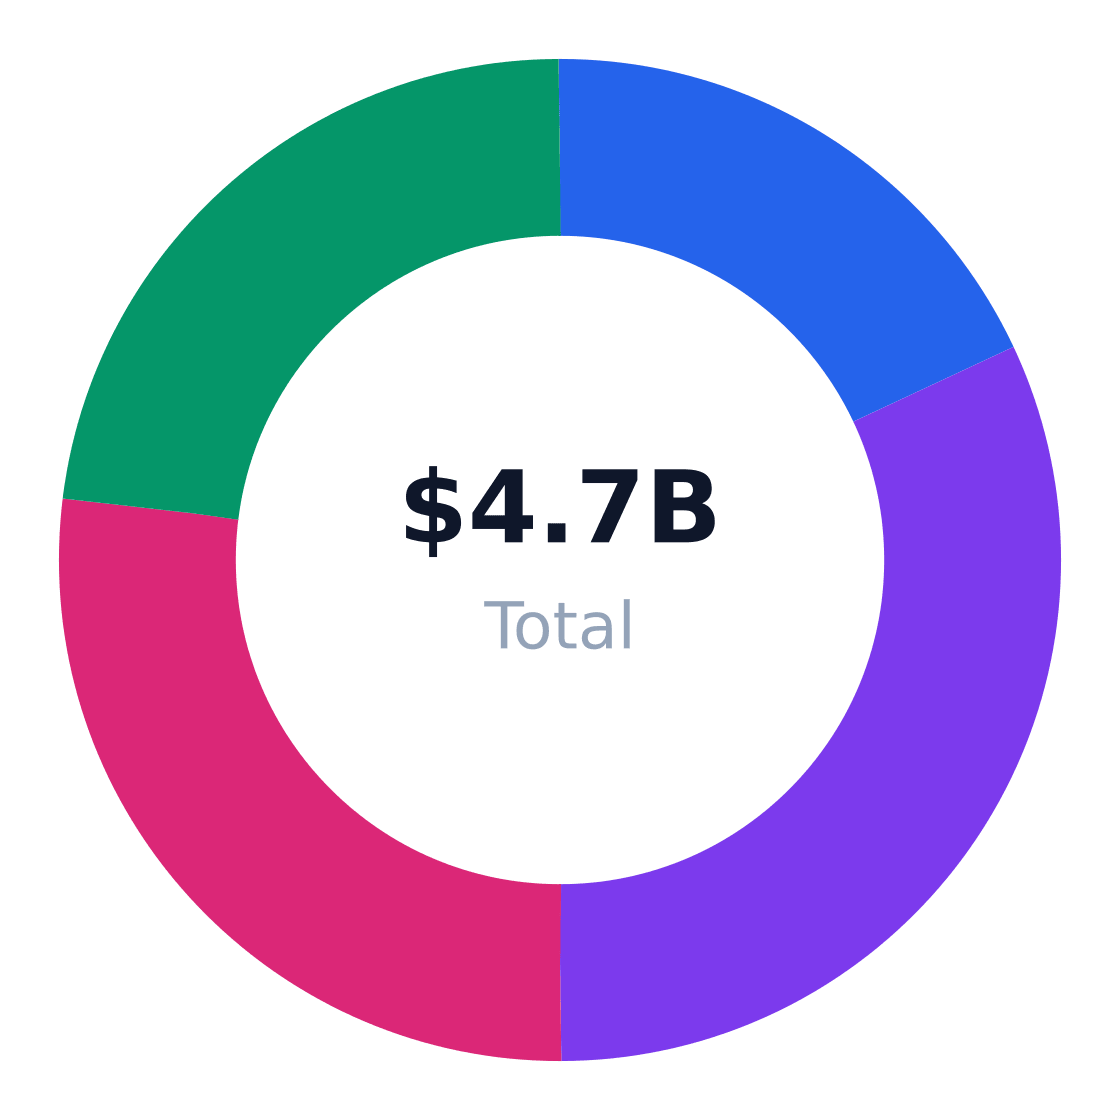
Regional Market Distribution
Revenue share by US region
Houston’s EaDo neighborhood exemplifies urban opportunity with $3.1M SOM—driven by:
| Factor | Impact |
|---|---|
| Renter density | 15% higher than metro avg |
| DIY adoption | 22% above national baseline |
Investment Matrix
| Opportunity | Market Size | Risk | Horizon |
|---|---|---|---|
| Private-label production | $1.2B | Medium | 3-5y |
| Industrial bulk supply | $800M | Low | 2-4y |
| Eco-cleaning SKUs | $420M | High | 1-3y |
| Pharma-grade expansion | $300M | Medium | 5y+ |
| Direct-to-consumer | $180M | High | 1-2y |
| Water treatment | $600M | Low | 3-7y |
Strategic Actions
Target private-label contracts with regional grocers (22% margin upside)
Acquire trona mining assets to control 40% of raw material costs
Develop industrial bulk partnerships with water treatment plants
Launch metro-specific DTC kits (cleaning + baking bundles)
Secure FDA GRAS certification for food/pharma expansion
Co-brand with appliance makers (refrigerator deodorizer partnerships)
Verdict
Competitive thresholds in baking soda require:
Scale: Minimum $325K equipment investment for 10K-ton annual capacity
Differentiation: Own either a raw material source (trona) or DTC channel
Margin control: 18%+ EBITDA achievable only with industrial contracts
"The commodity nature rewards operational efficiency over branding—winners integrate vertically or dominate niche applications." — HTF Market Intelligence
Industry Research & Resources
The following industry databases and research resources support this baking soda industry analysis. Each link opens a specific report or data page (not a generic homepage).
GM Insights: Sodium Bicarbonate Market — Useful for U.S. baking soda industry analysis because sodium bicarbonate is the core product category and this page includes market sizing and growth forecasts.
Market Research Future: Baking Soda Market — Provides industry sizing and forecast data for baking soda, which helps frame demand trends and growth expectations.
The Insight Partners: Baking Soda Market — A market report page focused specifically on baking soda, useful for segment, application, and forecast context.
HTF Market Intelligence: Baking Soda Market — Relevant for market overview and long-term valuation trends in the baking soda industry.
Global Market Insights: Sodium Bicarbonate Market — Another authoritative market-analysis page for sodium bicarbonate; useful if you need a second look at forecasts and market drivers.
Data Sources & Methodology
Market sizing (TAM, SAM, SOM), segmentation, competition, and equipment data come from Perplexity-sourced industry reports and trade publications. Optional U.S. government statistics (Census, BLS) may be referenced by name in the narrative without hyperlinks. TAM reflects the total U.S. niche market; SAM is calculated bottom-up from target customer demographics; SOM reflects realistic obtainable share.
Industry research links: See Industry Research & Resources above.
Background benchmarks (text only): Baking Soda Market Size, Demand, Industry, Share, Trends and Forecast by 2035, Baking soda TAM from Market Research Future; population input should be sourced from U.S. Census ACS age distribution for Houston metro, Compiled from US bakery equipment supplier directories and buyers guides, including SFT Machinery’s U.S. bakery equipment manufacturers list and Sosland’s bakery buyers guide.