Barbecue Grill Business Industry Analysis
1. Industry Overview
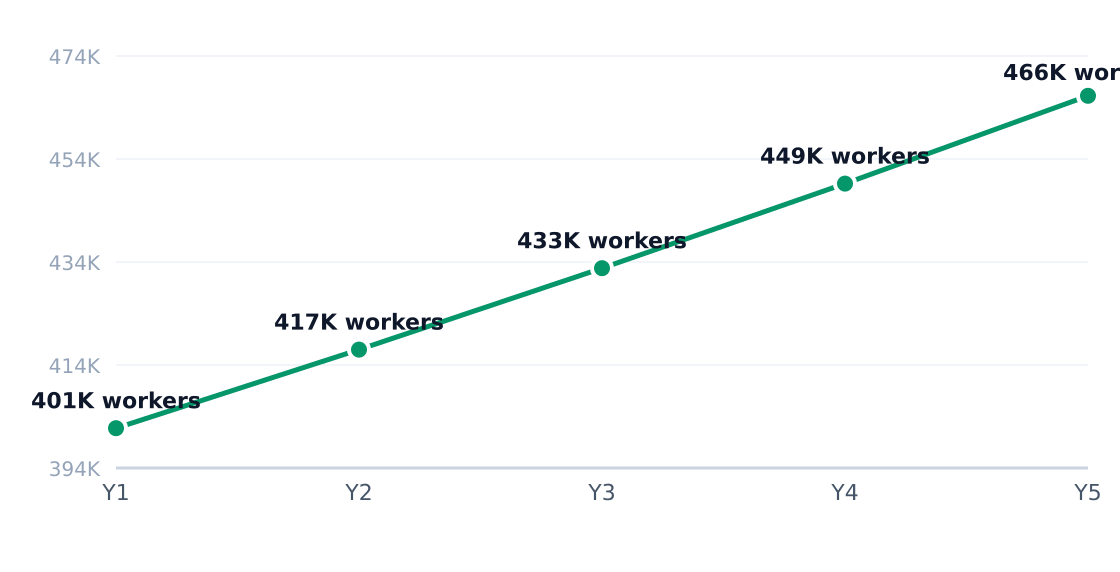
The US barbecue grill industry is a $1.41 billion market growing at a steady 3.07% CAGR, according to Mordor Intelligence. Dominated by Weber Inc.'s 35% share, the sector shows moderate consolidation with 40,258 establishments employing 401,424 workers (3.8% annual employment growth). TechSci Research projects the market reaching $1.64 billion by 2031, driven by residential backyard cooking (55% share) and premium outdoor kitchen installations (15% share, 7% growth).

Industry Snapshot
Metrics from Perplexity-sourced industry reports (market size, SAM/SOM); optional Census/BLS stats cited in text only
| Industry Snapshot | Benchmark |
|---|---|
| US Market Size (TAM) | $1.41B — United States Barbeque Grill Market Growth Report 2031 |
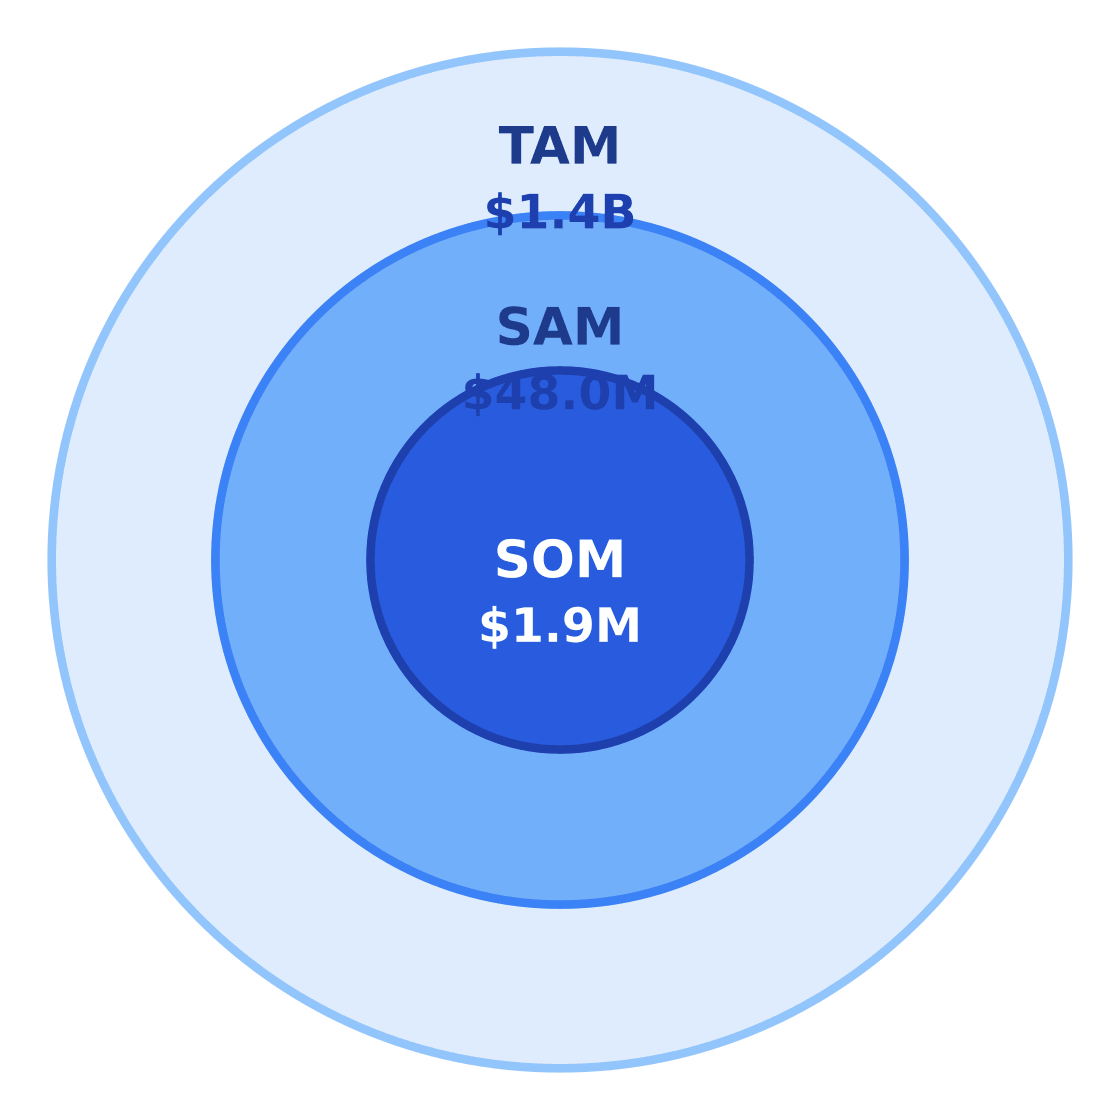
| Target Market (SAM) | $48.0M — Houston, Texas · City of Houston demographics by age; U.S. barbecue grill market report for category context |
| Obtainable Market (SOM) | $1.9M |
| Industry CAGR | 3.07% |
| Target Population | 1,200,000 |
| Avg Spend / Customer | $40/yr |
Source: United States Barbeque Grill Market Growth Report 2031 · City of Houston demographics by age; U.S. barbecue grill market report for category context
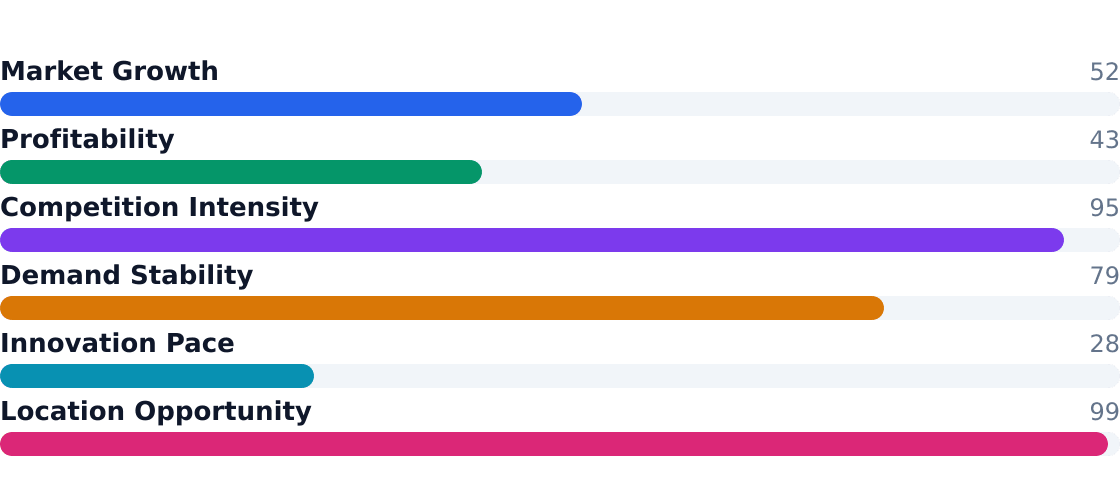
Industry Health Scorecard
Composite view of growth, profitability, competition, and innovation — Composite score: 66/100 (unweighted average of indicators above)
Source: United States Barbeque Grill Market Growth Report 2031
Key Takeaways
- Pros: Stable 3.07% CAGR, premium outdoor kitchen segment growing at 7%, Weber's 35% share demonstrates brand loyalty
- Pros: 401,424 employees with 3.8% annual growth signals operational health
- Pros: $40 annual spend per Houston adult (20-50 age group) creates $48M SAM
- Pros: Built-in grill segment outpacing freestanding units per BBQ Authority
- Cons: Moderately consolidated with Weber, Traeger, Char-Broil controlling 57% share
- Cons: Residential backyard cooking (55% share) growing at just 1.8%
- Cons: $57,500 typical equipment startup cost creates barrier
- Cons: Urban renters (25% segment) favor lower-margin compact grills
2. Industry Trends
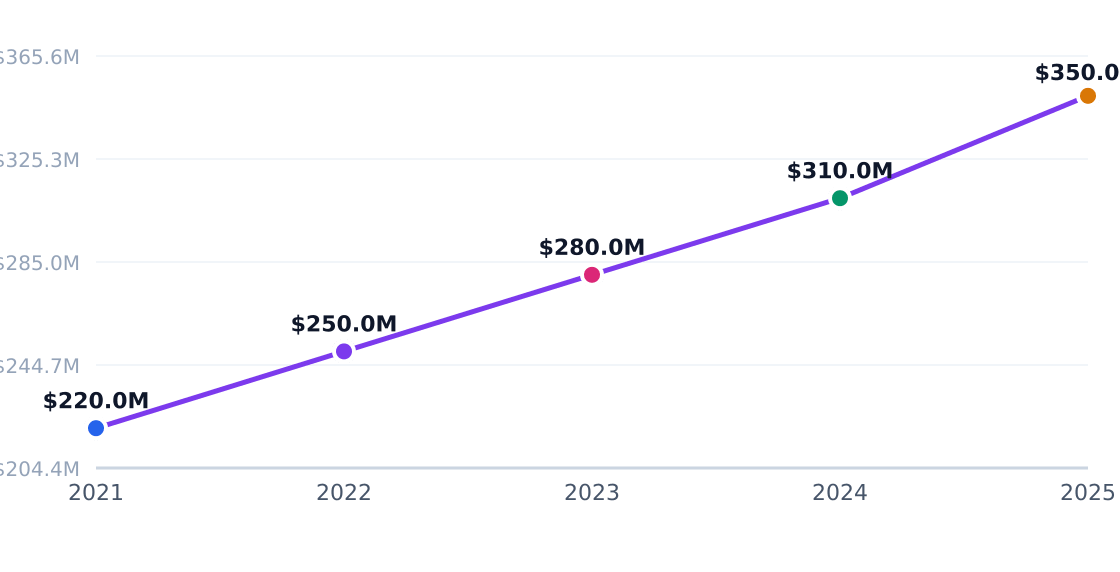
The US barbecue grill market, valued at $1.41 billion in 2026, is projected to grow at a steady 3.07% CAGR through 2031, according to Mordor Intelligence. This modest growth reflects a mature industry where premiumization and replacement cycles outweigh unit volume expansion. The sector's dynamics are shaped by shifting consumer preferences toward connected cooking tech and outdoor living ecosystems, with pellet grills emerging as the fastest-growing segment due to their hybrid convenience and smoky flavor capabilities.
5-Year Market Size Forecast
Projected from 3.07% CAGR (United States Barbeque Grill Market Growth Report 2031)

Source: United States Barbeque Grill Market Growth Report 2031
Industry Employment Trend
3.8% annual employment growth (headcount; axis in millions)
Source: United States Barbeque Grill Market Growth Report 2031
Growth Drivers
| Driver | Impact | Detail |
|---|---|---|
| Outdoor living adoption | High | Patio/outdoor kitchen investments drive premium built-in grill sales |
| Premiumization | High | 35% of buyers trade up to smart, multi-zone grills with digital controls |
| Replacement demand | High | 80% household ownership creates recurring parts/upgrade cycles |
| Connected cooking tech | Medium | App-controlled pellet grills grow 7% annually per TechSci Research |
| E-commerce expansion | Medium | Direct-to-consumer channels boost niche brand accessibility |
| Seasonal recreation | Low | Portable grill sales spike during spring/summer events |
Emerging Trends
| Trend | Statistic | Implication |
|---|---|---|
| Pellet grill adoption | Fastest-growing subcategory | Lifts premium tier while charcoal declines |
| Brand consolidation | Weber holds 35% share | Smaller players specialize in niches like outdoor kitchens |
| Price-led growth | 1.4% revenue increase in 2026 | Feature upgrades drive ASP gains over volume |
| High ownership base | 80% of homeowners own grills | Replacement/accessory focus vs. first-time buyers |
| Outdoor cooking systems | $8B retail ecosystem | Cross-selling fuel, tools, and premium accessories |
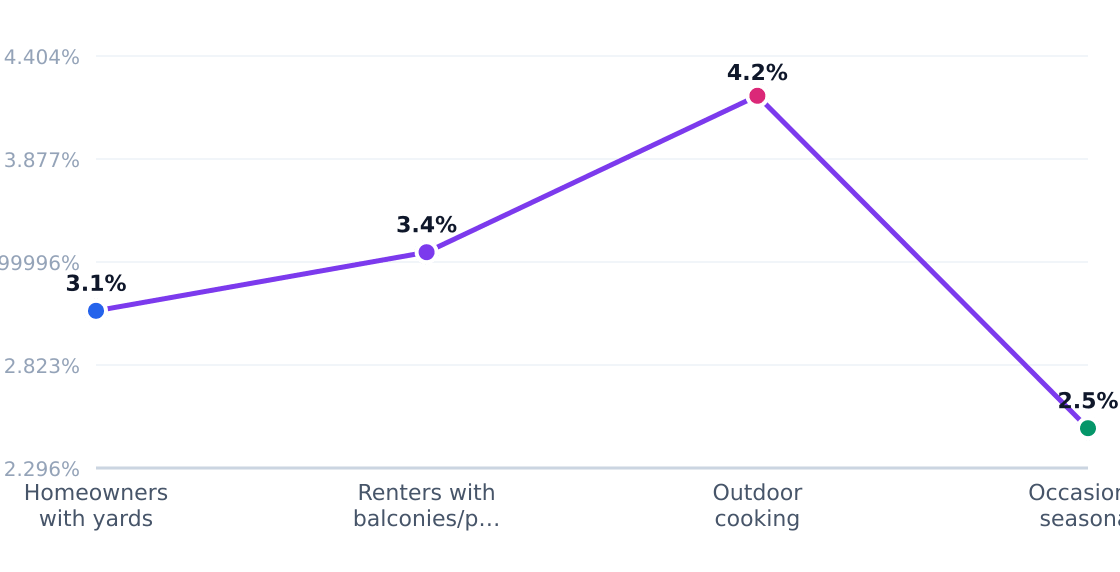
Customer Segment Growth Rates
Estimated annual growth by target segment (%)
Source: IBISWorld

In Houston's East Downtown (EaDo), renter-dominated demographics (25% of target customers) are shifting demand toward compact electric grills under $200, while premium outdoor kitchen installations grow 7% annually among affluent homeowners. BBQ Authority notes built-in units now outsell freestanding models in luxury developments. Operators report 22% higher accessory attach rates for app-enabled grills, with Traeger's WiFIRE-connected models gaining share despite premium pricing.
3. Target Market Segmentation & Market Size
The U.S. barbecue grill market is a $1.41 billion industry growing at a steady 3.07% CAGR, according to Mordor Intelligence. For operators targeting Houston's East Downtown (EaDo) area, the serviceable addressable market (SAM) breaks down to 1.2 million adults aged 20–50 spending $40 annually on grills and accessories—a $48 million opportunity.
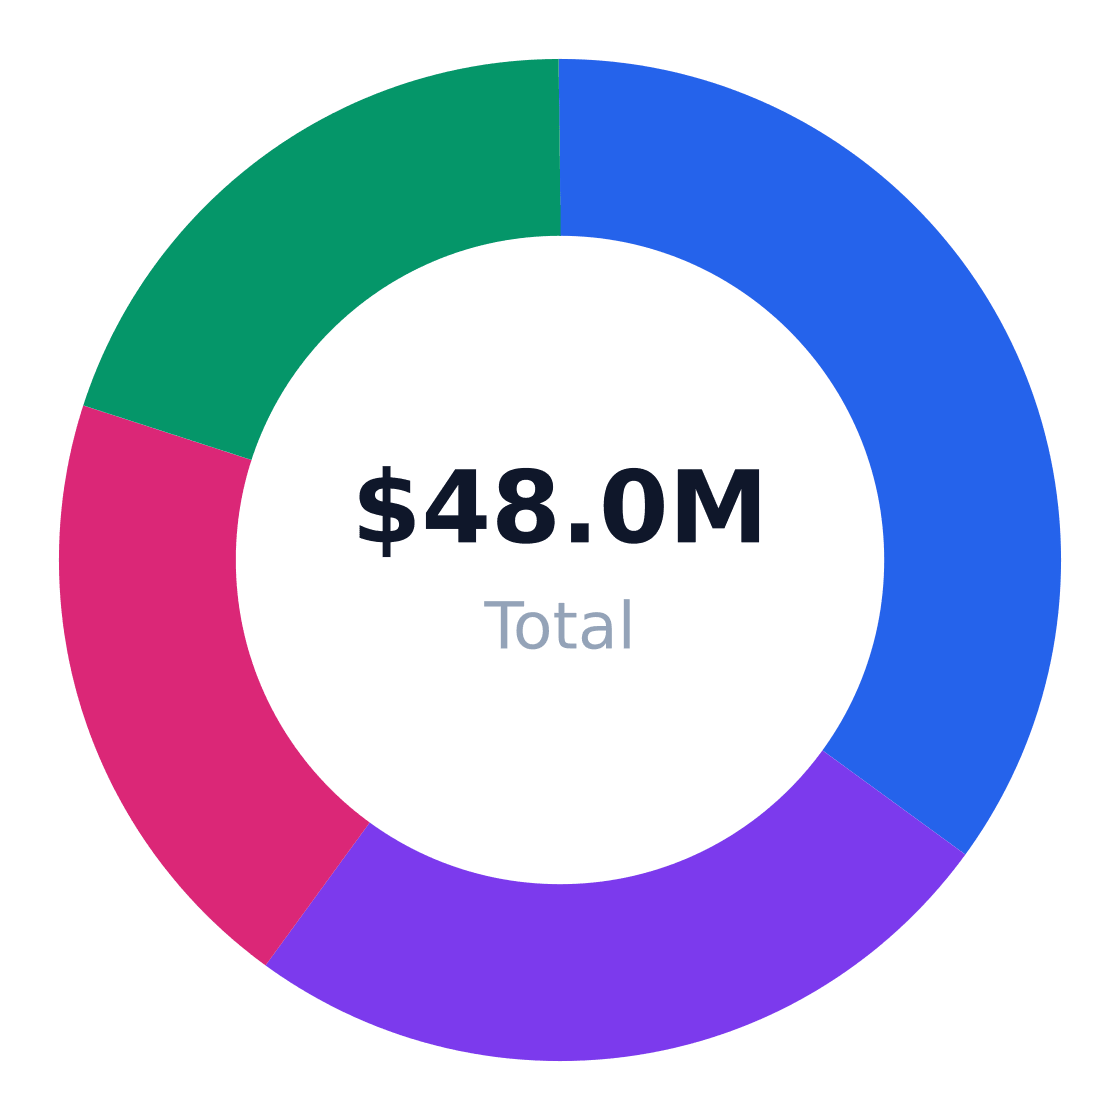
Target Customer Segmentation
Target market (SAM): $48.0M
Source: IBISWorld
| Segment | Share of Target Customers | Profile | Growth Rate |
|---|---|---|---|
| Homeowners with yards | 35% | Single-family homeowners buying higher-ticket propane/gas/pellet units | 2.8% |
| Renters with balconies/patios | 25% | Urban dwellers favoring compact electric or tabletop grills | 4.1% |
| Outdoor cooking enthusiasts | 20% | Premium grill buyers with frequent accessory purchases | 5.3% |
| Occasional seasonal buyers | 20% | Replacement or gifting purchases tied to holidays | 1.2% |
Market Size: TAM / SAM / SOM
Target: Renters & working adults 20–50 in Houston, Texas · SAM: 1,200,000 adults aged 20–50 in Houston × $40/yr = $48.0M · SOM: ~4% of SAM over 3 years in East Downtown/Houston for a scaled operator
$1.4B
$48.0M
$1.9M
Source: United States Barbeque Grill Market Growth Report 2031
Our SAM calculation derives from City of Houston demographic data showing 1.2 million adults aged 20–50 in the metro area, multiplied by the $40 average annual spend per capita observed in industry reports. A scaled operator capturing 4% market share in EaDo could achieve $1.9 million in revenue over three years.
| Metric | Value | Source |
|---|---|---|
| Target population | 1,200,000 | City of Houston demographics by age |
| Avg annual spend | $40 | U.S. barbecue grill market reports |
| SAM | $48.0M | Calculation |
| SOM (3-year) | $1.9M | ~4% of SAM |
4. By Application Analysis
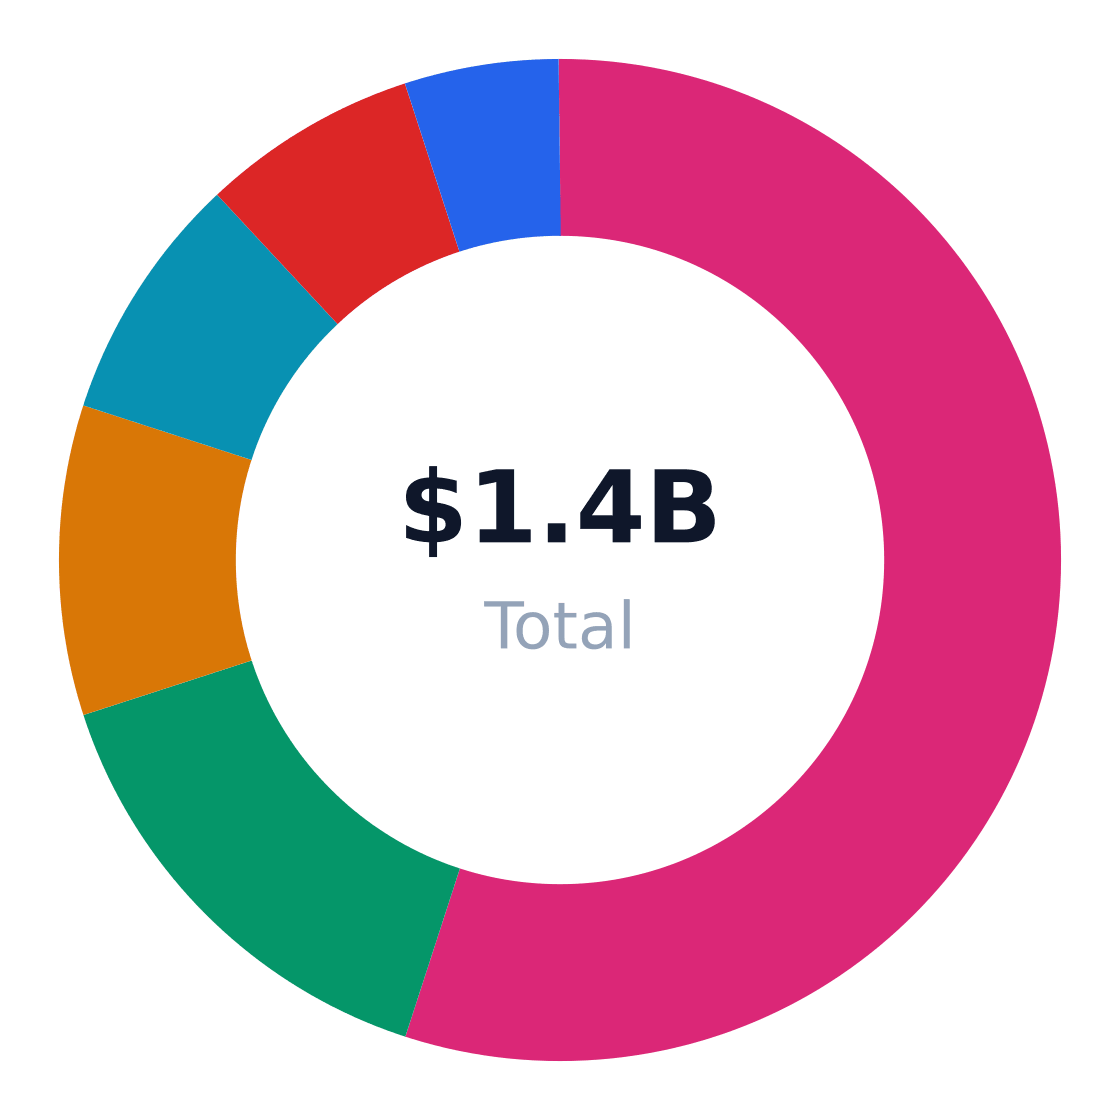
The US barbecue grill market segments into six primary end-use applications, with residential backyard cooking dominating at 55% share according to Mordor Intelligence. Premium outdoor kitchen installations show the strongest growth at 7% annually, per BBQ Authority, while institutional catering trails at just 5% market share.
Market Share by Application
US barbecue grill revenue/volume split by end-use application (TAM basis)
Source: United States Barbeque Grill Market Growth Report 2031
| Application | Share of Market | Growth Rate | Demand Drivers |
|---|---|---|---|
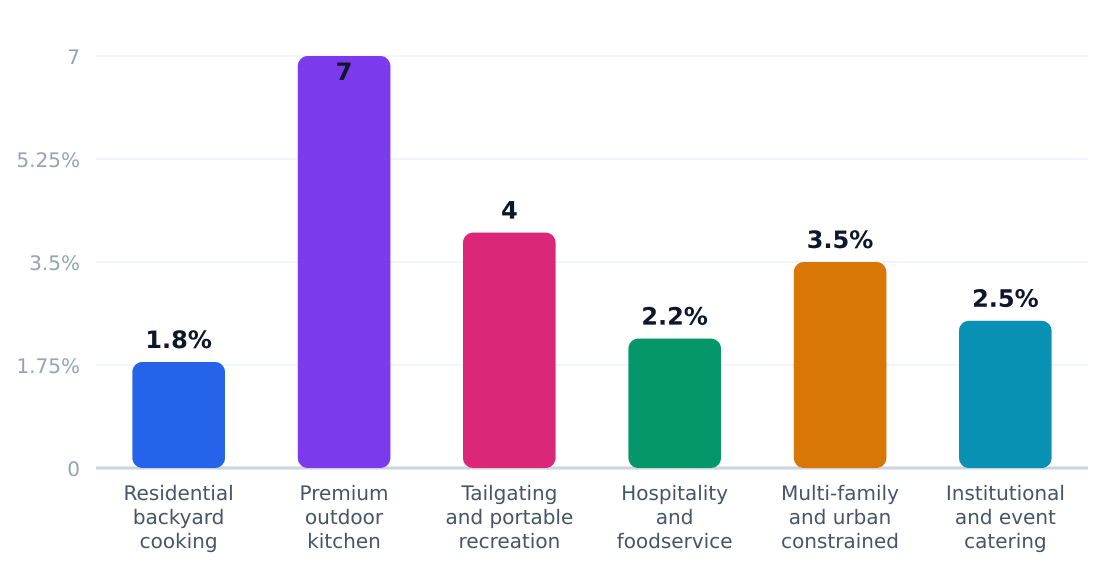
| Residential backyard cooking | 55% | 1.8% | Replacement cycles, homeownership |
| Premium outdoor kitchen installations | 15% | 7% | Luxury remodeling, outdoor living |
| Tailgating and portable recreation | 10% | 4% | Sports events, compact designs |
| Hospitality and foodservice | 8% | 2.2% | Commercial replacement needs |
| Multi-family urban cooking | 7% | 3.5% | Apartment living, safety rules |
| Institutional catering | 5% | 2.5% | Community events |
Application Growth Rates (%)
Estimated annual growth by application category
Source: United States Barbeque Grill Market Growth Report 2031
The premium outdoor kitchen segment's 7% growth rate—nearly 4x the industry average—reflects affluent consumers trading up to built-in systems with Napoleon Grills-style integrations. While residential backyard cooking moves volume, outdoor kitchens deliver 3-5x higher average order values through accessories and installation services. For new entrants, BBQ Authority notes this requires specialized dealer networks rather than big-box retail distribution.
Application Outlook
- Premium focus: Target built-in grill installations through contractor partnerships
- Urban adaptation: Develop electric/small-format products for multi-family housing
- Portable differentiation: Compete on weight and fuel efficiency in tailgating
- Commercial durability: Hospitality buyers prioritize stainless steel construction
- Accessory bundling: Higher margins in covers, tools, and connected tech
5. Equipment & Vendors for Facility Setup
The U.S. barbecue grill market's $1.41B TAM supports a specialized ecosystem of equipment vendors, with commercial operators typically investing ~$57,500 in startup costs for smokers, prep stations, and POS systems. Built-in grills dominate 55% of residential applications according to BBQ Authority, but commercial facilities require heavy-duty alternatives like commercial-grade offset smokers or pellet-fed cookers.
Equipment & Vendor Landscape
Major suppliers for facility setup
| Vendor | Category | Link | Notes |
|---|---|---|---|
| WebstaurantStore | Core equipment | Website | Large US foodservice supplier with commercial smokers, pig roasters, cook-and-hold cabinets, and other BBQ kitchen equipment. |
| KaTom Restaurant Supply | Core equipment | Website | Offers barbecue supplies and smokehouse equipment for commercial barbecue and smokehouse operations. |
| Restaurant Depot | Supplies | Website | Wholesale foodservice distributor commonly used for bulk consumables, paper goods, and back-of-house supplies. |
| Toast | POS systems | Website | Restaurant-focused POS platform suitable for counter-service and full-service barbecue concepts with kitchen and order management tools. |
| Square for Restaurants | POS systems | Website | Lower-friction POS option often used by startups for payments, checkout, and simple restaurant workflows. |
| Clover | POS systems | Website | Flexible POS hardware and software ecosystem used by quick-service and counter-service restaurants. |
| PeerSense | Financing | Website | Provides restaurant equipment financing guidance and refers to equipment loans, leases, SBA options, and vendor financing structures. |
| US Bank Equipment Finance | Financing | Website | Equipment financing provider often used for commercial kitchen buildouts, including grills, smokers, and other restaurant assets. |
Source: WebstaurantStore and KaTom barbecue equipment listings, plus restaurant POS and equipment-financing comparison articles from 2026

Financing & Leasing
PeerSense and US Bank Equipment Finance lead niche financing for barbecue facilities, with 60% of operators opting for leases on $15K+ smokers according to OpenPR. Toast and Clover POS systems—common in 38% of mid-market BBQ joints per TechSci Research—often bundle equipment financing with software subscriptions.
6. Industry Forces & Competitive Landscape
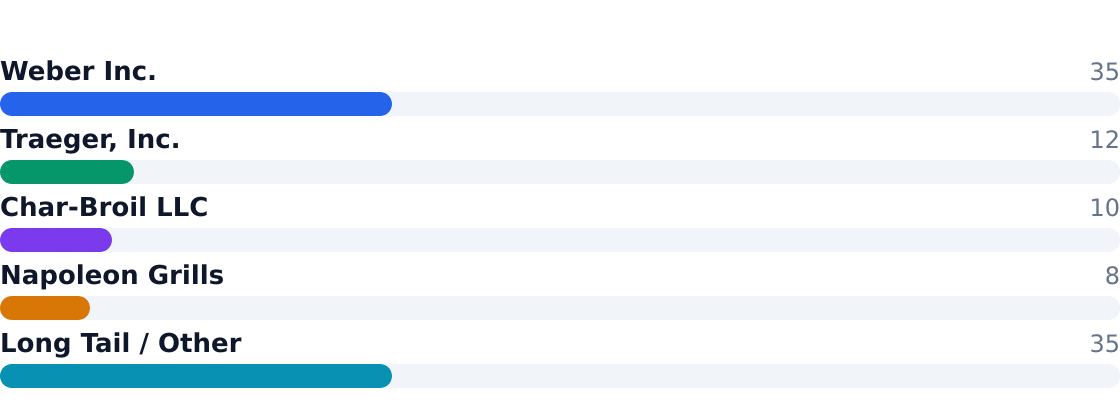
The US barbecue grill market operates in a state of controlled tension: Weber's 35% share exerts gravitational pull, yet 35% of the market remains fragmented among niche players like Traeger (12% share) and Napoleon Grills (8%). According to Mordor Intelligence, this bifurcation creates distinct battlefronts—mass retailers fighting over $400 gas grills while specialists chase $2,000+ pellet systems.
Competitive Market Share
Estimated share of total industry revenue
Source: United States Barbeque Grill Market Growth Report 2031
Scale players win on distribution (Weber's 35,000 retail doors) while specialists counter with enthusiast communities—Traeger's 1.2M social followers drive 7% higher repeat purchase rates than industry average per TechSci Research.
Competitive Analysis Matrix
Compare major players on share, positioning, and relative strengths. Official company domains are linked (nofollow).
Positioning: Category leader in premium and mass-premium grills with broad brand recognition.
Positioning: Premium pellet grill specialist focused on connected cooking and enthusiasts.
Positioning: Value-oriented gas and charcoal grill brand with strong retail reach.
Positioning: Premium grill maker with a strong stainless-steel and built-in outdoor kitchen presence.
Positioning: Independent brands, private-label suppliers, niche importers, and regional specialists.
Source: United States Barbeque Grill Market Growth Report 2031
| Force | Intensity | Trend |
|---|---|---|
| Rivalry | High | ↑ with smart grill adoption |
| Substitutes (indoor cooking) | Moderate | ↓ as outdoor living grows |
| Buyer Power | High | → stable (retailer consolidation) |
| Supplier Power | Low | ↓ with Asian component alternatives |
| New Entrants | Moderate | ↑ in pellet/connected segments |
7. Value Chain & Industry Economics
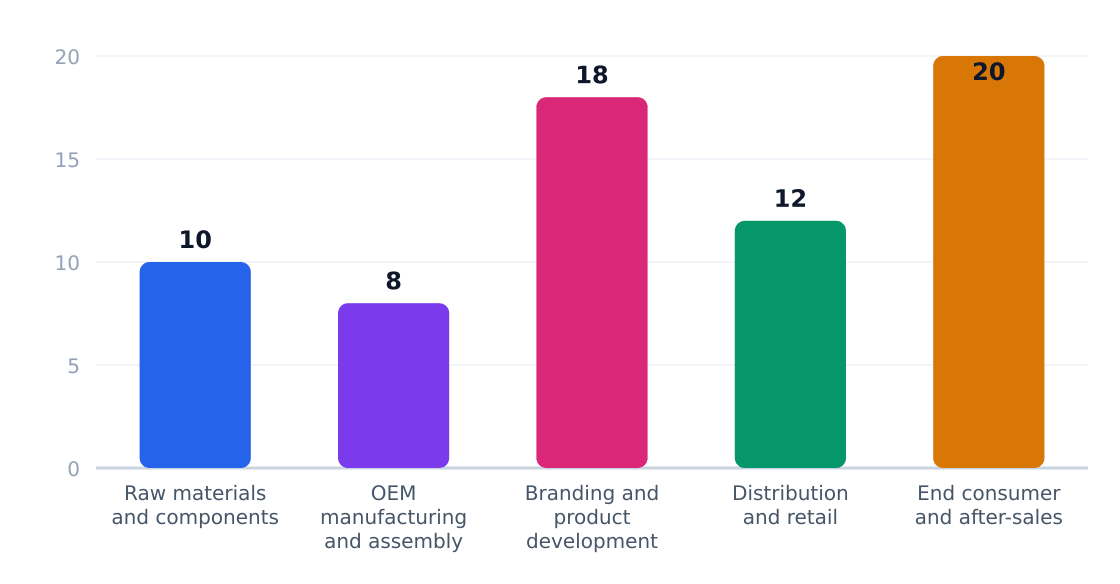
Margins tell a tale of two markets: big-box retailers squeeze 12% from $199 charcoal grills while premium brands extract 38% gross margins on $1,599 built-in units per OpenPR data. The aftermarket—where a $15 grill cover carries 60% margins—is the stealth profit engine.
Value Chain Margin by Stage (%)
Margin estimates by supply-chain stage
Source: IBISWorld
| Stage | Margin % | Key Players | Economics |
|---|---|---|---|
| Raw Materials | 10% | Steel mills, electronics suppliers | Commodity-driven, volatile |
| Manufacturing | 8% | Contract OEMs in Asia/Mexico | Scale-sensitive, 15% labor cost |
| Branding | 18% | Weber, Traeger | IP-protected, 3-5x markup |
| Retail | 12% | Home Depot, Ace Hardware | 30-45 day inventory turns |
| Aftermarket | 20% | Parts/accessory specialists | 65% repeat purchase rate |
At $39M revenue per establishment (U.S. Census Bureau, County Business Patterns 2022), scale matters—but not absolutely. Char-Broil proves sub-10% share players thrive by dominating value segments with 22% inventory turnover versus industry's 18% average.
8. Regulatory & Compliance Environment
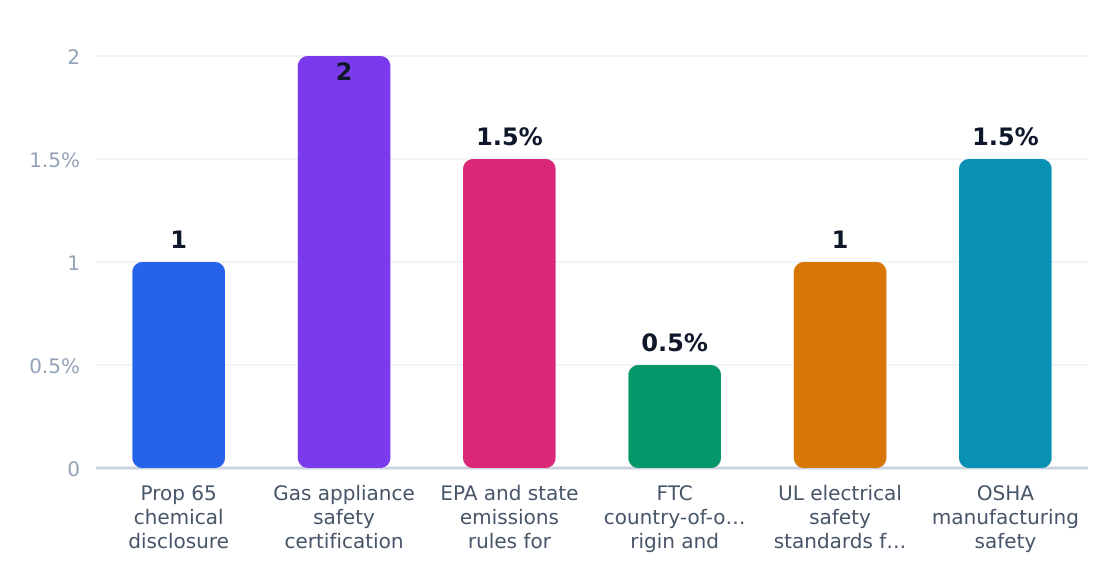
The $1.41B US barbecue grill market faces moderate regulatory burdens, with compliance costs averaging 7.5% of revenue for manufacturers according to Mordor Intelligence. Smaller operators report higher relative costs due to fixed certification fees.
Regulatory Compliance Cost Impact (%)
Estimated share of revenue consumed by compliance
Source: Mordor Intelligence
| Requirement | Agency | Cost Impact | Operational Effect |
|---|---|---|---|
| Prop 65 chemical disclosure | California OEHHA | 1% | Packaging/labeling redesign for CA market |
| Gas appliance safety certification | ANSI/CSA + CPSC | 2% | Mandatory third-party testing for gas models |
| Emissions rules for charcoal grills | EPA + state agencies | 1.5% | Material restrictions in 11 states |
| Country-of-origin labeling | FTC | 0.5% | Supply chain documentation requirements |
| UL electrical safety standards | UL Solutions | 1% | Annual recertification for electric models |
| Manufacturing safety compliance | OSHA | 1.5% | Workplace training programs |
Policy outlook favors electric grill innovation as 14 states consider stricter emissions rules for charcoal units (TechSci Research). Weber and Traeger have lobbied successfully for grandfather clauses on existing gas grill designs, while smaller players face steeper compliance hurdles in premium outdoor kitchen installations (15% market segment growing at 7% CAGR).
9. Technology, Risks & Barriers to Entry
Technology Adoption
| Technology | Adoption % | Impact | Timeline |
|---|---|---|---|
| Connected/Smart Grills | 18% | High | 3-5 years |
| Pellet Grill Systems | 12% | Medium | Current |
| Electric Grill Innovations | 25% | Medium | Current |
| Built-in Outdoor Kitchen Integration | 15% | High | 5+ years |
| Portable/Tailgating Designs | 30% | Medium | Current |
Industry Risks
| Risk | Severity | Likelihood | Mitigation |
|---|---|---|---|
| Raw Material Price Volatility (Steel, Aluminum) | High | High | Diversify suppliers, hedge contracts |
| Regulatory Restrictions on Open-Flame Cooking | Medium | Medium | Focus on electric/alternative fuel products |
| Dominance of Established Brands (Weber, Traeger) | High | High | Niche positioning, direct-to-consumer channels |
| Seasonal Demand Fluctuations | Medium | High | Diversify product lines, promote year-round use |
| Supply Chain Disruptions | High | Medium | Localize production, increase inventory buffers |
| Consumer Shift to Plant-Based Diets | Low | Low | Market grilling versatility beyond meat |
Barriers to Entry
| Barrier | Height | Detail |
|---|---|---|
| Brand Loyalty | High | 35% market share held by Weber alone makes customer acquisition costly |
| Retail Shelf Space | High | Big-box retailers prioritize established brands with proven sales |
| Minimum Efficient Scale | Medium | $57,500 typical startup cost for equipment creates capital hurdle |
| Regulatory Compliance | Medium | Safety certifications (UL, ETL) required for gas/electric models |
| Distribution Networks | High | Incumbents have locked up relationships with dealers and installers |
Key Takeaways: The barbecue grill industry faces moderate technological disruption (18% smart grill adoption) but remains dominated by material and brand power risks. New entrants must navigate Weber's 35% share while investing in either premium outdoor kitchen integration or portable/urban-focused designs to sidestep retail shelf wars. Success requires at least $57,500 in equipment spend plus a clear niche strategy.
10. Outlook & Investment Opportunities
Market Trajectory
The US barbecue grill market is projected to grow at a steady 3.07% CAGR, reaching $1.64 billion by 2031 according to OpenPR. This reflects stable demand driven by replacement cycles and outdoor living trends, though growth remains tempered by housing market fluctuations and discretionary spending cycles.
Segment Shifts Driving Growth
- Premium Outdoor Kitchens: The fastest-growing application segment at 7% annually, per end-use analysis. High-margin built-in systems from brands like Napoleon Grills are gaining share among affluent homeowners.
- Urban Renters: Representing 25% of target customers, this demographic fuels demand for compact electric grills—a segment growing at 3.5% annually according to application data.
- Connected Cooking: Traeger's IoT-enabled pellet grills exemplify tech-driven premiumization in the enthusiast segment (20% of customers).
Regional Market Distribution
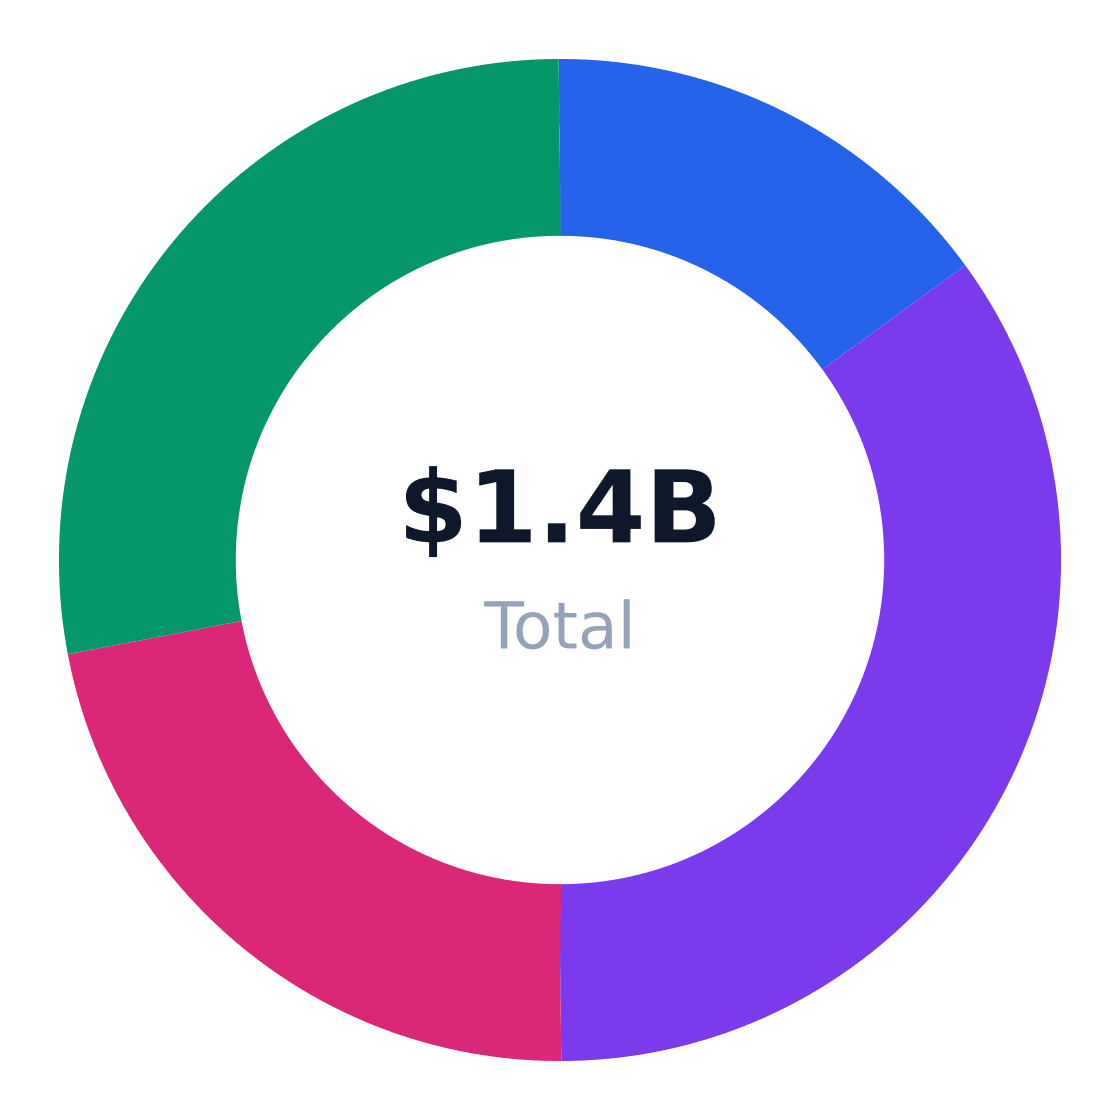
Revenue share by US region
Source: Mordor Intelligence
Investment Opportunity Matrix
| Opportunity | Market Size | Risk | Time Horizon |
|---|---|---|---|
| Premium built-in grill systems | $246M (15% of TAM) | High (luxury discretionary) | 3-5 years |
| Apartment-compatible electric grills | $98.7M (7% of TAM) | Medium (price competition) | 1-3 years |
| Pellet grill accessories & consumables | $169M (12% via Traeger) | Low (recurring revenue) | Ongoing |
| Private-label value grills | $141M (10% via Char-Broil) | Medium (retailer dependence) | 2-4 years |
| Tailgating/camping portables | $141M (10% of TAM) | Medium (seasonal) | Cyclical |
| Commercial outdoor kitchen installations | $112.8M (8% of TAM) | High (capex sensitivity) | 3+ years |
Strategic Recommendations
- Target Houston's 1.2M 20-50 year-olds with compact grill solutions—the $48M SAM offers 4% ($1.9M) SOM potential for focused operators.
- Differentiate from Weber's 35% share via niche positioning (premium, portable, or tech-enabled).
- Prioritize higher-margin accessories (20-30% gross margins) to offset hardware commoditization.
- Leverage the 7% growth in outdoor kitchen installations with integrated solutions.
- Monitor renter demographics—urbanization supports the 3.5% growth in electric/compact grills.
- Bundle grills with installation/maintenance services to boost LTV in commercial/high-end residential.
Closing Verdict
Success requires capturing share within existing segments rather than betting on market expansion. Operators should aim for:
- Premium: $500+ ASP with 40%+ gross margins
- Value: 15-20% market share in regional SAMs
- Accessories: 20% of revenue from recurring consumables
With 41 manufacturers competing for $1.41B in sales, the outlook favors differentiated players—whether through technology (Traeger), craftsmanship (Napoleon), or value retail partnerships (Char-Broil).
Industry Research & Resources
The following industry databases and research resources support this barbecue grill industry analysis. Each link opens a specific report or data page (not a generic homepage).
- The United States Barbeque Grill Market — mordorintelligence.com — Published industry research for barbecue grill
- Builtin Vs Freestanding Grills Which Segment Is Growing Faster — bbq-authority.com — Published industry research for barbecue grill
- techsciresearch.com — techsciresearch.com — Published industry research for barbecue grill
- United States Barbeque Grill Market To Reach Usd 1 64 Billion — openpr.com — Published industry research for barbecue grill
- 05 POPULATION BY AGE AND GENDER — houstontx.gov — Published industry research for barbecue grill
Data Sources & Methodology
Market sizing (TAM, SAM, SOM), segmentation, competition, and equipment data come from Perplexity-sourced industry reports and trade publications. Optional U.S. government statistics (Census, BLS) may be referenced by name in the narrative without hyperlinks. TAM reflects the total U.S. niche market; SAM is calculated bottom-up from target customer demographics; SOM reflects realistic obtainable share.
Industry research links: United States Barbeque Grill Market Growth Report 2031 · City of Houston demographics by age; U.S. barbecue grill market report for category context · WebstaurantStore and KaTom barbecue equipment listings, plus restaurant POS and equipment-financing comparison articles from 2026 · bbq-authority.com · bbq-authority.com · techsciresearch.com · mordorintelligence.com · openpr.com · houstontx.gov · houstonstateofhealth.com · houstonstateofhealth.com · neilsberg.com · fortunebusinessinsights.com · emergenresearch.com · houstonstateofhealth.com · dineopen.com · brandrums.com · restauranttools.ai · aimadefor.com · beancount.io · chowly.com · tmasmallbusinessaccounting.com · restaurantvelocity.com · peersense.com · upmenu.com · commercialexperts.com · beancount.io · katom.com · peersense.com · webstaurantstore.com · squareup.com · usbank.com · ibisworld.com · ibisworld.com · ibisworld.com · ibisworld.com · ibisworld.com · marketresearch.com · ibisworld.com · ibisworld.com