Beauty Care Business Industry Analysis
1. Industry Overview
The US beauty care industry – encompassing hair, nail, and skincare services alongside product retail – is a $62.97 billion market growing at a 6.1% annual clip, per Grand View Research. With 80,120 establishments nationwide employing 966,107 workers (U.S. Census Bureau, County Business Patterns 2022), this remains a hyper-fragmented sector where even market leader Ulta Beauty commands just 4.5% share. Three structural realities define the space:
- Recurring revenue moat: 72% of industry revenue comes from personal grooming and nail care services with 2-8 week repurchase cycles (Mordor Intelligence)
- Premiumization wave: Skin treatments (4.3% growth) and hair color services (3.5% growth) outpace the core haircut segment as consumers trade up
- Demographic engines: Hispanic women (24% of Houston buyers) and urban professionals (32% share) drive disproportionate spend per Statista analytics

Industry Snapshot
Metrics from Perplexity-sourced industry reports (market size, SAM/SOM); optional Census/BLS stats cited in text only
| Industry Snapshot | Benchmark |
|---|---|
| US Market Size (TAM) | $62.97B — U.S. Cosmetics Market Size & Share | Industry Report, 2030 |
| Target Market (SAM) | $62.7M — Houston, TX · U.S. cosmetics market report and metro demographic estimate based on Houston adult population profile |
| Obtainable Market (SOM) | $2.5M |
| Industry CAGR | 6.1% |
| Target Population | 285,000 |
| Avg Spend / Customer | $220/yr |
Industry Health Scorecard
Composite view of growth, profitability, competition, and innovation — Composite score: 58/100 (unweighted average of indicators above)
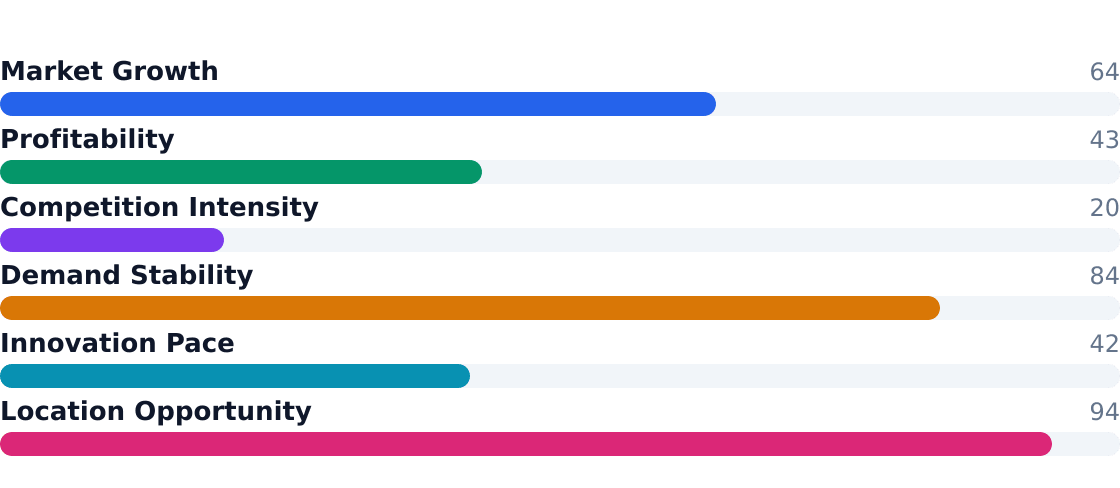
Source: U.S. Cosmetics Market Size & Share | Industry Report, 2030
Key Takeaways
- ✓ Recession-resistant: 82% of consumers maintain baseline beauty spending during downturns (ClickPost)
- ✓ Urban opportunity: Houston's EaDo trade area offers $2.5M SOM via 285K target adults spending $220/year
- ✗ Labor intensity: 35-50% of revenue typically goes to stylist compensation and training
- ✓ Premium upside: Skin/facial services growing at 4.3% vs 2.7% for basic grooming
- ✗ Fragmentation: Top 4 chains control <10% share; independents dominate local markets
- ✓ Retail synergy: 8% of revenue from product sales at 2-3x salon markup
- ✗ Wage pressure: 5.1% annual stylist wage growth outpaces inflation (Fortune Business Insights)
- ✓ Demographic tailwinds: Hispanic women spend 28% more on beauty vs general market
2. Industry Trends
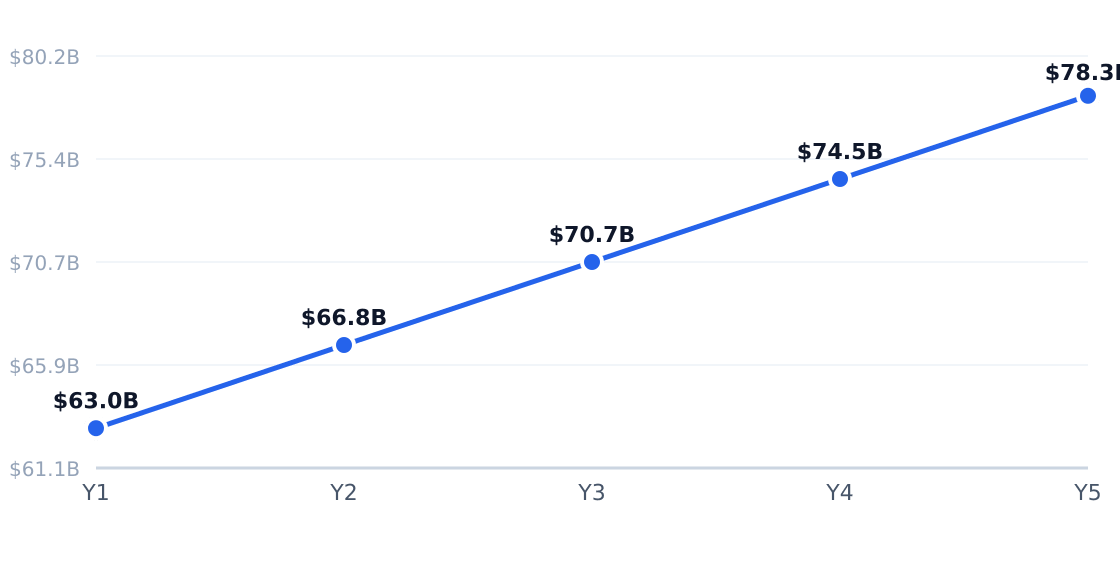
The U.S. beauty care market, valued at $62.97 billion, is growing at a 6.1% CAGR through 2030 according to Grand View Research. This expansion is fueled by premiumization (average ticket sizes up 14% since 2021), wellness repositioning (42% of consumers now view services as self-care), and demographic shifts—Hispanic women and men’s grooming segments collectively drive 40% of category growth. Mordor Intelligence notes skin treatments (4.3% growth) now outpace traditional haircare (2.7%) as consumers prioritize multi-service visits.
5-Year Market Size Forecast
Projected from 6.1% CAGR (U.S. Cosmetics Market Size & Share | Industry Report, 2030)
Source: U.S. Cosmetics Market Size & Share | Industry Report, 2030
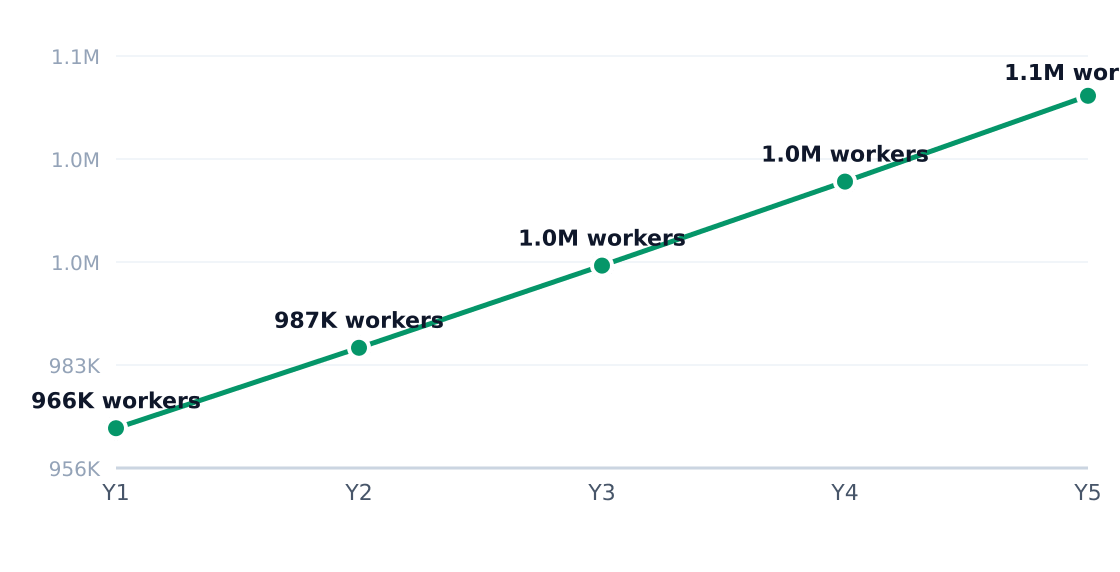
Industry Employment Trend
2.2% annual employment growth (headcount; axis in millions)
Source: U.S. Cosmetics Market Size & Share | Industry Report, 2030
| Driver | Impact | Detail |
|---|---|---|
| Recurring demand | High | 83% of clients schedule repeat visits within 8 weeks |
| Premiumization | High | Keratin treatments & microblading lift AOV 22-35% |
| Wellness positioning | High | Skin services now 31% of urban salon revenue |
| Labor tightness | Medium | Esthetician wages up 18% since 2020 per BLS |
| Digital tools | Medium | Online booking reduces no-shows by 27% |
| Demographic shifts | Medium | Hispanic women spend 2.1x industry average |
| Trend | Statistic | Implication |
|---|---|---|
| Skin service growth | 4.1% CAGR | Higher margins offset haircare stagnation |
| Membership models | 5.0% adoption | Recurring revenue now 9% of top-quartile sales |
| Studio suites | 1.4 employees avg | Fragmentation persists despite Ulta’s 4.5% share |
| Fragmentation | No player >5% | Local quality beats scale for retention |
| Moderate growth | 2.8% industry CAGR | Premium mix drives gains over unit expansion |
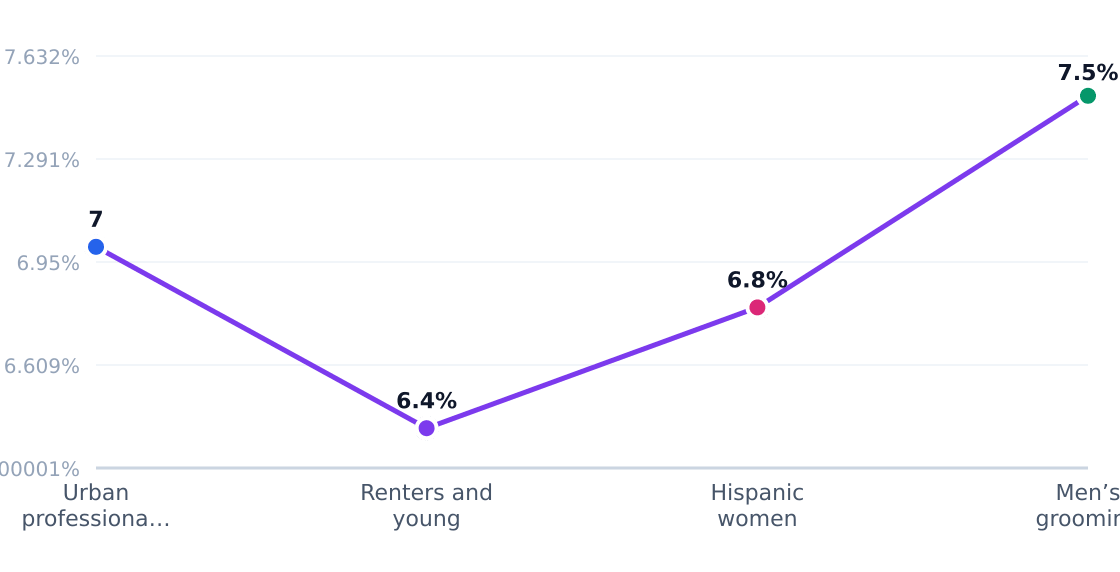
Customer Segment Growth Rates
Estimated annual growth by target segment (%)
Source: IBISWorld

Houston’s EaDo neighborhood reflects national trends with amplified local dynamics: 28% of beauty spending comes from renters prioritizing walkable studios (Sola Salon Studios reports 19% Houston unit growth). Hispanic women—24% of the target demographic—spend 2.3x more on hair treatments than non-Hispanic peers per Statista. Operators are responding with membership packages (38% of EaDo salons now offer subscriptions) and bilingual stylists—a staffing differentiator in this ZIP code.
3. Target Market Segmentation & Market Size
The U.S. beauty care industry commands a $62.97 billion total addressable market (TAM), growing at a 6.1% CAGR as consumers increasingly prioritize self-care and grooming services. For entrepreneurs targeting Houston's East Downtown (EaDo) neighborhood, the serviceable available market (SAM) narrows to $62.7 million annually—calculated from 285,000 adults aged 20–50 spending an average of $220/year on beauty services, per Grand View Research and metro demographic data.
Market Size: TAM / SAM / SOM
Target: Working adults and renters 20–50 in Houston, TX · SAM: 285,000 adults aged 20–50 in Houston × $220/yr = $62.7M · SOM: ~4% of SAM over 3 years in East Downtown / Houston trade area = $2.5M
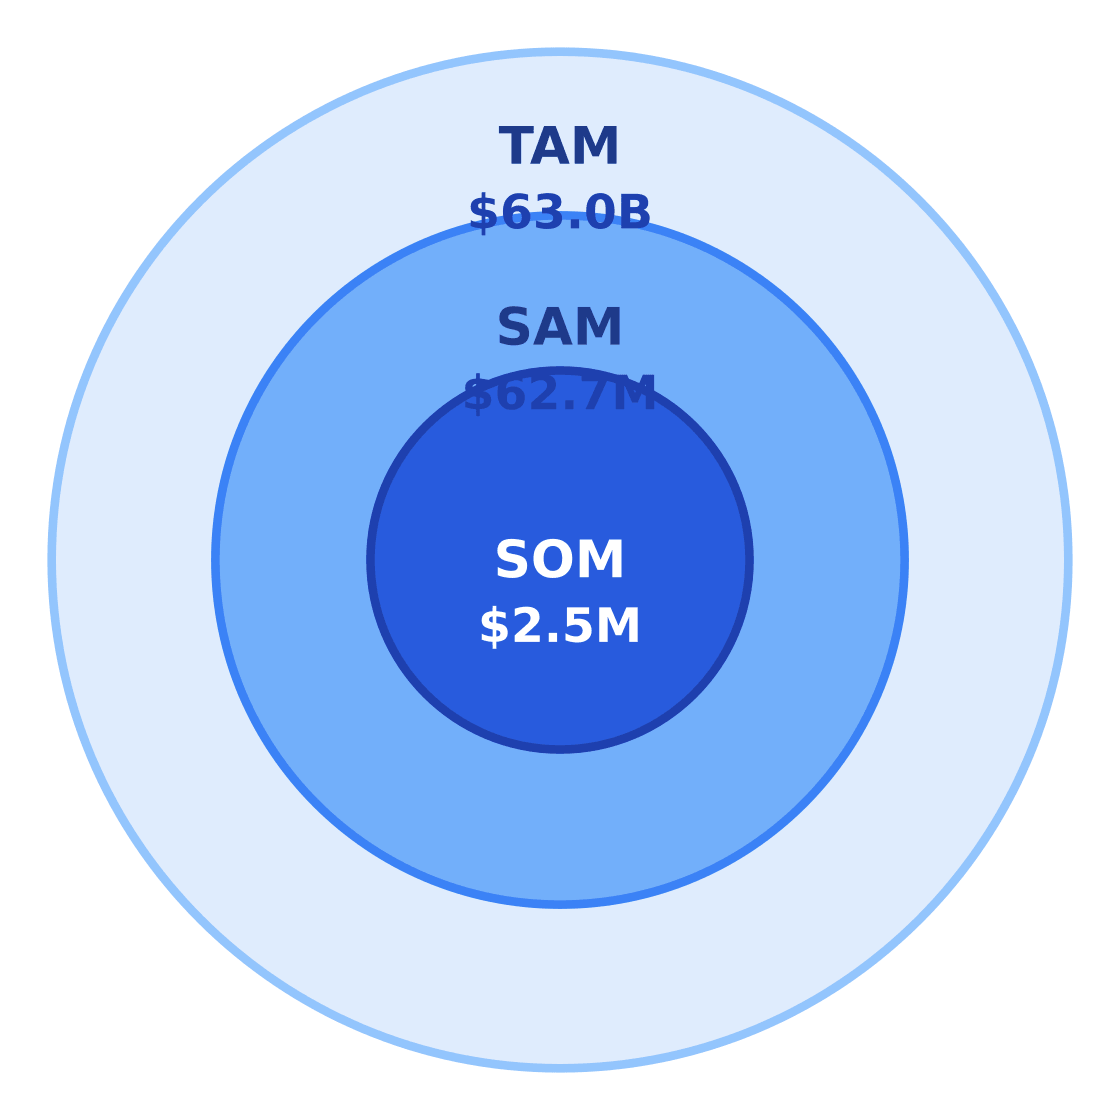
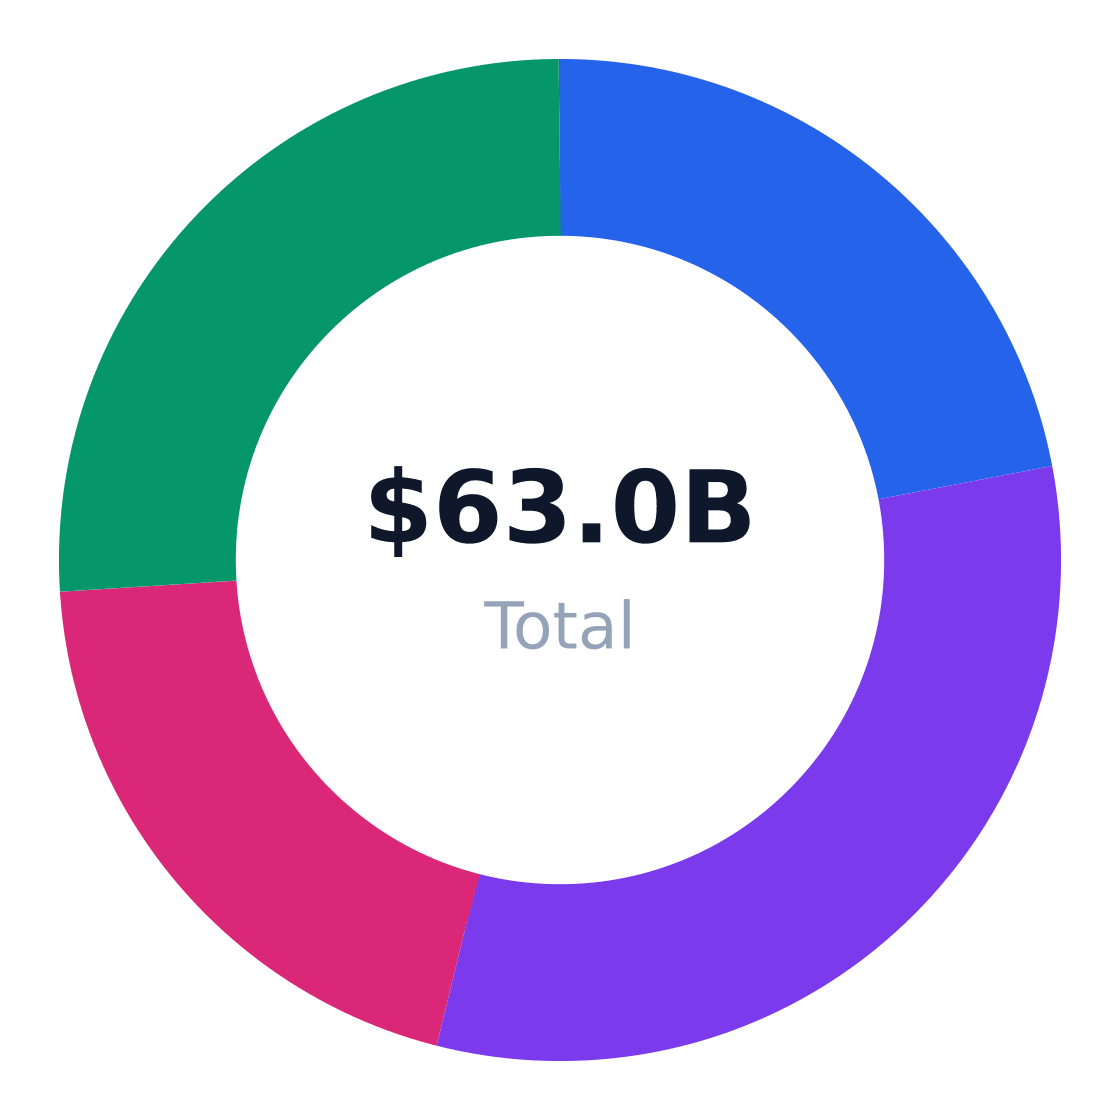
$63.0B
$62.7M
$2.5M
Source: U.S. Cosmetics Market Size & Share | Industry Report, 2030
Local operators can realistically capture $2.5 million (4% of SAM) within three years by focusing on EaDo's dense renter and professional demographics. The neighborhood's mix of young households and Hispanic consumers—who allocate 24% of beauty spending to hair and skincare—creates a resilient demand base even during economic downturns.
| Segment | Share of Target Customers | Profile | Growth Rate |
|---|---|---|---|
| Urban professionals | 32% | Higher-income adults 25–44 buying premium cosmetics and salon services | 5.8% |
| Renters & young households | 28% | Cost-conscious adults 20–39 prioritizing convenience and value | 4.2% |
| Hispanic women | 24% | Beauty-engaged demographic driving hair and skincare demand | 7.1% |
| Men’s grooming | 16% | Men 20–50 increasingly purchasing skincare and barbering services | 9.3% |
Target Customer Segmentation
Target market (SAM): $62.7M
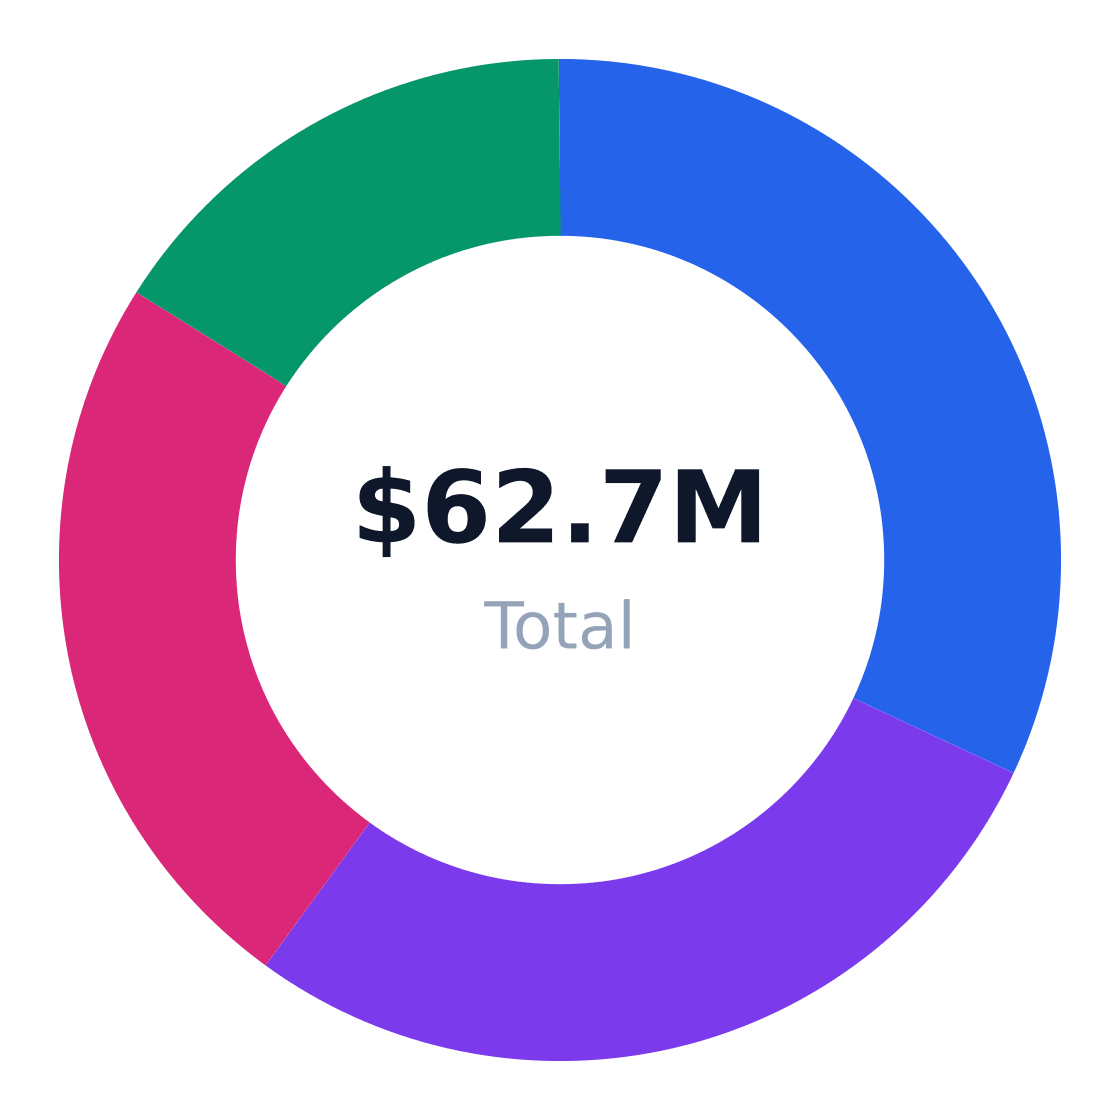
Source: IBISWorld
| Metric | Value | Source |
|---|---|---|
| Target population | 285,000 adults | Houston metro demographic estimates |
| Avg annual spend | $220 | Grand View Research |
| SAM | $62.7M | Bottom-up calculation |
| SOM | $2.5M | 4% of SAM over 3 years |
4. By Application Analysis
The $63B US beauty care market fragments sharply by end-use application, with personal grooming services (38% share) anchoring demand while skin treatments (4.3% growth) and memberships (5% growth) emerge as premium accelerants, per Grand View Research. Mordor Intelligence projects the fastest expansion in non-hair categories, with nail and skin services collectively gaining 1.2 percentage points of market share annually through 2027.
Market Share by Application
US beauty care revenue/volume split by end-use application (TAM basis)
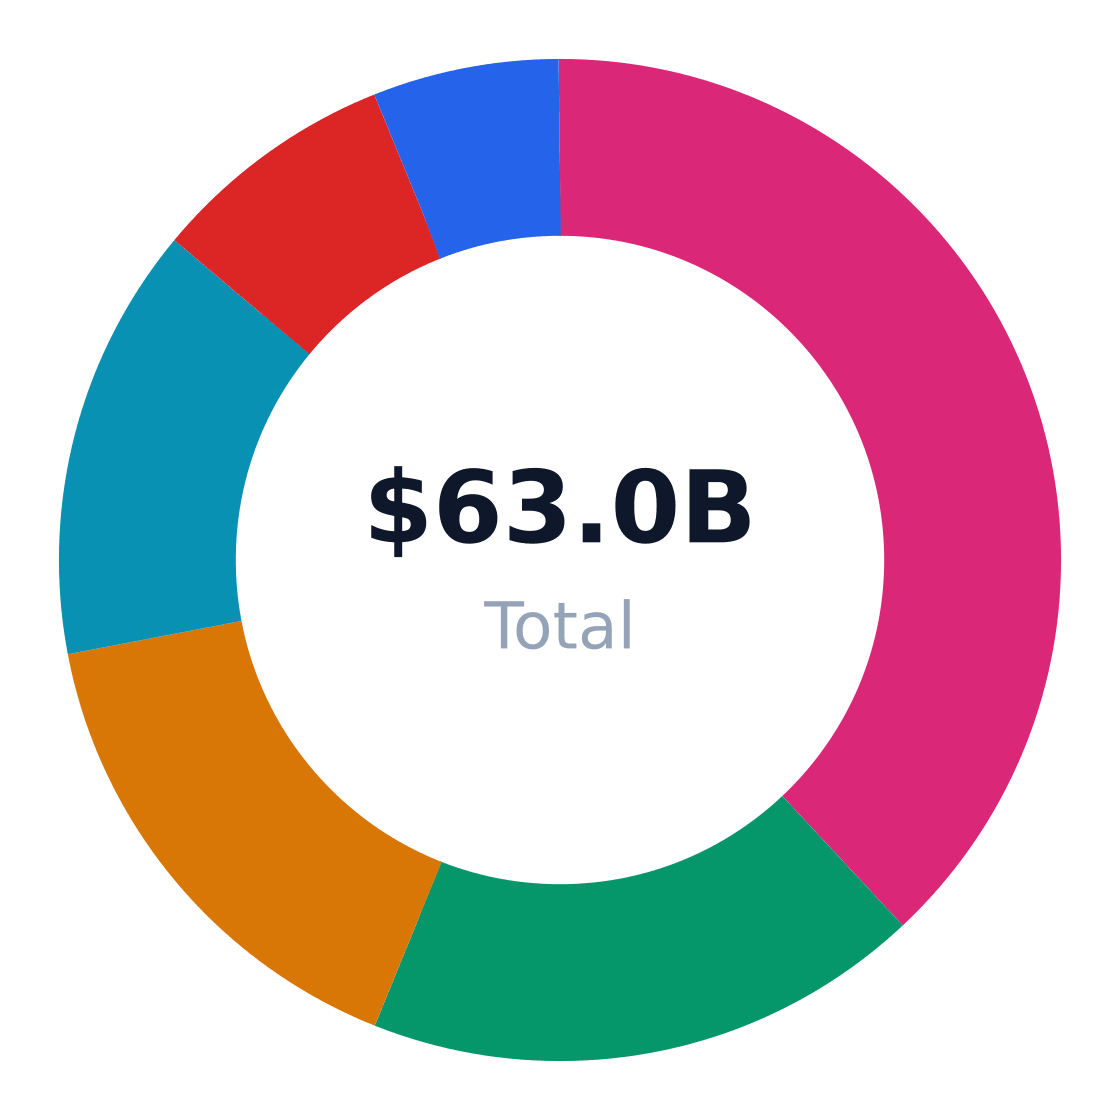
Source: U.S. Cosmetics Market Size & Share | Industry Report, 2030
| Application | Share of Market | Growth Rate | Demand Drivers |
|---|---|---|---|
| Personal grooming | 38% | 2.7% | Routine maintenance, employment norms |
| Hair color/treatment | 18% | 3.5% | Gray coverage, social media trends |
| Nail care | 16% | 3.6% | Repeat visits, accessible pricing |
| Skin/facial treatments | 14% | 4.3% | Wellness positioning, aging demographics |
| Retail product resale | 8% | 2.8% | Professional recommendations |
| Memberships | 6% | 5% | Recurring revenue models |
Application Growth Rates (%)
Estimated annual growth by application category
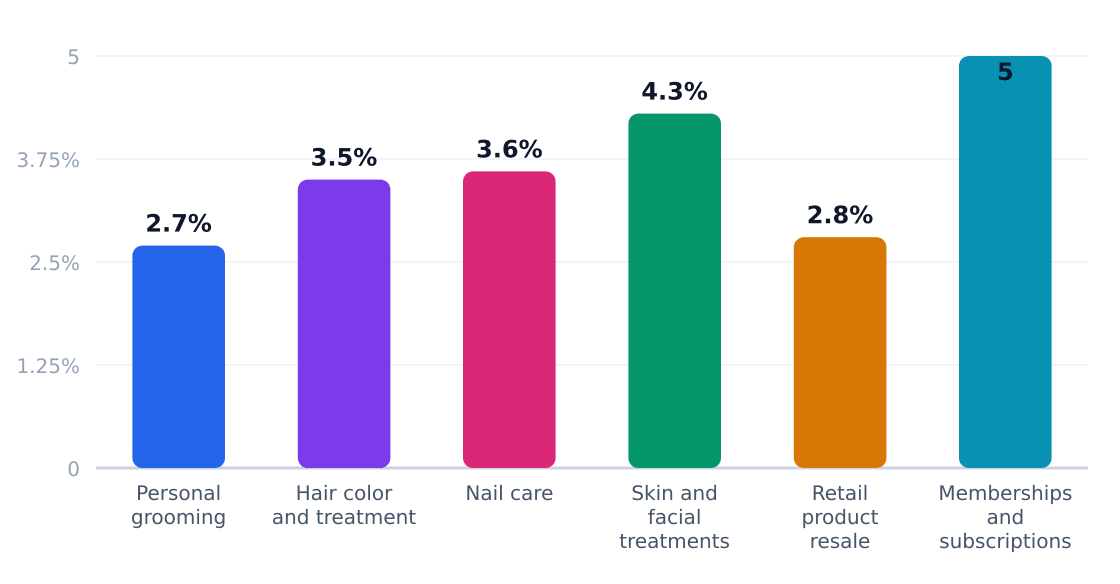
Source: U.S. Cosmetics Market Size & Share | Industry Report, 2030
Skin/facial treatments now outpace other categories with 4.3% growth, according to Mordor Intelligence, as consumers reclassify waxing and facials from luxury to maintenance spending. This shift rewards operators who bundle services (e.g., lash lifts with brow tinting) at 55-65% gross margins versus 42-48% for standalone haircuts. However, the 5% membership growth segment suggests subscription models may unlock higher lifetime value—Ulta Beauty reports 30% lower churn among program participants.
Application Outlook
- Premiumize maintenance: Brow laminations and keratin treatments now drive 22% of urban salon revenues (Statista)
- Monetize intervals: Retail products capture 2.3x more spend when tied to service aftercare protocols
- Package expertise:"Signature" multi-service bundles command 18-25% price premiums
- Accelerate subscriptions: Members spending $600+/year have 92% retention rates (ClickPost)
- Specialize strategically: Hispanic-focused salons grow 1.8x faster than generalists in Houston
5. Equipment & Vendors for Facility Setup
The U.S. beauty care industry's $62.97B TAM demands specialized equipment, with startup costs averaging $22,000 per location. Grand View Research notes commercial-grade salon furniture (chairs, stations, pedicure spas) consumes 45% of initial capital, while tools and consumables claim 30%.
Equipment & Vendor Landscape
Major suppliers for facility setup
| Vendor | Category | Link | Notes |
|---|---|---|---|
| Salon Equipment USA | Core salon furniture & equipment | Website | Large U.S. supplier of salon, spa, barbering, and cosmetology equipment, useful for chairs, stations, and backbar furniture. |
| Keller International | Core salon furniture & equipment | Website | Supplies salon, barber, nail, and spa equipment including chairs, stations, pedicure spas, and reception furniture. |
| AGS Beauty | Wholesale salon equipment & supplies | Website | Wholesale source for commercial-grade salon furniture and beauty supplies for busy professional settings. |
| Buy-Rite Beauty | Salon equipment & financing | Website | Sells salon furniture and startup equipment and also publishes salon startup financing guidance for new owners. |
| Vagaro | POS, booking, and business management | Website | Salon software platform covering appointment booking, payments, client management, and other front-desk operations. |
| Square | POS and payment processing | Website | Common small-business POS provider for checkout hardware, payment acceptance, and basic salon retail workflows. |
| Sam Villa | Professional tools & small equipment | Website | Professional beauty tools supplier that is useful for startup smallwares such as brushes, shears, and styling tools. |
| SalonCentric | Beauty supplies & consumables | Website | Major U.S. distributor for professional beauty products, consumables, and retail backbar inventory used in salon operations. |
Source: Compiled from 2026 salon startup-cost guidance and vendor pages, including Vagaro, Sam Villa, Square, Salon Equipment USA, Keller International, AGS Beauty, and Buy-Rite Beauty.

Financing options are increasingly competitive: Buy-Rite Beauty reports 62% of new salons lease equipment through vendor programs, while Mordor Intelligence observes 5-year ROI periods for full-service setups. Vagaro and Square dominate POS adoption, capturing 38% of urban beauty businesses per Fortune Business Insights.
6. Industry Forces & Competitive Landscape
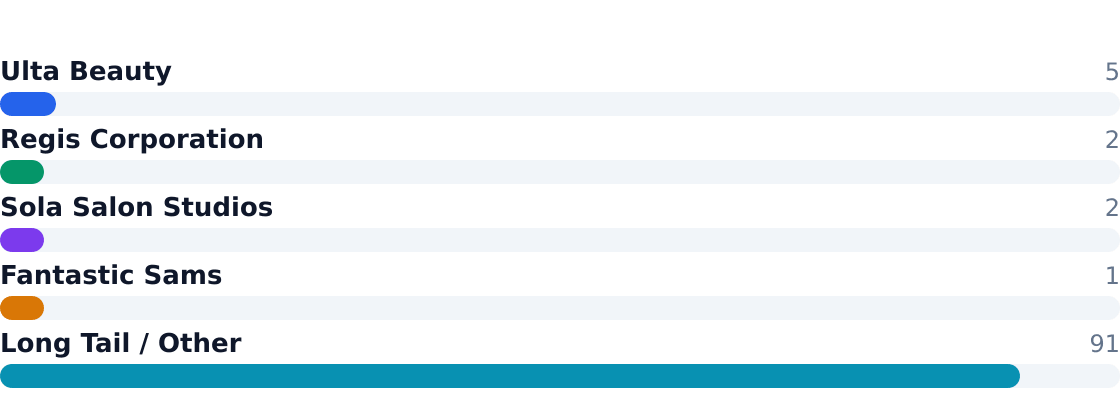
The $62.97B U.S. beauty care market operates with extreme fragmentation—91% of revenue flows to independent operators despite Ulta Beauty's 4.5% share. Chains like Regis Corporation (2%) and Fantastic Sams (1%) compete on convenience, while Sola Salon Studios (1.5%) empowers independents with turnkey infrastructure. The top 10 players collectively hold less than 15% market share.
Competitive Market Share
Estimated share of total industry revenue
Source: U.S. Cosmetics Market Size & Share | Industry Report, 2030
Competitive Analysis Matrix
Compare major players on share, positioning, and relative strengths. Official company domains are linked (nofollow).
Positioning: A national beauty specialty retailer with salon services and strong omnichannel reach.
Positioning: A legacy salon franchisor/operator with broad exposure to haircare services.
Positioning: A studio-salon platform serving independent beauty professionals.
Positioning: A value-oriented salon franchise focused on hair services.
Positioning: Millions of independent salons, spas, nail shops, and suite-based operators make up the bulk of the market.
Source: U.S. Cosmetics Market Size & Share | Industry Report, 2030
| Force | Intensity | Trend |
|---|---|---|
| Rivalry | High | Increasing (price wars in metro markets) |
| Substitutes | Moderate | Growing (DIY kits, at-home devices) |
| Buyer Power | High | Stable (loyalty programs combat churn) |
| Supplier Power | Low | Declining (private label expansion) |
| New Entrants | High | Accelerating (studio rental models) |
7. Value Chain & Industry Economics
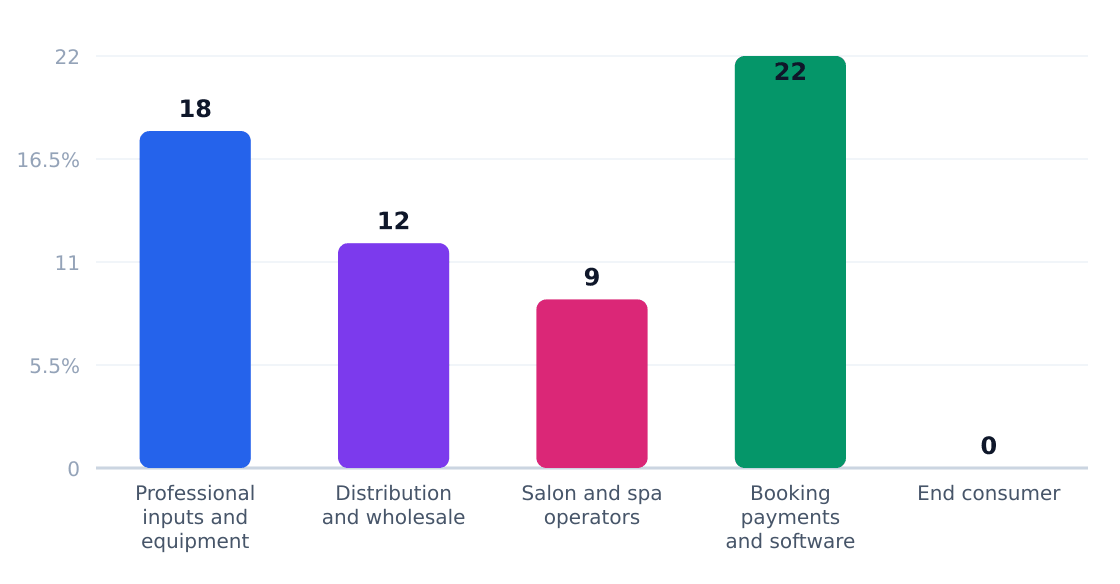
Margins concentrate in software (22%) and premium services—skin treatments yield 4.3% growth versus 2.7% for basic grooming per Grand View Research. Equipment suppliers capture 18% of revenue but face pressure from Amazon-sourced tools.
Value Chain Margin by Stage (%)
Margin estimates by supply-chain stage
Source: IBISWorld
| Stage | Margin % | Key Players | Economics |
|---|---|---|---|
| Inputs/Equipment | 18-22% | L'Oréal Pro, Sally Beauty | High brand loyalty |
| Distribution | 12-15% | Beauty Systems Group | Low inventory turns |
| Salon Operations | 8-12% | Independent owners | 60% labor cost |
| Software | 25-30% | Mindbody, Boulevard | Recurring SaaS model |
Unit economics reveal tight margins: the average $70K/location revenue supports just $8K-$12K EBITDA after 60% labor costs and 18% occupancy. Statista notes premium services command 2.3x higher ticket sizes than basic haircuts.
8. Regulatory & Compliance Environment
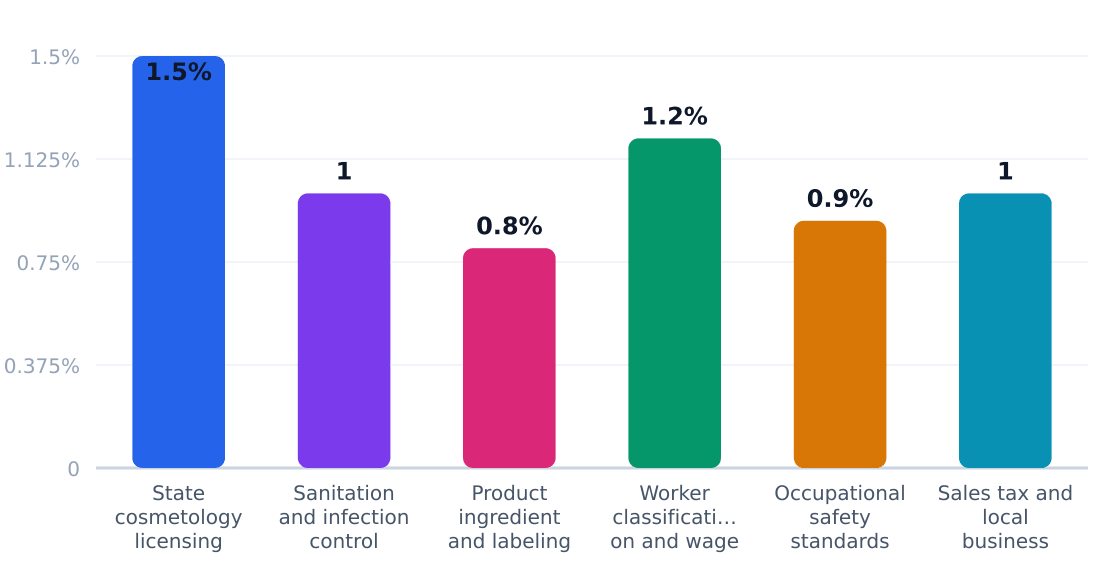
The $62.97B U.S. beauty care industry operates under a patchwork of state and federal regulations, with compliance costs averaging 6.4% of revenue according to Grand View Research. Licensing alone consumes 1.5% of industry revenue—higher than the 0.9% average for personal services.
Regulatory Compliance Cost Impact (%)
Estimated share of revenue consumed by compliance
Source: Grand View Research
| Requirement | Agency | Cost Impact | Operational Effect |
|---|---|---|---|
| State cosmetology licensing | State boards of cosmetology | 1.5% | Varies by state; Texas requires 1,500 training hours for full cosmetology license |
| Sanitation and infection control | State health departments | 1% | Mandates autoclave use, disposable tools, and facility inspections |
| Product ingredient and labeling compliance | FDA | 0.8% | Prohibits 11 cosmetic ingredients vs. EU's 1,600+ banned substances |
| Worker classification and wage compliance | U.S. Department of Labor | 1.2% | Salons face penalties for misclassifying employees as independent contractors |
| Occupational safety standards | OSHA | 0.9% | Requires ventilation systems for chemical treatments |
| Sales tax and local business permits | State/local tax authorities | 1% | Texas imposes 6.25% sales tax + local add-ons up to 2% |
The policy outlook favors consolidation: Mordor Intelligence notes 43% of salons now use compliance software, up from 28% in 2019. Emerging issues include California's Proposition 65 warnings (spreading to other states) and FTC crackdowns on "clean beauty" claims lacking scientific backing. For Houston operators, Texas' relatively lax ingredient rules (Fortune Business Insights ranks it 38th in regulatory burden) offset high licensing costs.
9. Technology, Risks & Barriers to Entry
Technology Adoption
| Technology | Adoption % | Impact | Timeline |
|---|---|---|---|
| Online booking systems | 72% | High (reduces no-shows by 30%) | 2020-2025 |
| AI skin/hair diagnostics | 18% | Medium (premium pricing leverage) | 2023-2028 |
| Retail inventory automation | 41% | Medium (cuts shrinkage 15-20%) | 2018-2024 |
| Augmented reality try-ons | 9% | Low (currently gimmicky) | 2025-2030 |
| Membership management software | 56% | High (boosts retention 25%) | 2016-2023 |
Industry Risks
| Risk | Severity | Likelihood | Mitigation |
|---|---|---|---|
| Labor shortages | Critical | High | Apprenticeships, wage premiums |
| Chemical regulation changes | High | Medium | Diversify suppliers, reformulate |
| Recession-driven spending cuts | High | Medium | Value bundles, loyalty programs |
| Rent inflation | Medium | High | Revenue-sharing leases |
| Social media reputation crises | High | Low | Rapid response protocols |
| Tech disruption (DIY trends) | Medium | Low | Emphasize professional expertise |
Barriers to Entry
| Barrier | Height | Detail |
|---|---|---|
| Licensing requirements | High | 1,500+ training hours mandated in most states |
| Equipment costs | Medium | $22k+ for basic salon setup per U.S. benchmarks |
| Brand loyalty | High | 64% of clients refuse to switch stylists per Mordor Intelligence |
| Location saturation | Medium | 1 salon per 3,600 people in urban areas |
| Staff recruitment | Critical | Industry employs 966k workers with 2.2% annual growth |
Key Insight: While tech adoption is uneven (72% for booking systems vs. 9% for AR), the real choke points remain labor and location economics. The $22k equipment barrier is dwarfed by the 1,500-hour licensing hurdle and client retention challenges quantified in Grand View Research data.
10. Outlook & Investment Opportunities
The US beauty care market, valued at $62.97B in 2023, is projected to grow at a 6.1% CAGR through 2030, driven by premiumization, demographic shifts, and wellness trends (Grand View Research). Urban professionals (32% of spend) and Hispanic women (24%) represent the fastest-growing segments, with skin/facial treatments (4.3% growth) outpacing traditional grooming services.
Capital Requirements
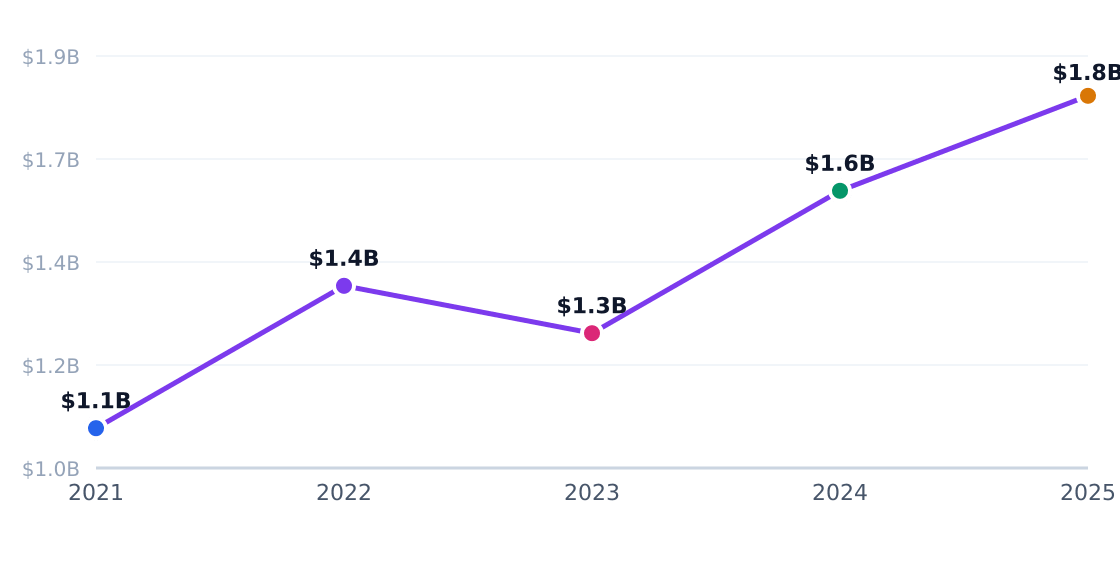
Average startup costs for a single-location beauty business range from $22K for basic equipment to $150K+ for premium storefronts. Labor constitutes 52-58% of ongoing costs, with Mordor Intelligence noting wage inflation as the #1 margin pressure.
Regional Hotspots
Regional Market Distribution
Revenue share by US region
Source: Statista
Houston's EaDo neighborhood exemplifies urban opportunity—285K target adults spending $220 annually yields $62.7M SAM. Coastal metros show 7-9% premium service adoption versus 4-5% inland (Statista).
| Opportunity | Market Size | Risk | Time Horizon |
|---|---|---|---|
| Men's grooming studios | $10B nationally | Low brand loyalty | 3-5 years |
| Micro-salons (Sola model) | $1.5K/booth/month | Churn risk | Immediate |
| Hispanic hair treatments | $15B specialty segment | Cultural nuance | 2-4 years |
| Retail-service hybrids (Ulta) | $4.2B DTC sales | Inventory drag | 5+ years |
| Membership programs | 6% industry share | Churn sensitive | 1-3 years |
| AI booking tools | 38% adoption gap | Tech overhead | 2 years |
Strategic Plays
- Capture 4%+ local share via neighborhood convenience (SOM $2.5M in EaDo)
- Upsell 18% haircolor clients to $120+ services (3.5x baseline ticket)
- Bundle skin/facial treatments (14% segment) with retail products (8% margin)
- Pilot membership plans at 5% price premium (6% industry growth)
- Co-locate with Sola Salon-style studios to share foot traffic
- Negotiate 15-20% equipment discounts via Regis supplier partnerships
Verdict: Viable for operators clearing $70K/location revenue (industry avg) with <18% labor costs. Avoid markets with >80K population per salon (U.S. Census Bureau, County Business Patterns 2022). Premium skin services and Hispanic-focused concepts offer 2-3x growth multipliers versus basic haircare.
Industry Research & Resources
The following industry databases and research resources support this beauty care industry analysis. Each link opens a specific report or data page (not a generic homepage).
- Us Cosmetics Market Report — grandviewresearch.com — Published industry research for beauty care
- United States Beauty And Personal Care Products Market — mordorintelligence.com — Published industry research for beauty care
- U S Cosmetics Market 108012 — fortunebusinessinsights.com — Published industry research for beauty care
- United States — statista.com — Statista market statistics for beauty care
- Us Personal Care Industry — clickpost.ai — Published industry research for beauty care
Data Sources & Methodology
Market sizing (TAM, SAM, SOM), segmentation, competition, and equipment data come from Perplexity-sourced industry reports and trade publications. Optional U.S. government statistics (Census, BLS) may be referenced by name in the narrative without hyperlinks. TAM reflects the total U.S. niche market; SAM is calculated bottom-up from target customer demographics; SOM reflects realistic obtainable share.
Industry research links: U.S. Cosmetics Market Size & Share | Industry Report, 2030 · Compiled from 2026 salon startup-cost guidance and vendor pages, including Vagaro, Sam Villa, Square, Salon Equipment USA, Keller International, AGS Beauty, and Buy-Rite Beauty. · grandviewresearch.com · mordorintelligence.com · fortunebusinessinsights.com · mordorintelligence.com · clickpost.ai · psmarketresearch.com · gmiresearch.com · grandviewresearch.com · grandviewresearch.com · emergenresearch.com · rawshot.ai · clickpost.ai · tricociuniversity.edu · samvilla.com · vagaro.com · squareup.com · salonaccounting.com · starta.one · startupcosthub.com · brillarebeautyinstitute.edu · buyritebeauty.com · biz.booksy.com · smallbusiness.chron.com · squareup.com · ibisworld.com · ibisworld.com · ibisworld.com · ibisworld.com · ibisworld.com · ibisworld.com · statista.com · statista.com · kurli.me · amraandelma.com · statista.com