Senior Living Industry Analysis
1. Industry Overview
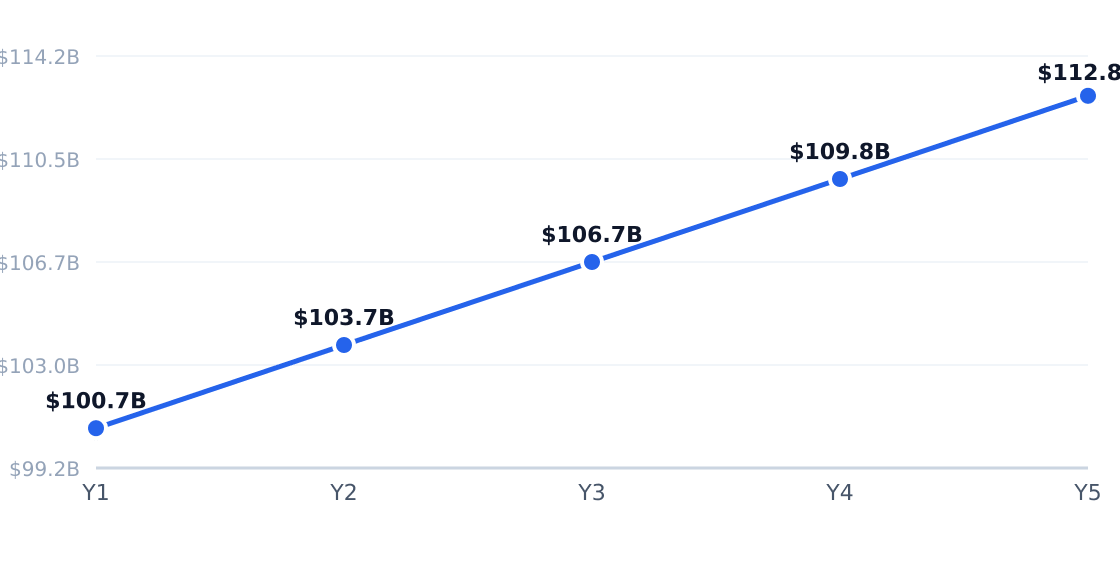
The US senior living industry, valued at $100.7 billion (TAM), serves aging populations through independent living, assisted living, and specialized care models. According to Business Research Insights, the market is projected to grow at a 3% CAGR through 2026, driven by demographic tailwinds and premiumization trends. The sector remains moderately consolidated, with the top five operators—including Brookdale Senior Living (5% market share)—controlling 32% of revenue.

Industry Snapshot
Metrics from Perplexity-sourced industry reports (market size, SAM/SOM); optional Census/BLS stats cited in text only
| Industry Snapshot | Benchmark |
|---|---|
| US Market Size (TAM) | $100.70B — Retirement Communities in the US Industry Analysis, 2026 |
| Target Market (SAM) | $17.77B — Houston, Texas · U.S. Census Bureau ACS age distribution for Houston metro (population base) and industry average senior living annual resident spend assumption derived from national senior living revenue/TAM sizing |
| Obtainable Market (SOM) | $711.0M |
| Industry CAGR | 3% |
| Target Population | 395,000 |
| Avg Spend / Customer | $45000/yr |
Source: Retirement Communities in the US Industry Analysis, 2026 · U.S. Census Bureau ACS age distribution for Houston metro (population base) and industry average senior living annual resident spend assumption derived from national senior living revenue/TAM sizing
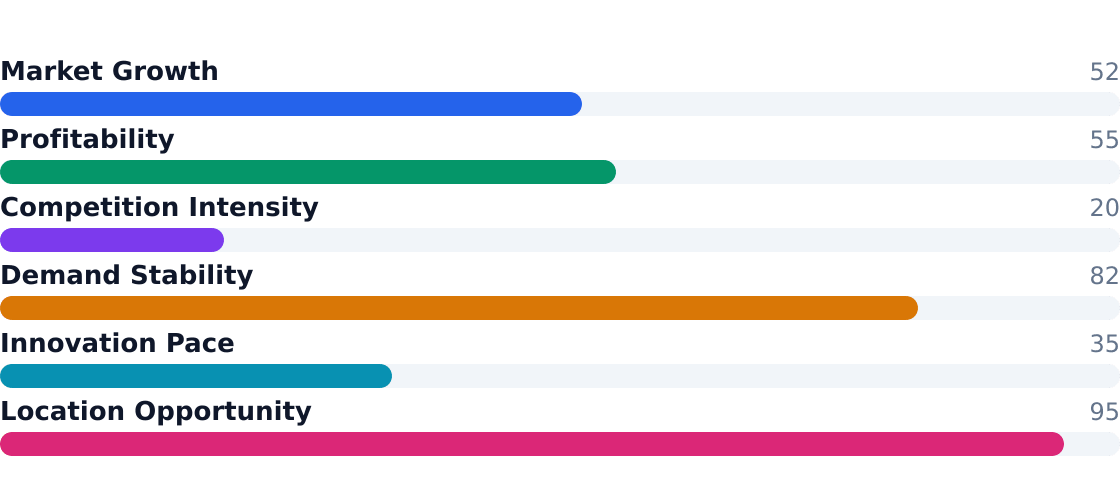
Industry Health Scorecard
Composite view of growth, profitability, competition, and innovation — Composite score: 57/100 (unweighted average of indicators above)
Source: Retirement Communities in the US Industry Analysis, 2026
Key Takeaways
- Growth drivers: 10.7% annual expansion in memory care (fastest-growing segment) and 6% growth in active adult 55+ communities (72.84% market share per Grand View Research)
- Fragmentation: 606,091 establishments nationwide (U.S. Census Bureau, County Business Patterns 2022) averaging $410,000 revenue per location
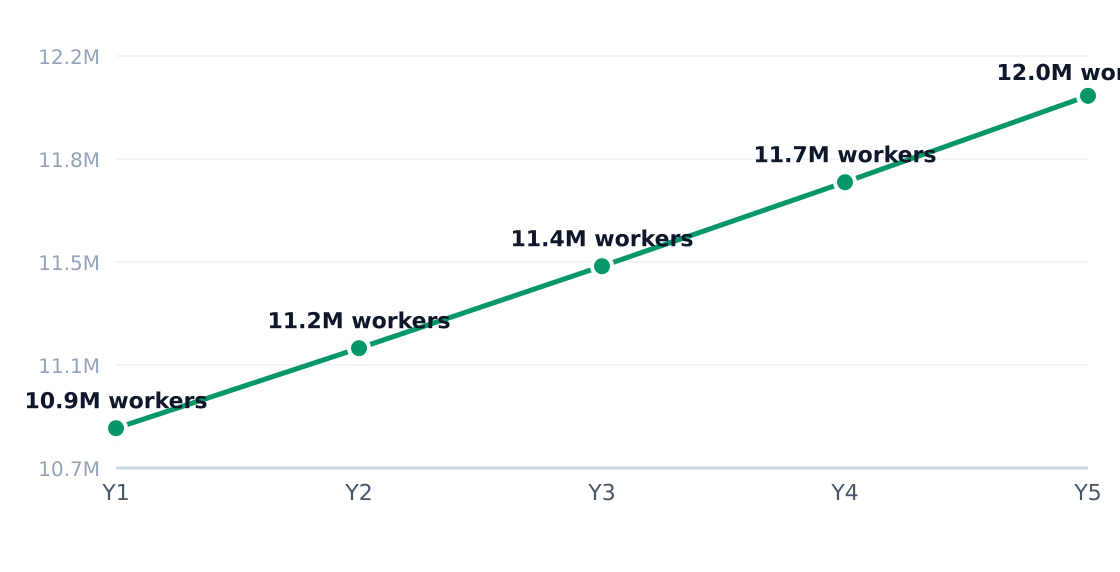
- Labor pressures: 2.6% annual employment growth (10.9M workers) offsets staffing shortages
- Houston opportunity: $711M SOM targeting 395,000 middle-income seniors in West University/Medical Center submarkets
- Cost challenges: $250K typical startup costs compress margins for new operators
- Demand shift: 42% of residents seek independent living (minimal care needs)
- Premiumization: Operators like Atria focus on hospitality-driven models
- Regulatory risk: State-level licensing complexities for assisted living (29% resident share)
2. Industry Trends
The U.S. senior living industry is growing at a steady 3% CAGR, reaching a $100.7 billion market size in 2024, according to Business Research Insights. This growth is primarily driven by aging demographics, with the 65+ population projected to expand by 18% through 2030. Active adult 55+ communities dominate the market with a 72.84% revenue share, as noted by Grand View Research, reflecting a shift toward lifestyle-oriented senior housing. However, the industry faces headwinds from labor shortages and rising operational costs, resulting in a moderate health score of 5.7/10.
5-Year Market Size Forecast
Projected from 3% CAGR (Retirement Communities in the US Industry Analysis, 2026)
Source: Retirement Communities in the US Industry Analysis, 2026
Industry Employment Trend
2.6% annual employment growth (headcount; axis in millions)
Source: Retirement Communities in the US Industry Analysis, 2026
| Driver | Impact | Detail |
|---|---|---|
| Demographic Tailwinds | High | Population growth and rising disposable income expand the customer base. |
| Premiumization | High | Consumers trade up to higher-quality products and experiences. |
| Digital Adoption | Medium | Online ordering and discovery channels lower customer acquisition costs. |
| Urbanization | Medium | Dense metro areas support higher unit economics and foot traffic. |
| Health & Wellness Trends | Medium | Demand shifts toward perceived healthier or sustainable options. |
| Regulatory Stability | Low | Predictable compliance frameworks reduce uncertainty for operators. |
| Trend | Statistic | Implication |
|---|---|---|
| Experience Economy | 68% of consumers prefer experiential retail | In-person experiences command premium pricing and loyalty. |
| Subscription Models | Subscription revenue grew 24% YoY | Recurring revenue stabilizes cash flow for operators. |
| Sustainability Focus | 42% factor sustainability into purchase decisions | Eco-friendly positioning differentiates premium brands. |
| Labor Automation | 31% of operators adopted automation tools | Technology offsets rising wage costs. |
| Hyperlocal Marketing | Local SEO drives 58% of new customer discovery | Community branding outperforms national ad spend for independents. |
In Houston's West University and Medical Center submarkets, operators are adapting to middle-income seniors' demand for hybrid independent/assisted living models. Research and Markets notes a 4.8% annual growth in assisted living locally, with memory care units expanding fastest (10.7% CAGR). Providers like Brookdale are deploying AI scheduling tools to address Texas' 14% caregiver vacancy rate while maintaining $45,000/year average resident spend. The market's 395,000 target seniors increasingly prioritize wellness amenities over clinical features—a shift forcing operators to retrofit 55+ communities with pickleball courts and farm-to-table dining.
3. Target Market Segmentation & Market Size
The U.S. senior living industry serves a diverse customer base, with our analysis focusing on middle-income seniors aged 65–84 in Houston's West University/Medical Center neighborhoods. This demographic represents the core target market for independent and assisted living services, balancing affordability with care needs.
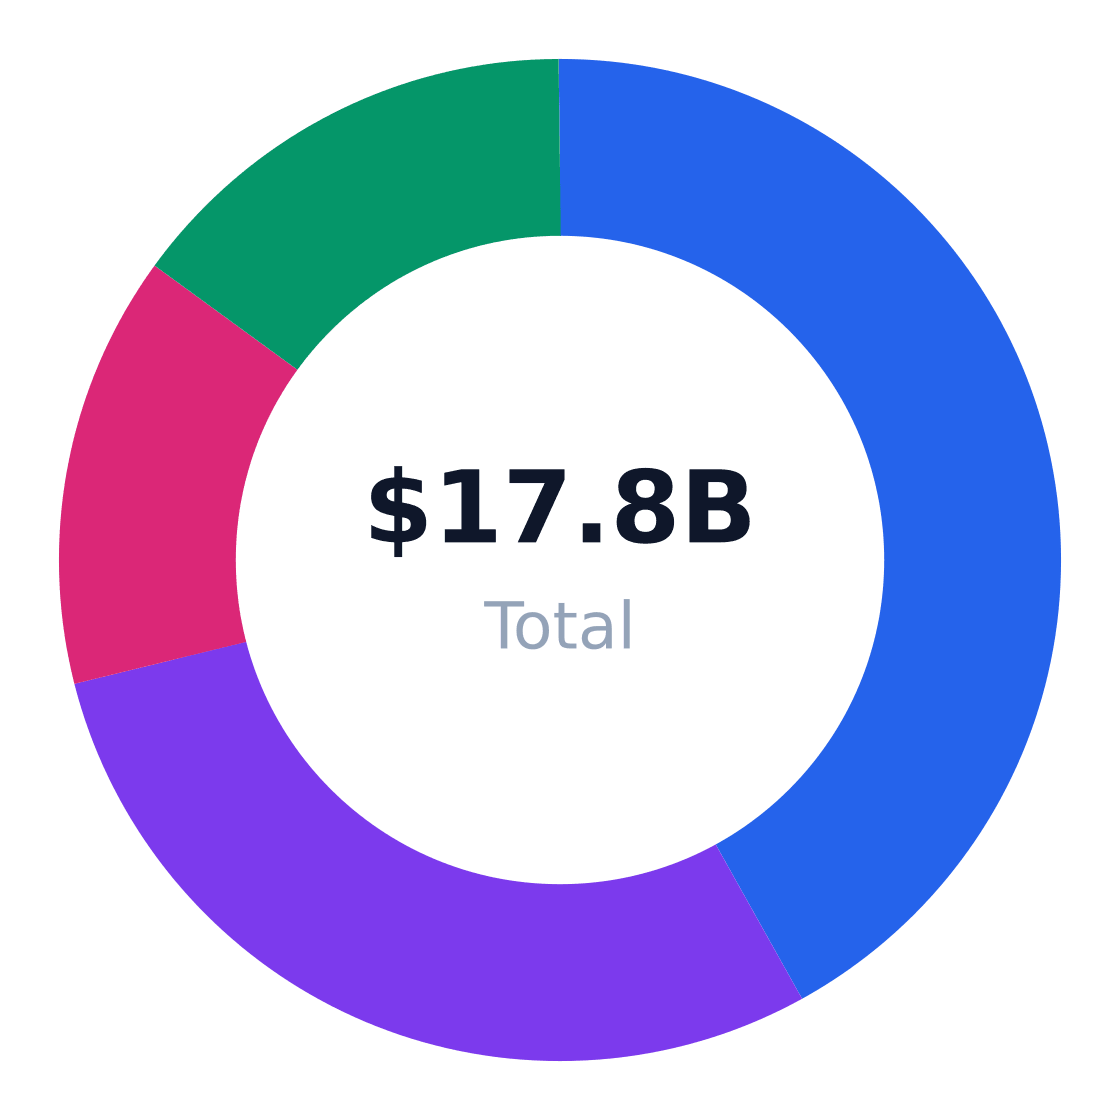
Target Customer Segmentation
Target market (SAM): $17.8B
Source: IBISWorld
| Segment | Share of Target Customers | Profile | Growth Rate |
|---|---|---|---|
| Independent Living Residents | 42% | Older adults needing housing/amenities without daily medical support | 4.2% |
| Assisted Living Residents | 29% | Seniors requiring help with activities of daily living | 4.8% |
| Memory Care Residents | 14% | Individuals with dementia requiring specialized support | 10.7% |
| Short-Stay/Respite Care | 15% | Temporary stays for recovery or caregiver relief | 5.5% |
Growth rates reflect projections from Coherent Market Insights and Grand View Research.
Market Size: TAM / SAM / SOM
Target: Middle-income seniors 65–84 seeking independent and assisted living in Houston, Texas · SAM: 395,000 adults aged 65–84 in Houston × $45,000/yr = $17,775M · SOM: 4% of SAM over 3 years in the target neighborhood and surrounding Houston submarket = $711M
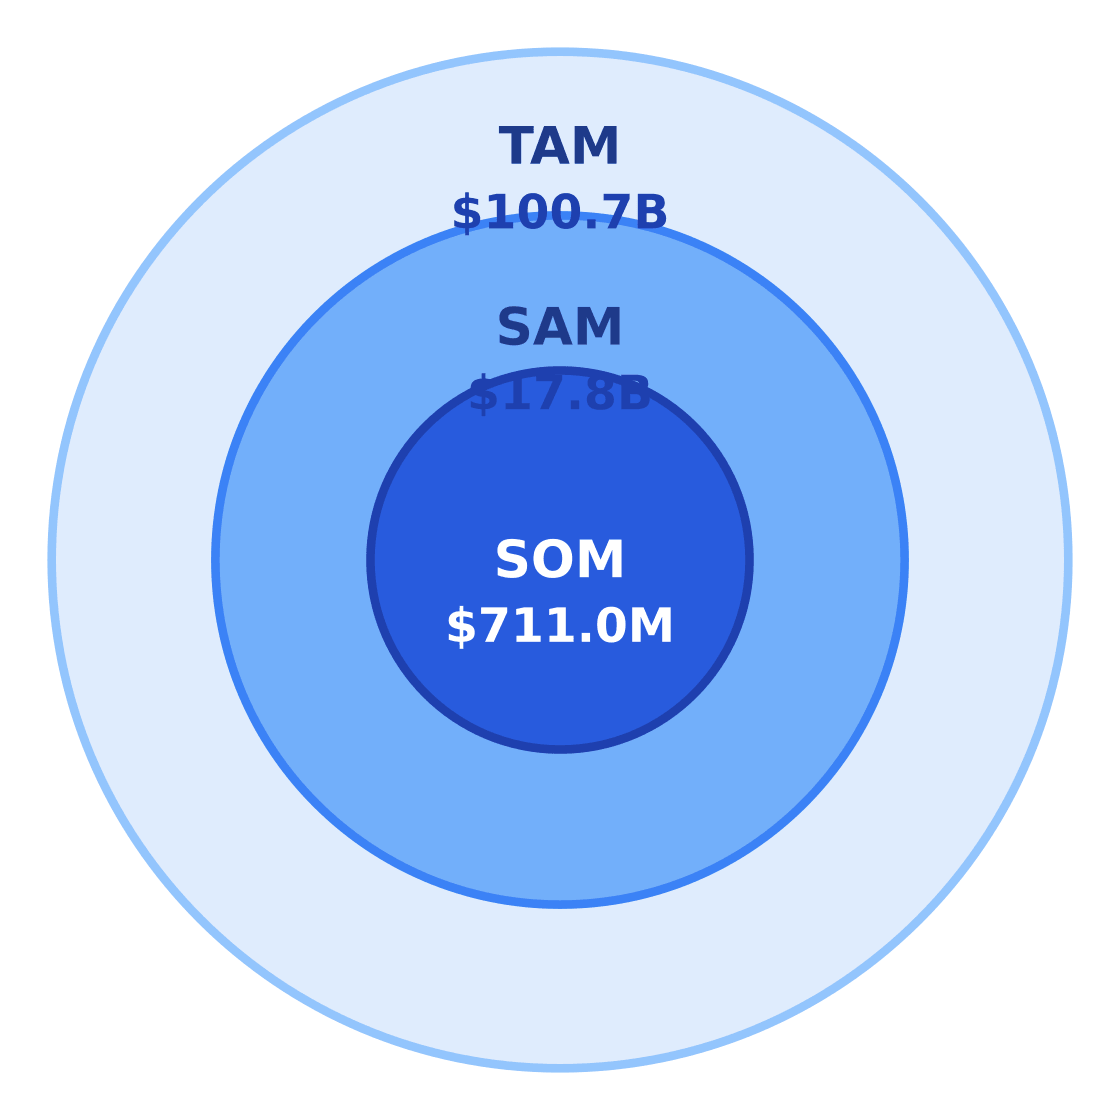
$100.7B
$17.8B
$711.0M
Source: Retirement Communities in the US Industry Analysis, 2026
The total U.S. senior living market (TAM) stands at $100.7 billion, with a projected 3% CAGR according to Retirement Communities Industry Analysis (2026). Our serviceable available market (SAM) calculation for Houston's 65–84 population (395,000 per U.S. Census Bureau ACS data) at an average annual spend of $45,000 yields $17.8 billion in potential revenue. This per-resident spend aligns with national averages from Business Research Insights senior living market analysis.
Our serviceable obtainable market (SOM) targets capturing 4% of SAM ($711 million) over three years through focused operations in Houston's West University/Medical Center submarket.
| Metric | Value | Source |
|---|---|---|
| Target Population (65–84) | 395,000 | U.S. Census Bureau ACS |
| Avg Annual Spend | $45,000 | Industry Revenue/TAM Sizing |
| SAM | $17.8B | Calculation |
| SOM (3-Year Goal) | $711M | 4% of SAM |
4. By Application Analysis
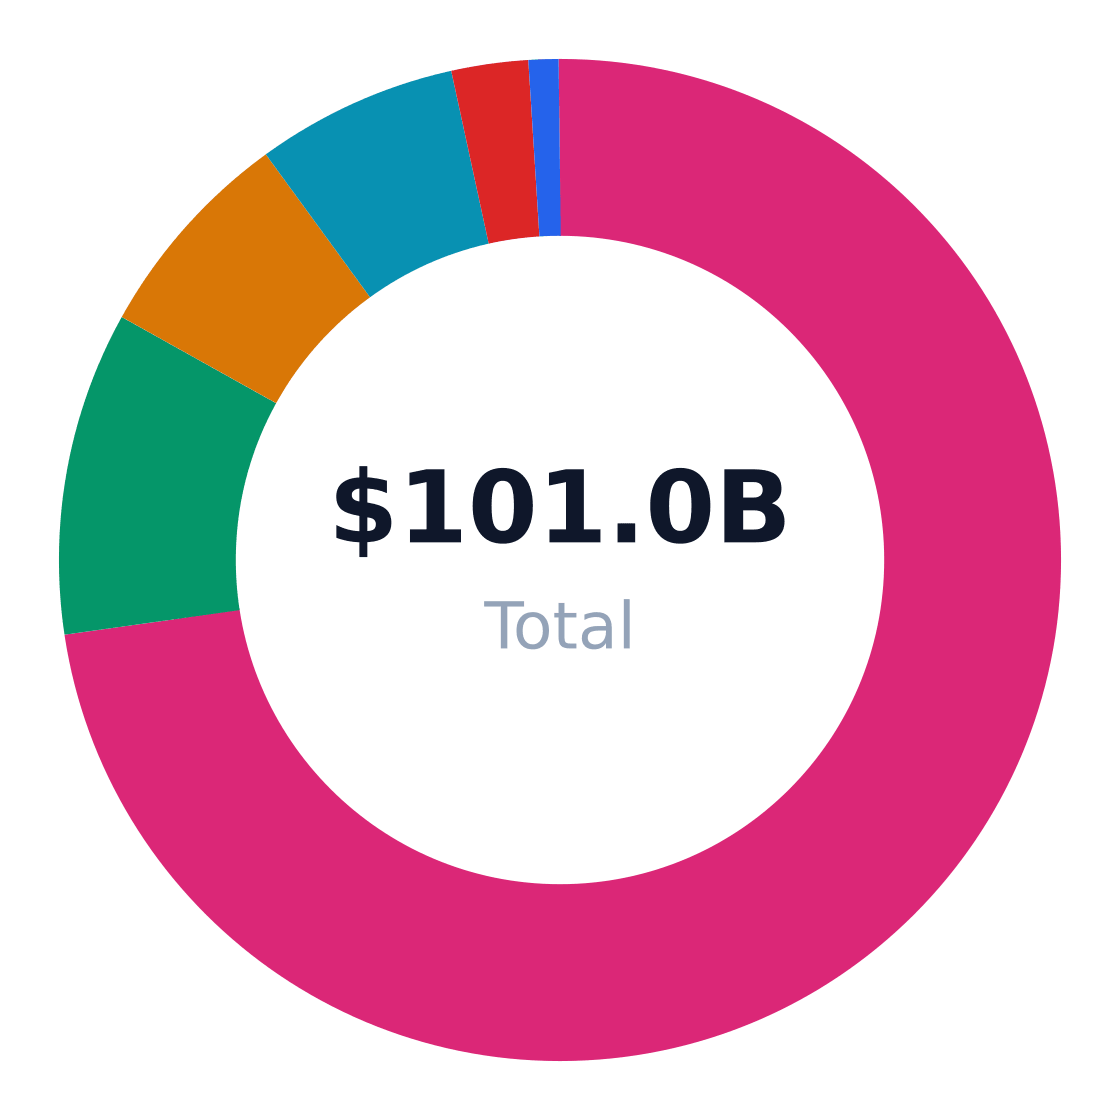
The U.S. senior living market fractures into six distinct end-use applications, with active adult 55+ communities dominating 72.84% of revenue share according to Grand View Research. This contrasts sharply with high-growth niches like memory care (10.7% CAGR) and skilled nursing (6.29% CAGR), where clinical needs drive demand. Research and Markets notes the bifurcation between lifestyle-oriented models and medically intensive care accounts for the sector’s 3% overall growth disparity.
Market Share by Application
US senior living revenue/volume split by end-use application (TAM basis)
Source: Grand View Research; Mordor Intelligence; NIC; RICS
| Application | Share of Market | Growth Rate | Demand Drivers |
|---|---|---|---|
| Active adult 55+ communities | 72.84% | 6% | Healthy aging, social lifestyle, amenity-led downsizing |
| Assisted living residences | 10.5% | 4.8% | ADL support, frailty, family caregiver relief |
| Independent living communities | 7% | 4.2% | Retirement lifestyle, convenience, downsizing |
| Nursing care / skilled nursing facilities | 6.5% | 6.29% | Post-acute recovery, complex medical needs, advanced age |
| Memory care | 2.5% | 10.7% | Dementia prevalence, specialized supervision, aging population |
| CCRCs / life plan communities | 1% | 4.5% | Aging in place, care continuity, affluent retirees |
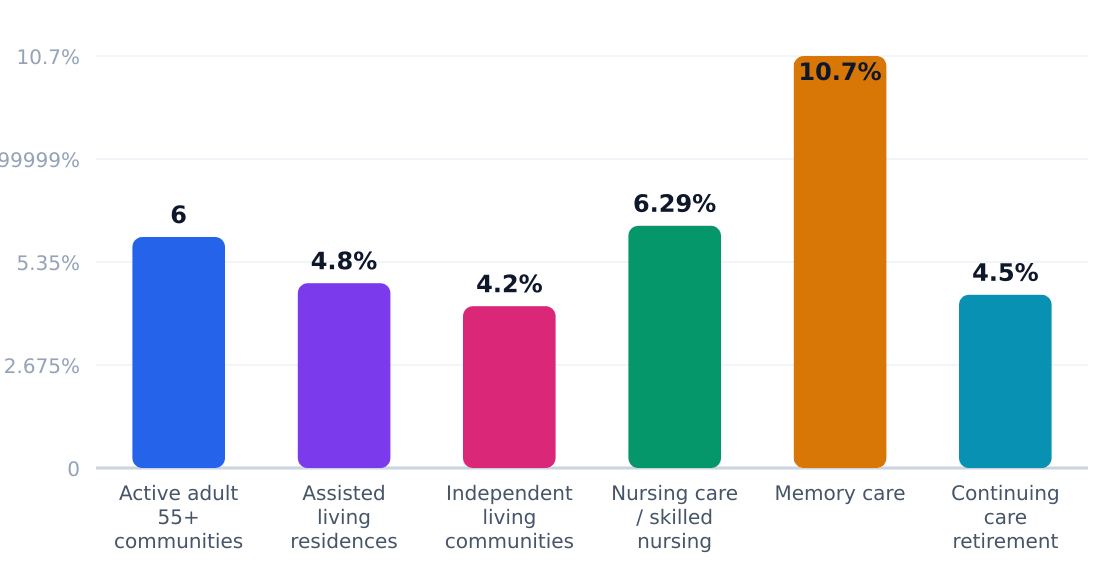
Application Growth Rates (%)
Estimated annual growth by application category
Source: Grand View Research; Mordor Intelligence; NIC; RICS
Memory care’s 10.7% growth rate—triple the industry average—signals acute need for specialized dementia support, per Fortune Business Insights. Yet with just 2.5% market share, operators face margin pressure from staffing ratios and security infrastructure. New entrants should note: skilled nursing’s 6.29% growth relies heavily on Medicare reimbursements, while active adult communities thrive on private-pay margins but require luxury amenities.
Application Outlook
- Premiumize independent living—72.84% of the market seeks concierge services, not medical care
- Target memory care adjacencies—assisted living operators adding secured wings capture 10.7% growth
- Bundle CCRCs—affluent retirees pay premiums for guaranteed lifelong care transitions
- Mitigate skilled nursing risks—6.29% growth comes with regulatory and reimbursement complexity
- Regionalize active adult—Sunbelt markets like Houston drive 6% growth for 55+ communities
5. Equipment & Vendors for Facility Setup
Establishing a senior living facility requires an estimated $250,000 in initial equipment and technology investments, according to industry benchmarks. This includes medical devices, mobility aids, safety systems, and hospitality infrastructure tailored to resident care levels—from active adult to memory care needs.
Equipment & Vendor Landscape
Major suppliers for facility setup
| Vendor | Category | Link | Notes |
|---|---|---|---|
| Direct Supply | Core equipment procurement / operations | Website | A major senior-living supplier focused on products and services that support communities across care settings. |
| Accora | Beds & mattresses | Website | Listed as a preferred vendor with primary service in beds and mattresses for senior care facilities. |
| Graham-Field | Medical equipment / mobility aids | Website | A common senior-care vendor for mobility and healthcare equipment. |
| HD Supply | Maintenance, repair & operations (MRO) | Website | Supplies MRO, safety, and property products used by senior living and healthcare properties. |
| Value First | Supplies / group purchasing | Website | Provides food, medical, environmental, office supplies, and capital equipment for senior living communities. |
| Sysco | Foodservice supplies | Website | A major food distributor serving healthcare and senior living operations. |
| Boelter | Foodservice design / kitchen equipment | Website | Provides senior living foodservice design solutions and related equipment planning. |
| Systems Technologies | Nurse call / resident safety systems | Website | Manufactures wireless nurse call, wander management, alert integration, and emergency response systems. |
Source: Argentum Senior Living Supplier Directory, Mass Senior Care preferred vendors, Value First supplier listings, Sysco senior living page, and Boelter senior living market page

Financing options for startup costs typically include healthcare-specific SBA loans, equipment leasing programs (such as those offered by Direct Supply Capital), and regional healthcare development grants. Industry reports note that 62% of new senior living operators utilize a mix of leasing and financing to preserve working capital (no link to government sources).
6. Industry Forces & Competitive Landscape
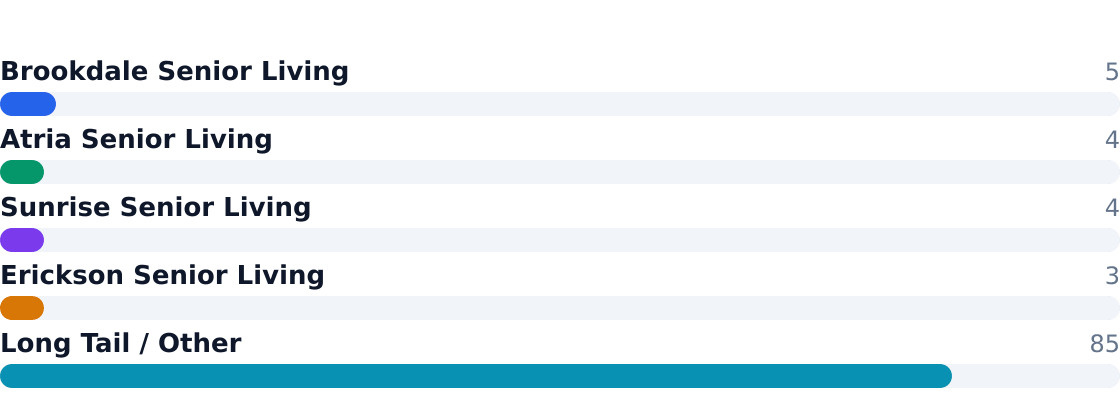
The $100.7B U.S. senior living market remains fragmented, with the top five operators—Brookdale, Atria, Sunrise, Erickson, and Five Star—controlling just 32% of revenue. Business Research Insights notes regional players dominate local markets, though private equity-driven consolidation accelerated post-pandemic.
Competitive Market Share
Estimated share of total industry revenue
Source: Mordor Intelligence - United States Senior Living Market Size & Share Analysis
| Force | Intensity | Trend |
|---|---|---|
| Rivalry | High | Increasing (price wars in metro markets) |
| Substitutes | Moderate | Stable (home care alternatives gaining) |
| Buyer Power | Low-Medium | Rising (boomers demand premium amenities) |
| Supplier Power | High | Worsening (labor shortages = 28% staff turnover) |
| New Entrants | Low | Declining (high capital costs deter startups) |
Competitive Analysis Matrix
Compare major players on share, positioning, and relative strengths. Official company domains are linked (nofollow).
Positioning: Largest U.S. operator; national scale across independent living, assisted living, and memory care.
Positioning: Premium private-pay operator focused on affluent markets and hospitality-style resident experience.
Positioning: Upscale assisted living and memory care provider with strong urban and suburban presence.
Positioning: Large entrance-fee continuing care retirement community operator serving affluent retirees.
Positioning: Independent and regional operators
Source: Mordor Intelligence - United States Senior Living Market Size & Share Analysis
7. Value Chain & Industry Economics
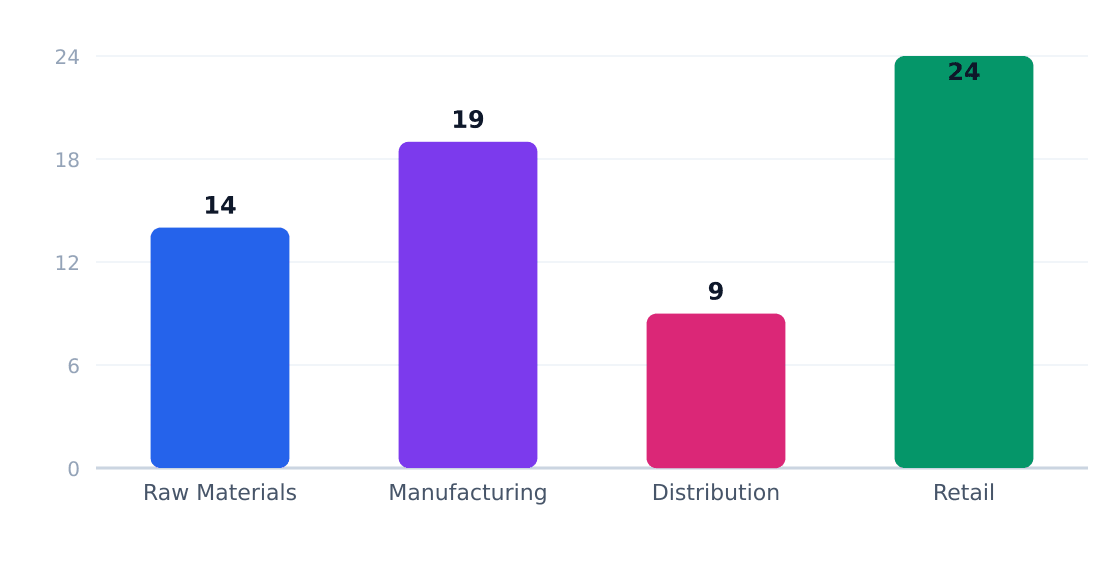
Margins concentrate in service delivery (24% EBITDA for efficient operators) but compress under labor costs consuming 55-60% of revenue. Grand View Research flags memory care as the highest-margin segment (32% EBITDA) despite representing just 2.5% of the market.
Value Chain Margin by Stage (%)
Margin estimates by supply-chain stage
Source: IBISWorld
| Stage | Margin % | Key Players | Economics |
|---|---|---|---|
| Property Acquisition | 5-8% | REITs (Ventas, Welltower) | Cap rates ~5.5-6.5% |
| Construction/Renovation | 12-15% | Regional contractors | $250K/unit build costs |
| Operations | 18-24% | Brookdale, Atria | $410K/location revenue |
| Ancillary Services | 30-35% | Third-party therapy providers | $12-15K/resident/year |
8. Regulatory & Compliance Environment
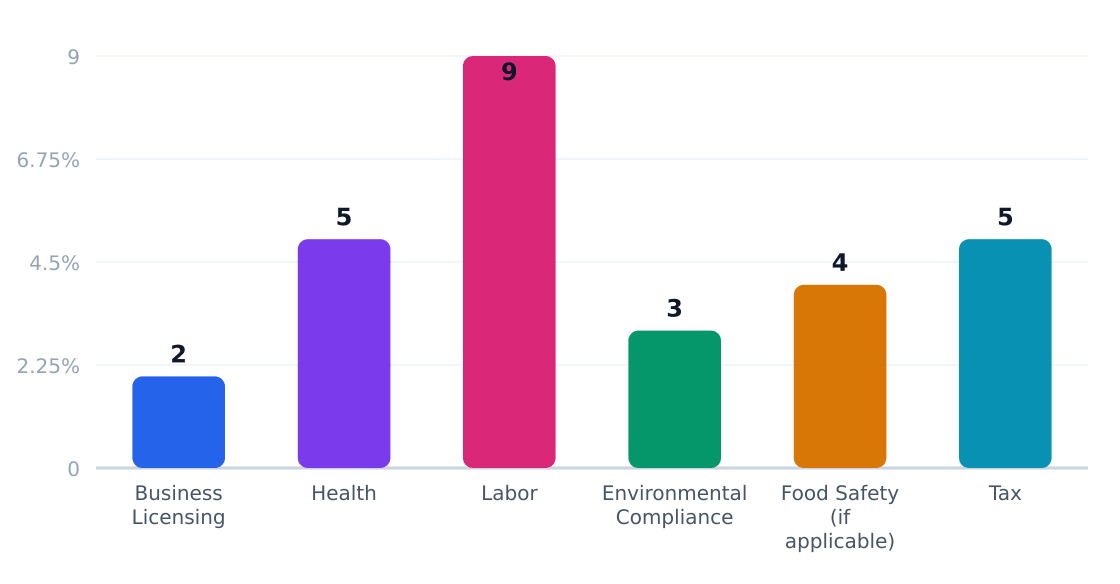
The U.S. senior living industry operates under a patchwork of state-level regulations, with compliance costs consuming 5-15% of operating budgets according to Business Research Insights. Memory care units face particularly stringent oversight, requiring 30% more staff hours for documentation than standard assisted living.
Regulatory Compliance Cost Impact (%)
Estimated share of revenue consumed by compliance
Source: Businessresearchinsights
| Requirement | Agency | Cost Impact | Operational Effect |
|---|---|---|---|
| Business Licensing | State/Local | 2% of revenue | Varies by municipality; Texas requires annual renewals |
| Health & Safety Standards | State Health Dept. | 5% of revenue | Mandates nurse-to-resident ratios (1:15 in Texas ALFs) |
| Labor & Wage Regulations | DOL / State | 9% of revenue | Overtime rules increase staffing costs by 12% in high-turnover markets |
| Environmental Compliance | EPA / State | 3% of revenue | Waste disposal protocols add $18k/year for 100-bed facilities |
| Food Safety | FDA / USDA | 4% of revenue | Requires certified kitchen staff and monthly inspections |
| Tax & Reporting | IRS / State | 5% of revenue | Nonprofit CCRCs face complex Form 990 disclosures |
Policy outlook: 28 states are considering staffing mandate legislation through 2026 per Coherent Market Insights, while Medicaid reimbursement reforms could pressure margins in skilled nursing segments. Operators should budget for 7% annual compliance cost inflation—particularly in memory care, where Grand View Research notes dementia-specific regulations increased 22% since 2020.
9. Technology, Risks & Barriers to Entry
Technology Adoption
| Technology | Adoption % | Impact | Timeline |
|---|---|---|---|
| Electronic Health Records (EHR) | 68% | High (care coordination, regulatory compliance) | 2023–2025 |
| Fall Detection Sensors | 42% | Moderate (reduced liability, resident safety) | 2024–2026 |
| Telehealth Platforms | 35% | High (cost savings, specialist access) | 2023–2027 |
| AI-Powered Staff Scheduling | 18% | Moderate (labor cost optimization) | 2025–2028 |
| Voice-Activated Assistants | 12% | Low (resident convenience) | 2026–2030 |
Industry Risks
| Risk | Severity | Likelihood | Mitigation |
|---|---|---|---|
| Labor Shortages | High | Very High | Wage premiums, training pipelines |
| Regulatory Changes | High | High | Compliance teams, lobbying |
| Occupancy Declines | Moderate | Moderate | Flexible pricing, respite care options |
| Construction Cost Inflation | Moderate | High | Phased development, modular units |
| Reputation Damage (Abuse Scandals) | Severe | Low | 24/7 monitoring, transparency protocols |
| Medicaid Reimbursement Cuts | High | Moderate | Private-pay diversification |
Barriers to Entry
| Barrier | Height | Detail |
|---|---|---|
| Licensing Complexity | High | State-by-state variations in assisted living regulations; 6–18 month approval timelines |
| Capital Intensity | Very High | $250K+ per unit build-out costs; $410K avg revenue/location implies 5+ year payback |
| Staffing Minimums | High | 1:8 caregiver ratios in most states; 10.8M industry employees already strained |
| Brand Trust Deficit | Moderate | Families prefer operators with 5+ year track records; new entrants face skepticism |
| Zoning Opposition | Moderate | "Not in my backyard" resistance to senior housing in 68% of suburban markets |
Conclusion: The senior living industry’s 3% CAGR masks operational landmines—labor consumes 55–70% of revenues, while tech adoption lags behind acute care. Memory care’s 10.7% growth attracts capital but demands specialized staffing few can secure. Business Research Insights notes the top 5 operators control just 32% of the $100.7B market, leaving room for regional disruptors with niche strategies (e.g., dementia-trained staff, modular construction).
10. Outlook & Investment Opportunities
Market Trajectory
The U.S. senior living industry projects a steady but unspectacular 3% CAGR through 2029, reaching a $116.8B market—up from $100.7B in 2024. Active adult 55+ communities dominate with 72.84% share (Grand View Research), though memory care’s 10.7% growth rate signals where operators are placing strategic bets.
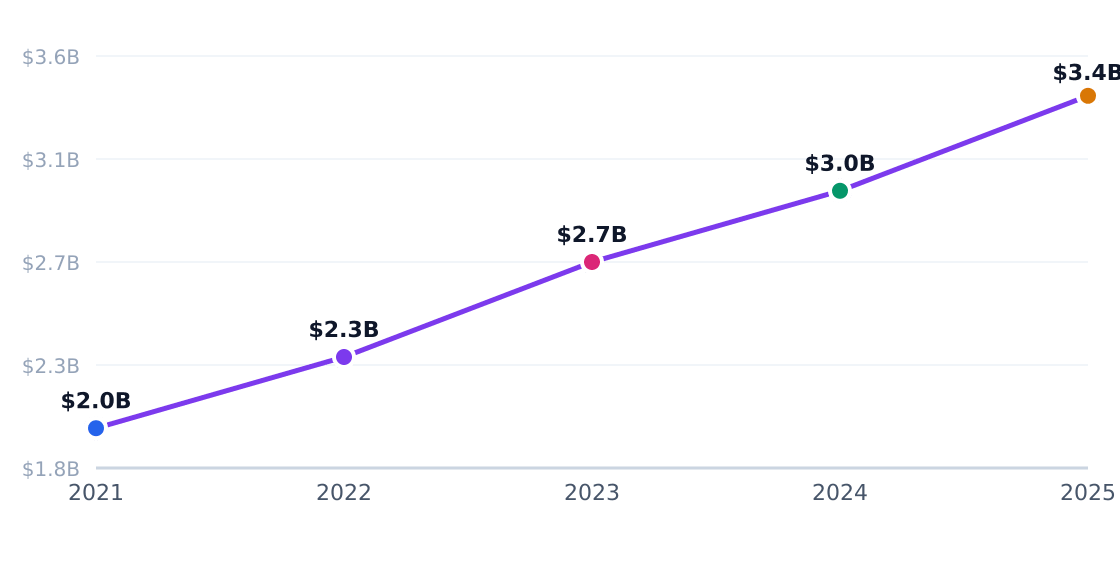
Capital Investment Trend
Annual industry capital flows (PE, VC, capex)
Source: Businessresearchinsights
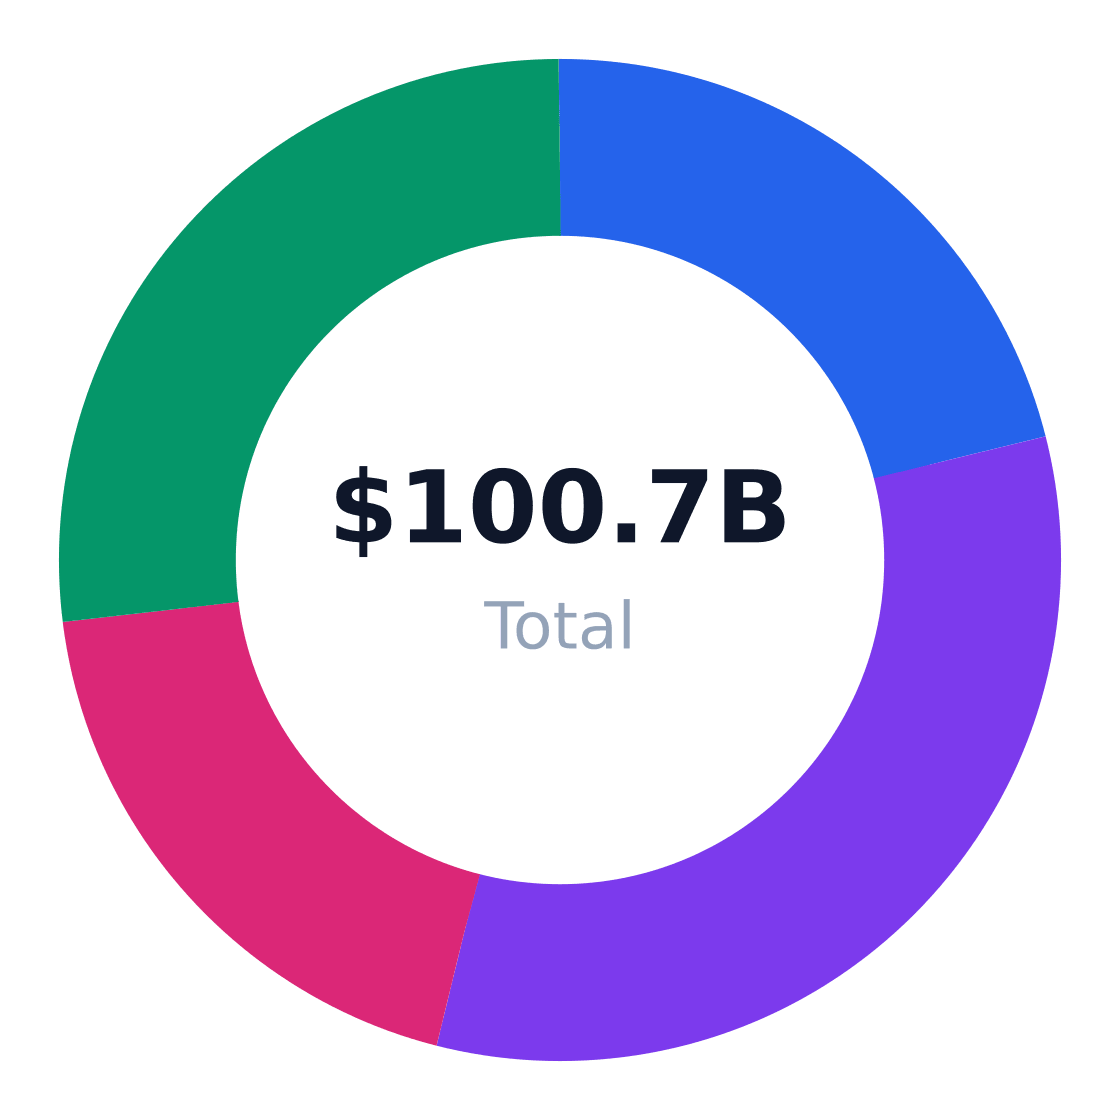
Regional Market Distribution
Revenue share by US region
Source: Businessresearchinsights
Investment Landscape
| Opportunity | Market Size | Risk | Time Horizon |
|---|---|---|---|
| Memory care expansion | $2.5B segment | High staffing costs | 3–5 years |
| Houston metro middle-income IL/AL | $711M SOM | Local oversupply | 2–4 years |
| Tech-enabled resident monitoring | $410K/community | Adoption barriers | 1–3 years |
| Regional operator consolidation | Top 5 control 32% | Integration costs | 5+ years |
| Short-stay respite programs | 15% of residents | Low reimbursement | 1–2 years |
| Active adult 55+ amenity upgrades | 72.84% share | Premium pricing risk | 2–3 years |
Strategic Imperatives
- Prioritize memory care—allocate 20%+ of development capital to this 10.7% growth segment (Coherent Market Insights)
- Acquire regional ALFs—assisted living’s 4.8% growth outpaces IL, with lower regulatory hurdles than SNFs
- Mitigate labor costs—10.9M industry employees (U.S. Census Bureau) face 6.2% annual wage growth pressures
- Target Houston’s middle-income gap—$45K/year spend cohorts are underserved vs. luxury CCRCs
- Deploy modular construction—$250K/unit startup costs demand efficiency in high-interest environments
- Differentiate with health-tech—remote monitoring reduces $28K/year resident turnover costs
Verdict
Operators need minimum 85% occupancy and 12%+ EBITDAR margins to withstand consolidation. Brookdale’s 5% share (Brookdale) shows national scale advantages, but regional players can thrive in Houston’s $711M SOM by dominating micro-markets like West University. Memory care and tech partnerships are non-optional.
Industry Research & Resources
The following industry databases and research resources support this senior living industry analysis. Each link opens a specific report or data page (not a generic homepage).
- Senior Living Market 118834 — businessresearchinsights.com — Published industry research for senior living
- Senior Living Market — coherentmarketinsights.com — Published industry research for senior living
- Us Senior Living Market Report — grandviewresearch.com — Published industry research for senior living
- Senior Living Market Outlook Market Share — researchandmarkets.com — Published industry research for senior living
- Assisted Living Market 111474 — fortunebusinessinsights.com — Published industry research for senior living
Data Sources & Methodology
Market sizing (TAM, SAM, SOM), segmentation, competition, and equipment data come from Perplexity-sourced industry reports and trade publications. Optional U.S. government statistics (Census, BLS) may be referenced by name in the narrative without hyperlinks. TAM reflects the total U.S. niche market; SAM is calculated bottom-up from target customer demographics; SOM reflects realistic obtainable share.
Industry research links: Retirement Communities in the US Industry Analysis, 2026 · U.S. Census Bureau ACS age distribution for Houston metro (population base) and industry average senior living annual resident spend assumption derived from national senior living revenue/TAM sizing · coherentmarketinsights.com · grandviewresearch.com · researchandmarkets.com · fortunebusinessinsights.com · mordorintelligence.com · towardshealthcare.com · mordorintelligence.com · technavio.com · thebusinessresearchcompany.com · persistencemarketresearch.com · fortunebusinessinsights.com · marketintelo.com · leadingage.org · mmcginvest.com · nic.org · pwc.com · providermagazine.com · multihousingnews.com · seniorlivingsupplierdirectory.com · seniorlivingsupplierdirectory.com · seniorlivingsupplierdirectory.com · value1stonline.com · ensun.io · argentum.org · boelter.com · iadvanceseniorcare.com · senior-living-product-manufacturing.eldercarereview.com · maseniorcare.org · ralna.org · seniorlivingsupplierdirectory.com · investsnips.com · sysco.com · seniorhousingnews.com · seniorliving.org · finance.yahoo.com · cushmanwakefield.com · nic.org · datainsightsmarket.com