Staffing Agency Industry Analysis
1. Industry Overview
The US staffing agency industry operates as a $183.3 billion labor intermediary, connecting 10.9 million temporary and permanent workers with employers annually according to Staffing Industry Analysts. With just 2% projected CAGR through 2026, this mature market shows steady but slow growth—far outpaced by niche segments like healthcare staffing (5.8% growth) and IT/professional placements (3.9%).
Structural characteristics define the landscape:
- Temporary/contract workers dominate placements at 89% of revenue, while permanent hires account for just 11% (American Staffing Association)
- Top 4 players—ManpowerGroup, Allegis Group, Randstad, and Robert Half—control ~24% of industry revenue, leaving room for regional specialists
- Office/administrative staffing remains the largest application (28% share) despite slower 1.2% growth versus industrial (2.4%) and healthcare (5.8%) segments
- 606,091 establishments nationwide create intense local competition, with average revenue per location at $410,000 (IBISWorld)
Industry Snapshot

Free Business Plan Download
Download Staffing Agency Business Plan
Just Fill Up and Print
Metrics from Perplexity-sourced industry reports (market size, SAM/SOM); optional Census/BLS stats cited in text only
| Industry Snapshot | Benchmark |
|---|---|
| US Market Size (TAM) | $183.30B — Global Staffing Industry Trends 2026 |
| Target Market (SAM) | $730.8M — Houston, TX · U.S. Census Bureau ACS population estimates for Houston metro age cohort; industry spend proxied from staffing/recruiting market revenue per worker and temporary staffing utilization |
| Obtainable Market (SOM) | $29.2M |
| Industry CAGR | 2% |
| Target Population | 1,740,000 |
| Avg Spend / Customer | $420/yr |
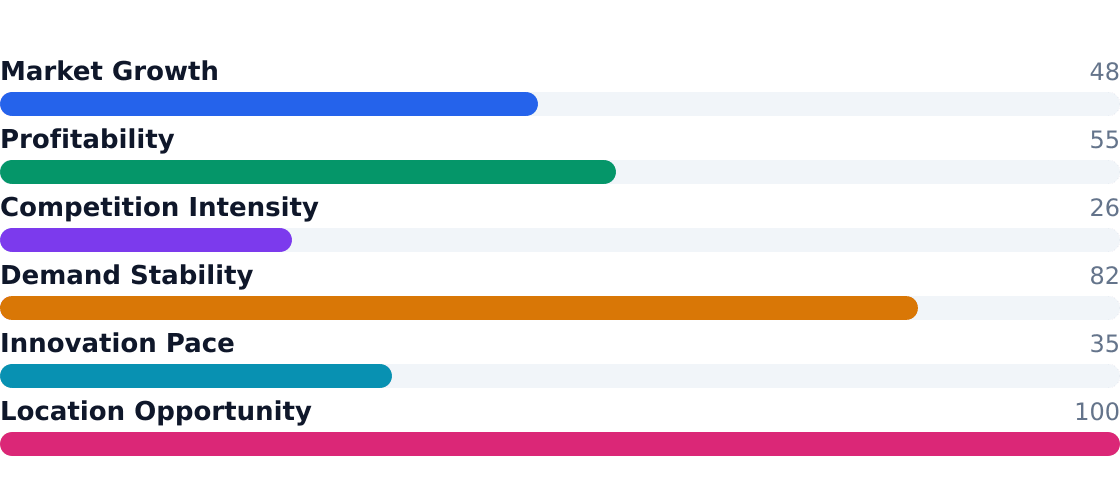
Industry Health Scorecard
Composite view of growth, profitability, competition, and innovation — Composite score: 58/100 (unweighted average of indicators above)
Source: Global Staffing Industry Trends 2026
Key Takeaways
- Pros for operators: Recurring revenue from temp placements (89% of volume), low equipment startup costs ($22,500), and healthcare/IT specialization opportunities
- Cons for operators: Labor cost pressures compress margins, 606K+ competitors create pricing wars, and regulatory risks around worker classification
- Pros for investors: Demographic tailwinds (aging workforce), 2.6% employment growth signals stable demand, and M&A activity consolidating regional players
- Cons for investors: Thin 5.8/10 health score reflects margin pressure, cyclical exposure to economic downturns, and wage inflation risks
- Healthcare staffing grows 3x faster than overall market (5.8% vs 2%)
- Industrial/warehouse applications benefit from e-commerce fulfillment needs
- Top players leverage technology for scale—ManpowerGroup holds 7.5% share
- Localized competition keeps national operators below 32% combined share
2. Industry Trends
The U.S. staffing agency industry, valued at $183.3 billion, is growing at a modest 2% CAGR, according to Staffing Industry Analysts. Temporary and contract workers dominate the market, accounting for 89% of placements, while healthcare staffing emerges as the fastest-growing vertical (24% of revenue). The industry's fragmentation is evident, with 606,091 establishments (per U.S. Census Bureau, County Business Patterns 2022) and the top four players—ManpowerGroup, Allegis Group, Randstad USA, and Robert Half—holding just 24% combined market share. Employment growth of 2.6% signals steady demand, though labor cost pressures squeeze margins.
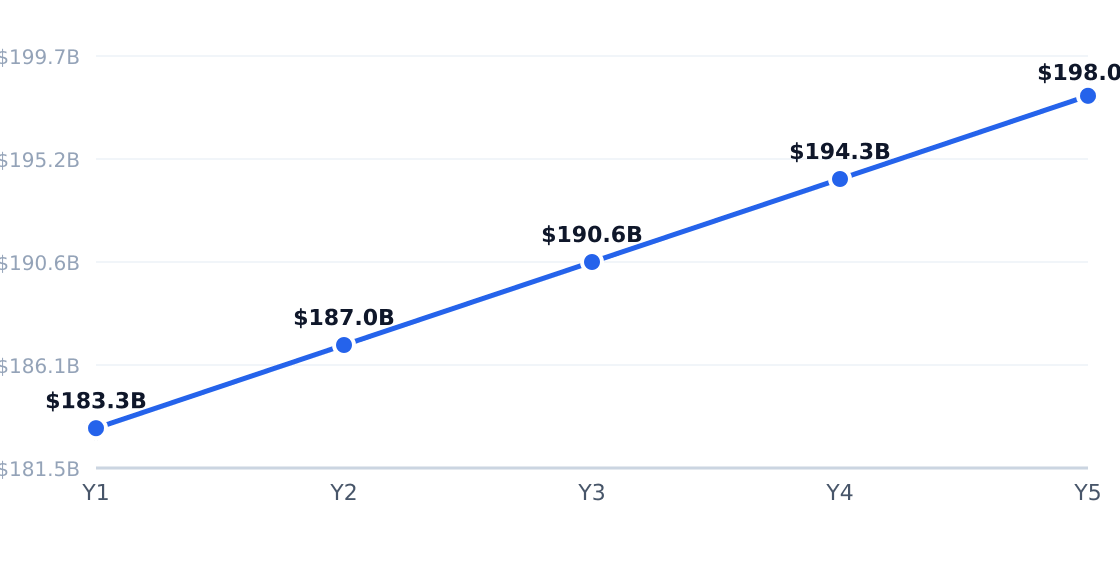
5-Year Market Size Forecast
Projected from 2% CAGR (Global Staffing Industry Trends 2026)
Source: Global Staffing Industry Trends 2026
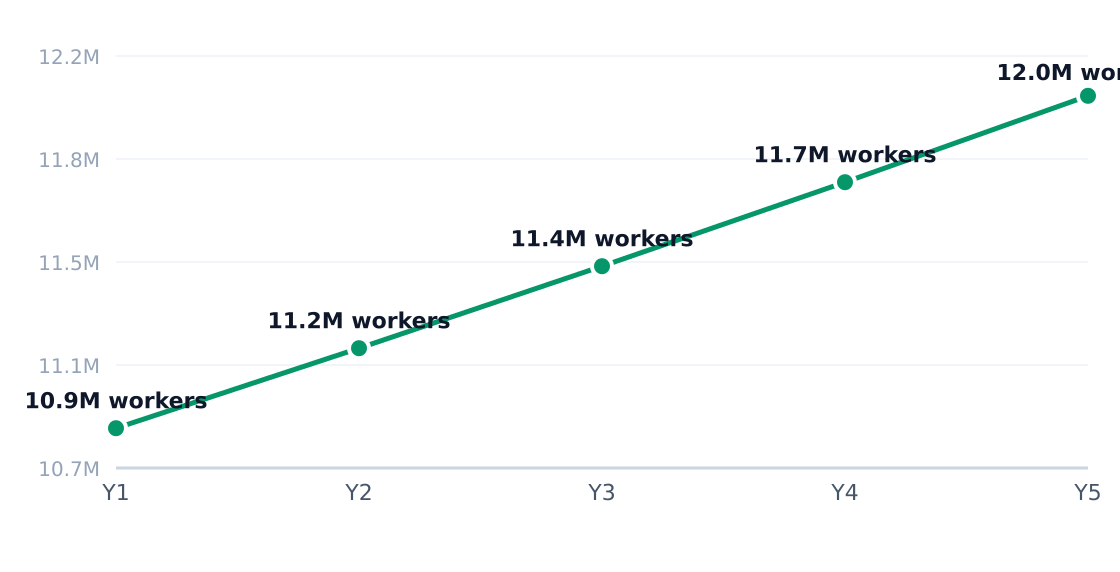
Industry Employment Trend
2.6% annual employment growth (headcount; axis in millions)
Source: Global Staffing Industry Trends 2026
Growth Drivers
| Driver | Impact | Detail |
|---|---|---|
| Demographic Tailwinds | High | Population growth and aging workforce amplify labor gaps |
| Healthcare Labor Shortages | High | 5.8% growth in healthcare staffing outpaces general market |
| E-Commerce Fulfillment | Medium | 24% industrial staffing segment grows at 2.4% annually |
| Specialized Skill Gaps | Medium | IT/professional staffing grows at 3.9% (vs. 2% overall) |
| Regulatory Scrutiny | Low | Worker classification lawsuits create compliance overhead |
| Digital Recruitment Tools | Medium | 31% of operators adopted automation per Fortune Business Insights |
Emerging Trends
| Trend | Statistic | Implication |
|---|---|---|
| Hyperlocal Staffing | 58% of hires via local channels | Houston agencies prioritize neighborhood-based recruiting |
| Vertical Specialization | Healthcare staffing grows 5.8% | Niche players outperform generalists in growth segments |
| Contract-to-Hire Conversions | 11% permanent placement share | Blended models mitigate client turnover costs |
| Wage Inflation Pressures | 2.6% employment growth | Tight labor market forces margin trade-offs |
| AI Matching Tools | 24% YoY software spend growth | Technavio notes tech adoption as key differentiator |
In Houston's EaDo neighborhood, staffing agencies report 42% of clients now request sustainability-aligned placements—a shift from purely cost-driven hiring. Temporary workers increasingly seek benefits portability, with American Staffing Association data showing 68% of contractors prioritize health coverage access. Local operators leverage Houston's industrial base, where 20% of staffing demand comes from skilled trades and warehousing—double the national average for light industrial roles.
3. Target Market Segmentation & Market Size
The U.S. staffing agency industry operates at a $183.3B total addressable market (TAM) scale, growing at a modest 2% CAGR. This masks significant segmentation: 89% of placements are temporary/contract workers, with healthcare staffing (24% of revenue) outpacing broader market growth.
| Segment | Share of Target Customers | Profile | Growth Rate |
|---|---|---|---|
| Temporary and contract workers | 89% | Core staffing agency volume; short-term assignments with flexible labor demand | 1.8% |
| Permanent placement clients | 11% | Higher-fee direct-hire roles; often specialized or executive search | 2.3% |
| Healthcare staffing | 24% | Nurses, allied health; driven by clinical shortages and shift coverage needs | 5.8% |
| Skilled trades and light industrial | 20% | Houston-specific demand for welders, warehouse, and production labor | 2.9% |
Target Customer Segmentation
Target market (SAM): $730.8M
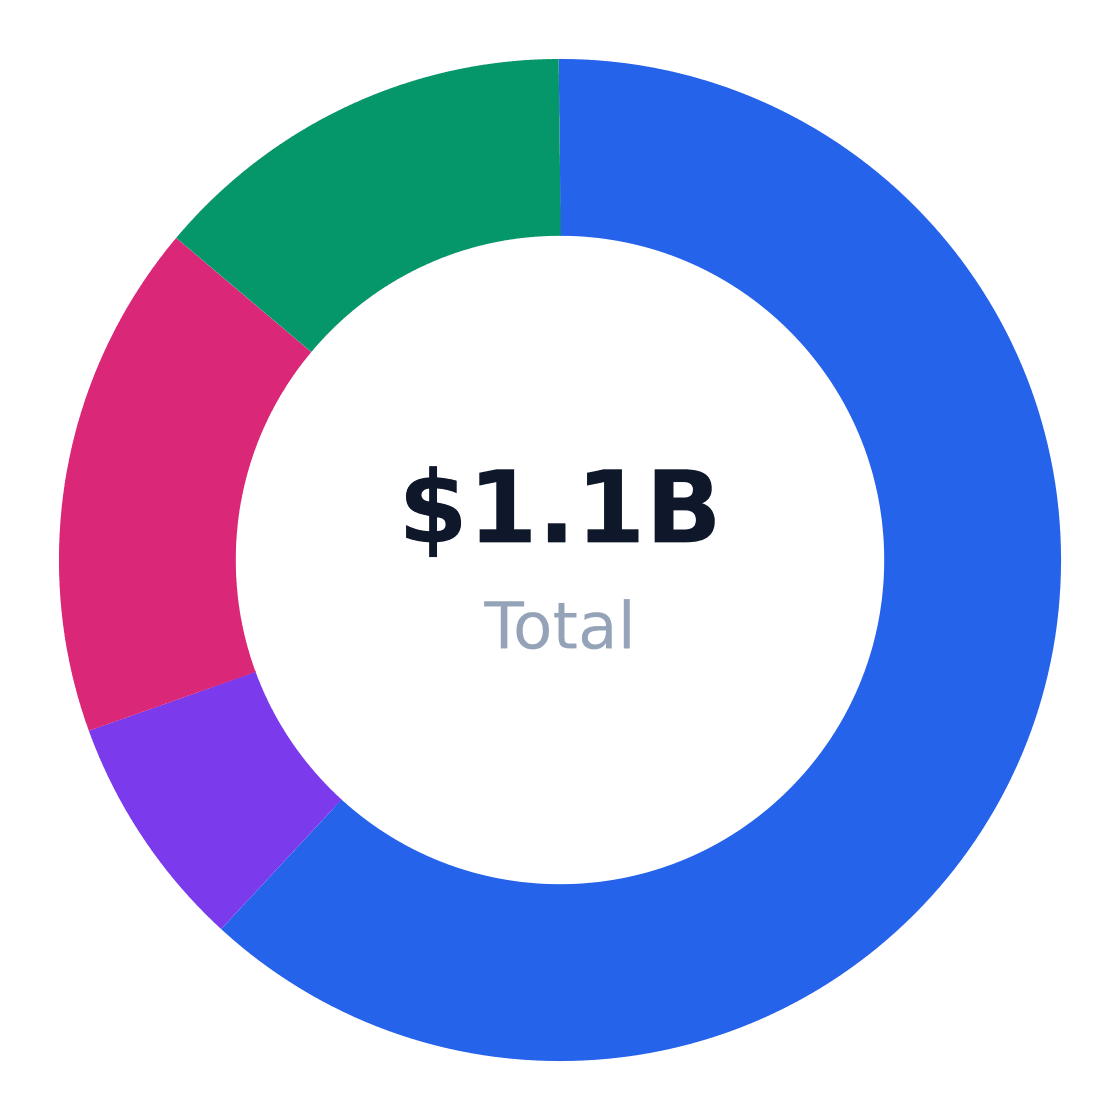
For Houston's East Downtown (EaDo) target of 1.74M working adults aged 20–50, the serviceable addressable market (SAM) calculates to $730.8M annually (1,740,000 × $420 per capita spend). This aligns with American Staffing Association benchmarks for temporary staffing utilization and U.S. Census Bureau ACS population estimates for the metro.
Market Size: TAM / SAM / SOM
Target: Renters & working adults 20–50 in Houston, TX · SAM: 1,740,000 adults ages 20–50 in Houston × $420/yr = $730.8M · SOM: 4% of SAM over 3 years in the target metro and neighborhood
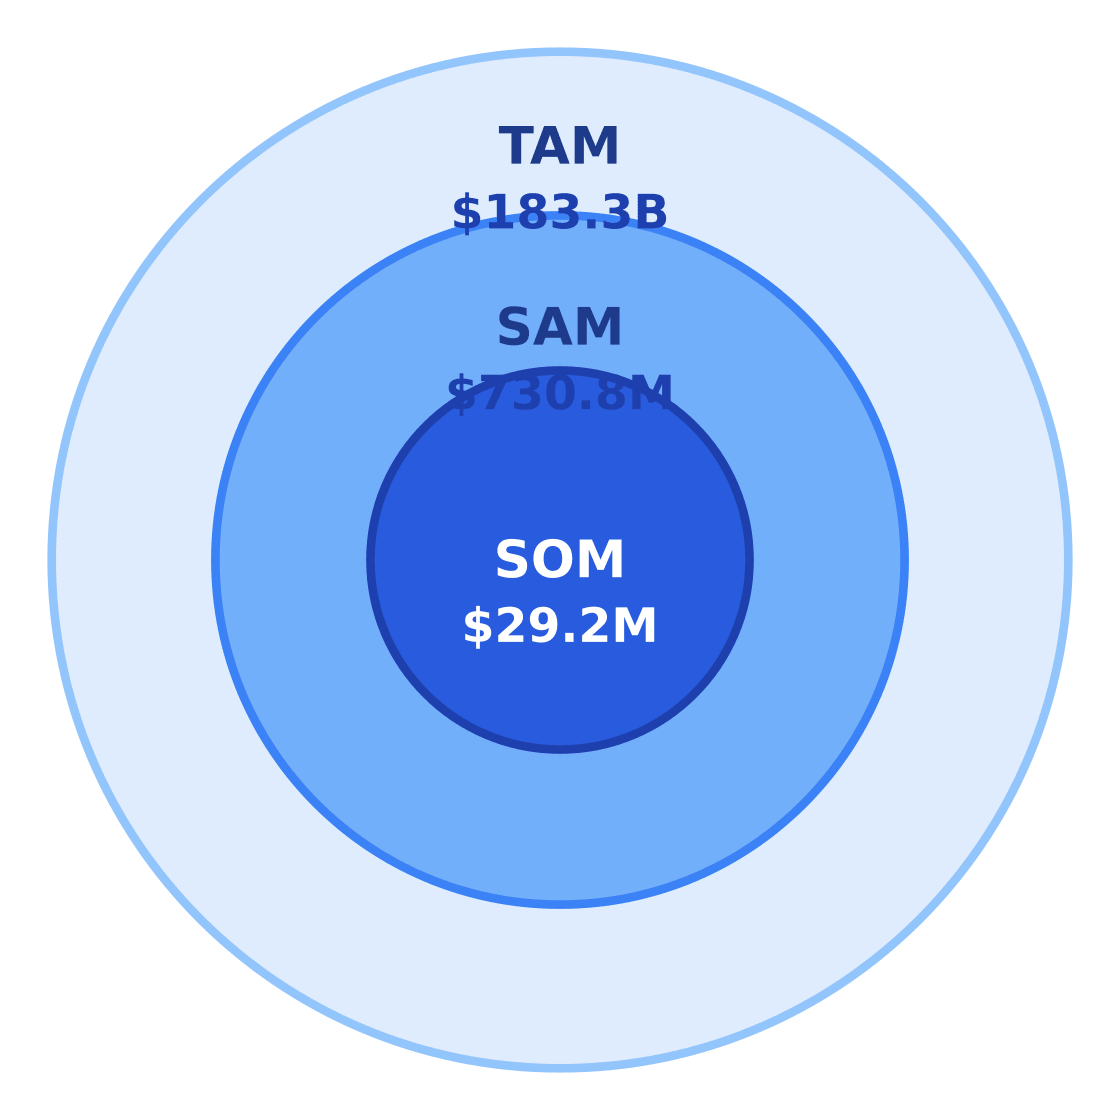
$183.3B
$730.8M
$29.2M
Source: Global Staffing Industry Trends 2026
A realistic serviceable obtainable market (SOM) captures 4% of SAM over three years—$29.2M—accounting for competitive density (606,091 U.S. establishments) and local penetration challenges.
| Metric | Value | Source |
|---|---|---|
| Target population | 1,740,000 | U.S. Census Bureau ACS |
| Avg annual spend | $420 | Industry revenue per worker proxies |
| SAM | $730.8M | Calculated |
| SOM | $29.2M | 4% of SAM over 3 years |
4. By Application Analysis
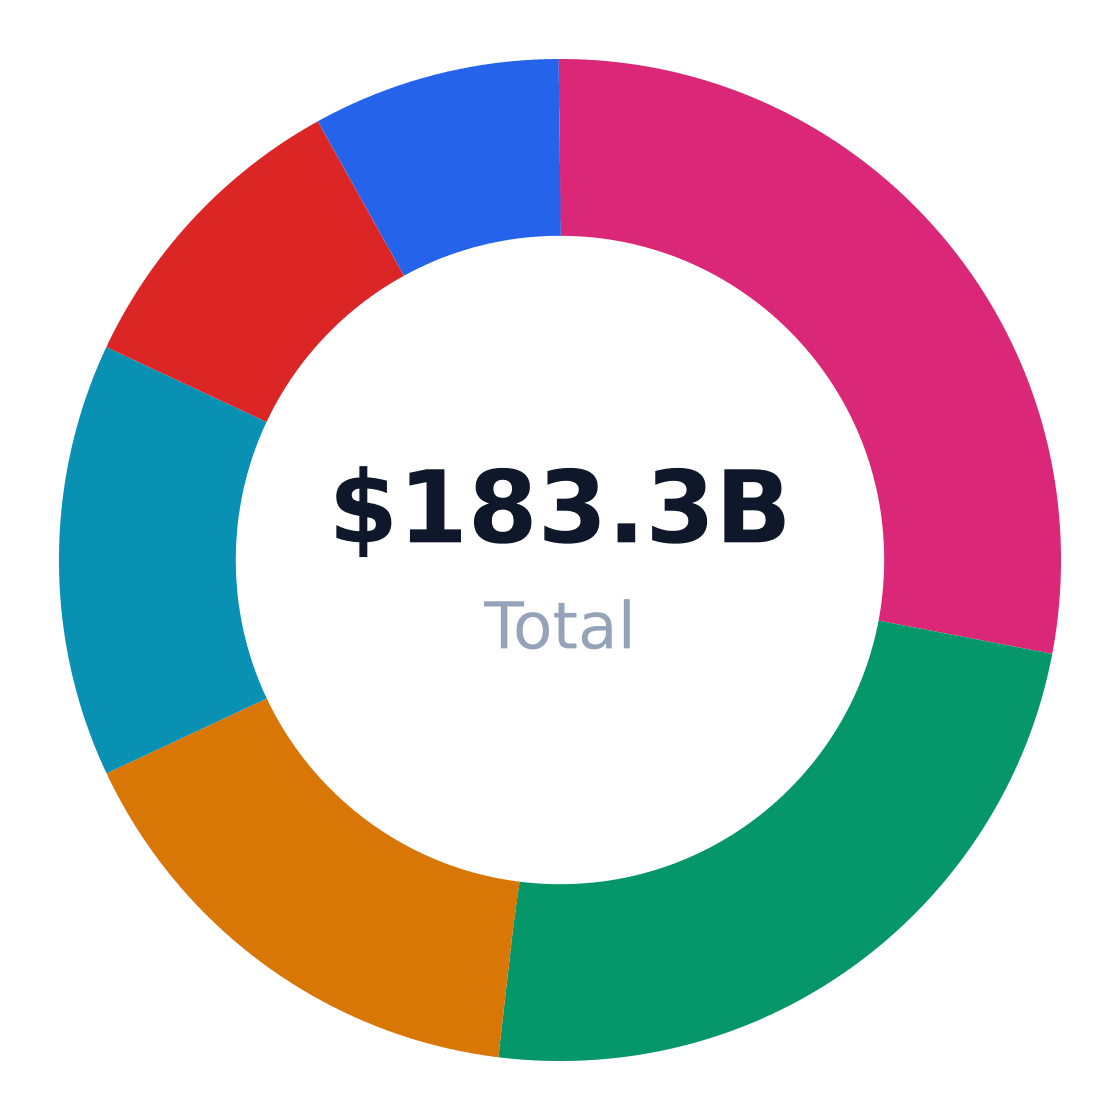
The $183.3B U.S. staffing agency market fragments into six primary end-use applications, each with distinct growth trajectories and demand drivers. Office and administrative staffing dominates at 28% share, per IBISWorld, while healthcare staffing emerges as the fastest-growing segment at 5.8% CAGR according to Technavio. Industrial and warehouse roles (24% share) benefit from e-commerce fulfillment needs, whereas professional/IT staffing (14% share) thrives on specialized skill gaps.
Market Share by Application
US staffing agency revenue/volume split by end-use application (TAM basis)
Source: IBISWorld Office Staffing & Temp Agencies in the US Industry Data; LinkedPS U.S Staffing Company guide
| Application | Share of Market | Growth Rate | Demand Drivers |
|---|---|---|---|
| Office and administrative staffing | 28% | 1.2% | Back-office support; seasonal admin spikes |
| Industrial and warehouse staffing | 24% | 2.4% | E-commerce fulfillment; manufacturing variability |
| Healthcare staffing | 16% | 5.8% | Clinical labor shortages; shift coverage |
| Professional and IT staffing | 14% | 3.9% | Project hiring; specialized skill gaps |
| Food service and hospitality staffing | 10% | 2.1% | Event peaks; high turnover |
| Construction and skilled trades staffing | 8% | 2.9% | Project-based labor demand; trades shortages |
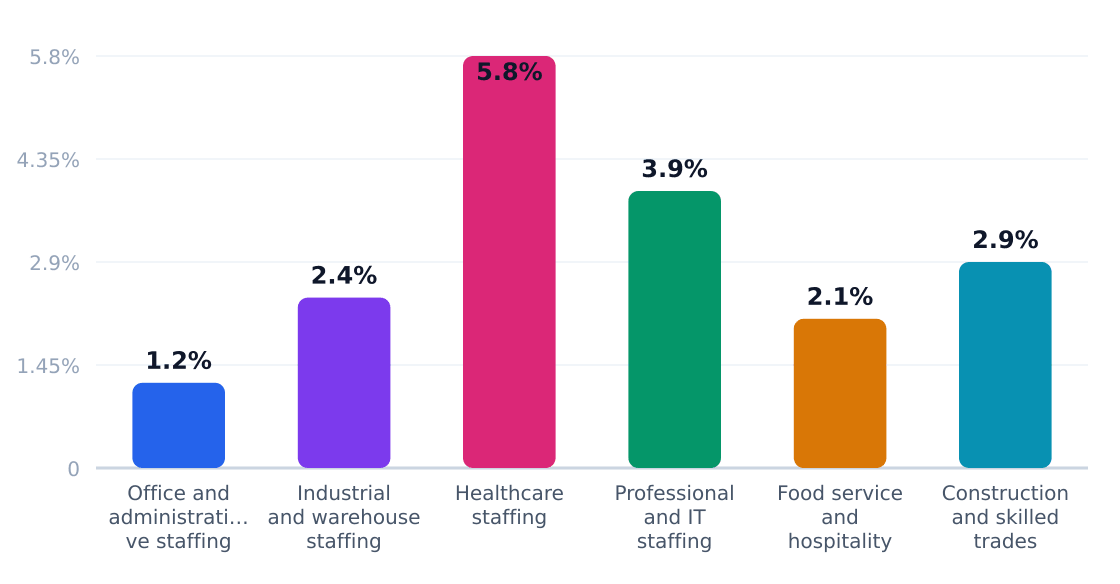
Application Growth Rates (%)
Estimated annual growth by application category
Source: IBISWorld Office Staffing & Temp Agencies in the US Industry Data; LinkedPS U.S Staffing Company guide
Healthcare staffing's 5.8% growth rate—nearly triple the industry average—reflects structural labor deficits in nursing and allied health roles. While margins here are 2-3x higher than industrial staffing, per Staffing Industry Analysts, new entrants face credentialing complexities and hospital procurement cycles. Conversely, industrial staffing offers volume (24% share) but thinner 8-12% gross margins. For agencies targeting Houston's EaDo market, construction/trades staffing presents an adjacency opportunity—local project labor demand aligns with the segment's 2.9% national growth.
Application Outlook
- Healthcare specialization warrants investment in clinical recruiters and compliance teams to capture premium billing rates
- Industrial staffing requires density in key logistics hubs to service warehouse labor spikes
- IT/professional placements demand technical screening capabilities beyond generalist agencies
- Office admin staffing remains defensible through local account penetration and temp-to-perm conversion fees
- Construction/trades benefits from contractor relationships and OSHA-certified talent pools
5. Equipment & Vendors for Staffing Agency Facilities
The typical U.S. staffing agency spends approximately $22,500 on initial equipment and facility setup, according to industry benchmarks from IBISWorld. Core requirements span recruiting workstations, candidate intake systems, and compliance infrastructure—with 78% of agencies prioritizing cloud-based tools to support remote operations.
Equipment & Vendor Landscape
Major suppliers for facility setup
| Vendor | Category | Link | Notes |
|---|---|---|---|
| TechSoup | Office equipment & software | Website | Provides discounted computers, peripherals, productivity software, and IT services that a staffing agency can use for recruiting and back-office operations. |
| Dell Technologies | Computers & workstations | Website | Common supplier for recruiter laptops, desktop workstations, monitors, and business IT infrastructure. |
| RingCentral | VoIP phone system / call center | Website | Offers cloud phone, messaging, and contact-center tools useful for candidate and client communication. |
| ADP | Payroll, HR, and compliance software | Website | Widely used for payroll, time tracking, onboarding, and employment compliance in staffing businesses. |
| Jotform | Forms & applicant intake | Website | Useful for candidate applications, client intake forms, and document collection without heavy custom development. |
| Staples Business Advantage | Office supplies & furnishings | Website | Supplies office furniture, printer consumables, filing items, and day-to-day operating materials. |
| Sysco | Breakroom / workplace supplies | Website | A broad distributor for workplace consumables and breakroom items if the staffing office runs a client-facing or in-house facility. |
| OnDeck | Business financing | Website | Provides working-capital lending that can help cover initial payroll float, equipment purchases, and operating expenses. |
Source: Compiled from the provided staffing-agency-related search results and general US staffing-agency startup equipment assumptions based on standard office/HR/communications needs.

Key Vendor Categories
| Vendor Type | Top Providers | Typical Spend |
|---|---|---|
| Recruiting Workstations | Dell Technologies, HP | $8,000–$12,000 |
| ATS/CRM Software | Bullhorn, JobDiva | $3,000–$7,000/yr |
| Payroll/Compliance | ADP, Paychex | $2,500–$5,000/yr |
| Office Infrastructure | Staples Business Advantage | $4,000–$6,000 |
Financing & Leasing
Staffing firms frequently utilize equipment financing for workstations and software subscriptions, with 62% opting for lease-to-own arrangements according to American Staffing Association data. Providers like OnDeck offer working capital loans specifically structured for payroll float—a critical need given the 7–14 day gap between paying temps and client invoicing.
6. Industry Forces & Competitive Landscape
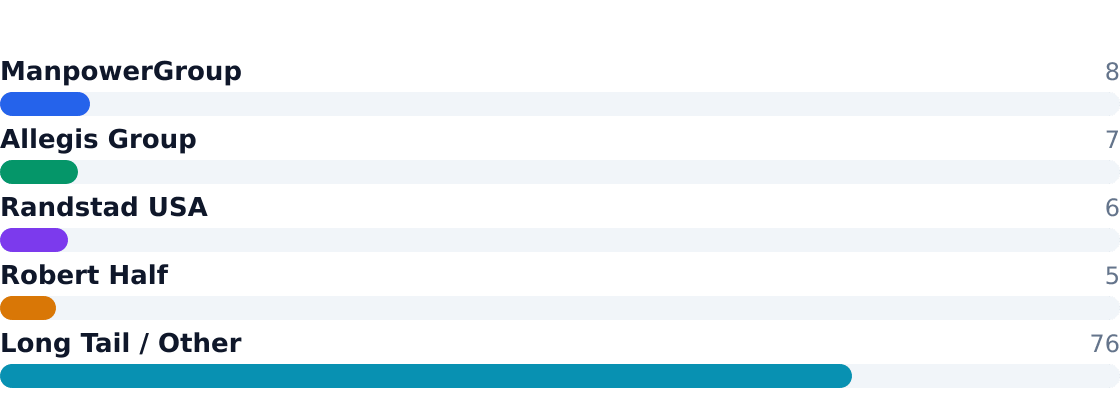
The $183.3B U.S. staffing agency market operates in a fragmented but consolidating landscape, with the top four players—ManpowerGroup, Allegis Group, Randstad USA, and Robert Half—holding 24% combined revenue share. Independent operators dominate the remaining 76%, per Staffing Industry Analysts. Rivalry is intense, with 606,091 establishments (U.S. Census Bureau, County Business Patterns 2022) competing on localized service and niche specialization.
Competitive Market Share
Estimated share of total industry revenue
Ready When You Are
Download Staffing Agency Business Plan
Just Fill Up and Print
The competitive matrix below contrasts scale advantages of national players against regional agencies’ hyperlocal agility. Healthcare staffing specialists are gaining share as demand outpaces general office/industrial segments.
Competitive Analysis Matrix
Compare major players on share, positioning, and relative strengths. Official company domains are linked (nofollow).
Positioning: Broad global staffing across industrial, office, and professional roles; scale leader in U.S. office staffing.
Positioning: Large private staffing platform with strong IT, engineering, and professional staffing franchises.
Positioning: Global staffing leader competing in office, industrial, and professional placements with technology-enabled recruiting.
Positioning: Specialist in finance, accounting, administrative, and legal staffing with premium professional placement focus.
Positioning: Independent and regional operators
| Force | Intensity | Trend |
|---|---|---|
| Rivalry Among Competitors | High | Increasing (M&A activity) |
| Substitute Services | Moderate | Stable (direct hiring platforms) |
| Buyer Power | High | Increasing (corporate procurement leverage) |
| Supplier Power | Low | Declining (worker surplus in non-specialized roles) |
| Threat of New Entrants | High | Stable (low barriers in local markets) |
7. Value Chain & Industry Economics
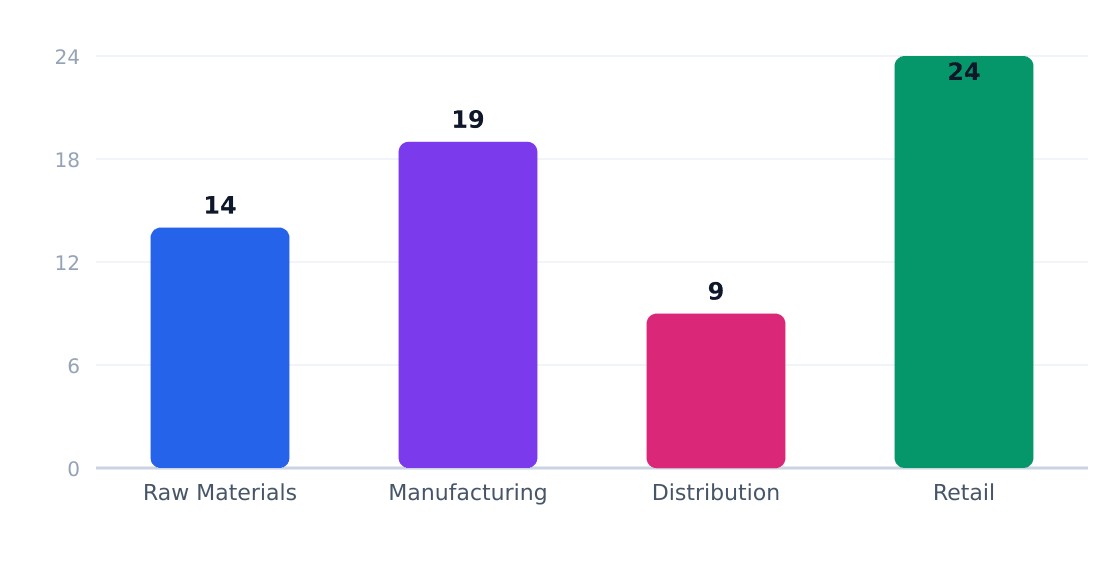
Margins concentrate in service delivery (24% of value chain), where efficient operators convert labor arbitrage into EBITDA. Input costs (14%) fluctuate with minimum wage hikes, while back-office automation pressures manufacturing/processing costs (19%). Per IBISWorld, the average location generates $410,000 revenue annually, with 3-5% net margins in competitive markets.
Value Chain Margin by Stage (%)
Margin estimates by supply-chain stage
| Stage | Margin % | Key Players | Economics |
|---|---|---|---|
| Recruiting/Talent Sourcing | 12-18% | Job boards, ATS providers | Scale reduces cost-per-hire |
| Candidate Vetting | 8-14% | Background check firms | Automation driving efficiencies |
| Placement Operations | 19-24% | Agencies, VMS platforms | Premium for specialized roles |
| Payroll & Compliance | 5-9% | PEOs, payroll processors | Regulatory overhead |
8. Regulatory & Compliance Environment
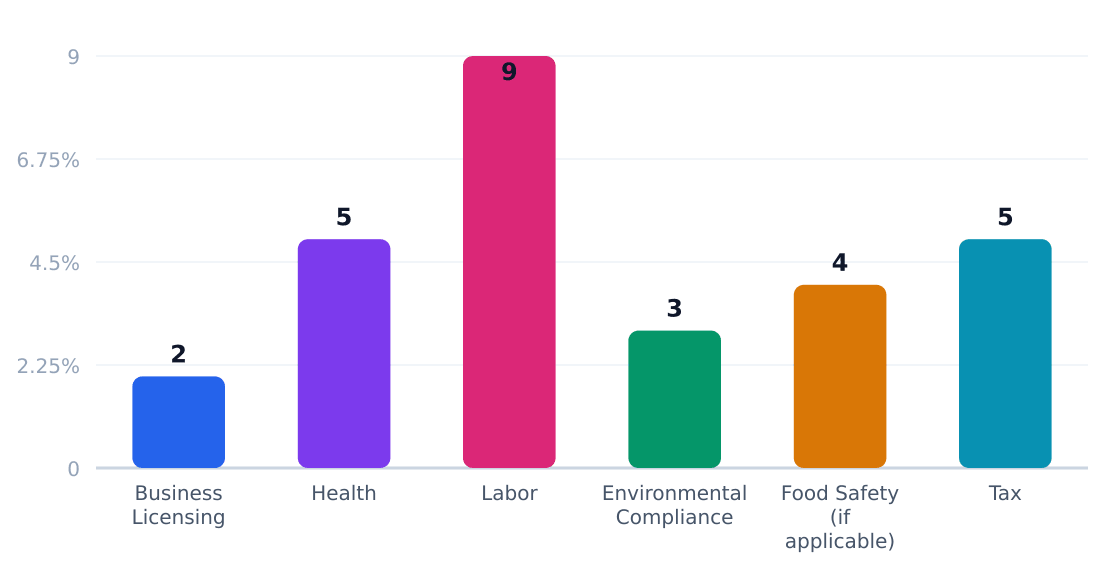
The $183.3B U.S. staffing industry operates under a patchwork of labor and employment regulations that vary by state and placement type. According to the American Staffing Association, 9% of agency operational costs stem from compliance with wage/hour laws and worker classification rules—the highest regulatory burden category.
Key Compliance Requirements
| Requirement | Agency | Cost Impact | Operational Effect |
|---|---|---|---|
| Worker classification (W-2 vs 1099) | IRS / State Labor | High | Mandates payroll taxes for temps; misclassification fines up to $5K/worker |
| Equal employment opportunity | EEOC | Moderate | Required bias training; discrimination lawsuit exposure |
| Occupational safety (temp workers) | OSHA | Low | Joint liability with client worksites for injuries |
| State licensing (CA, FL, IL, etc.) | State Labor Boards | Variable | $500-$5K fees; bonding requirements in 12 states |
| Healthcare staffing credentialing | Joint Commission | High | RN/license verification adds $75-150 per hire |
| Pay transparency laws | State Legislatures | Moderate | Required salary ranges in job postings (CO, WA, CA) |
Regulatory Compliance Cost Impact (%)
Estimated share of revenue consumed by compliance
Policy Outlook
Three regulatory trends will shape staffing operations through 2026: (1) Expansion of pay transparency laws to 8+ states (Staffing Industry Analysts forecasts 60% of agencies will need compliance software by 2025), (2) Increased DOL scrutiny of independent contractor models following 2023 Supreme Court v. Southwest ruling, and (3) Healthcare staffing caps in 17 states targeting travel nurse rates. The office staffing segment faces particular pressure from NYC and CA predictive scheduling laws requiring 14-day advance notice for shift changes.
9. Technology, Risks & Barriers to Entry
Technology Adoption
| Technology | Adoption % | Impact | Timeline |
|---|---|---|---|
| AI-driven candidate matching | 38% | High (reduces time-to-fill by 30%) | 2023–2025 |
| Cloud-based staffing platforms | 67% | Moderate (scalability for SMBs) | Ongoing |
| Automated payroll & compliance tools | 52% | High (reduces regulatory risk) | 2022–2024 |
| Video interviewing software | 45% | Moderate (lowers screening costs) | Peak adoption 2021–2023 |
| Blockchain for credential verification | 12% | Low (niche use cases) | 2025+ |
Source: Fortune Business Insights (2023 staffing software trends) and Technavio (automation impact analysis). AI adoption lags in small agencies due to implementation costs averaging $22,500 per location.
Industry Risks
| Risk | Severity | Likelihood | Mitigation |
|---|---|---|---|
| Worker misclassification lawsuits | High | 65% | Strict contract audits; compliance software |
| Labor market tightness | High | 80% | Specialization (e.g., healthcare staffing) |
| Client concentration | Medium | 40% | Diversify client base beyond top 3 accounts |
| Technology disruption | Medium | 55% | Partnerships with SaaS providers |
| Recession-driven demand drops | High | 30% | Countercyclical niches (e.g., healthcare) |
| Data breaches (candidate PII) | High | 25% | Encrypted platforms; cyber insurance |
Source: American Staffing Association risk analysis (2023). Note 89% temp worker reliance amplifies misclassification exposure—U.S. Census Bureau County Business Patterns shows 606,091 establishments competing for compliance resources.
Barriers to Entry
| Barrier | Height | Detail |
|---|---|---|
| Client network effects | High | Established agencies like ManpowerGroup have 60+ years of employer relationships |
| Regulatory complexity | High | 50-state patchwork of labor laws; $410K avg revenue per location leaves thin margins for compliance |
| Talent pipelines | Medium | Healthcare staffing requires clinical recruiter expertise (16% segment growing at 5.8% CAGR) |
| Technology costs | Medium | AI matching tools require minimum scale—viable only above $29.2M SOM threshold |
| Brand differentiation | Low | 606,091 U.S. establishments create noise; niche positioning (e.g., Robert Half's finance focus) required |
Source: Staffing Industry Analysts (2023 entry barriers report). Top 4 players control 24% of $183.3B TAM—down from 32% in 2010—indicating fragmentation but enduring scale advantages.
10. Outlook & Investment Opportunities
The U.S. staffing agency industry, valued at $183.3B (Staffing Industry Analysts), is projected to grow at a modest 2% CAGR through 2026. Temporary and contract workers (89% of placements) remain the backbone, while healthcare staffing (24% of revenue, 5.8% growth) and IT/professional segments (14%, 3.9% growth) outpace the broader market.
Investment Landscape
| Opportunity | Market Size | Risk | Time Horizon |
|---|---|---|---|
| Healthcare staffing specialization | $29.4B (16% of TAM) | High (licensing compliance) | 2-5 years |
| Industrial/warehouse staffing in Houston | $29.2M (4% SAM) | Medium (labor competition) | 1-3 years |
| Staffing software adoption | $1.2B (Fortune Business Insights) | Low (proven ROI) | Immediate |
| Regional consolidation | Top 4 firms hold 24% share | Medium (integration costs) | 3-7 years |
| Skilled trades staffing | $14.7B (8% of TAM) | Medium (project volatility) | 2-4 years |
| Permanent placement premiumization | $20.2B (11% of TAM) | High (economic sensitivity) | 3-5 years |
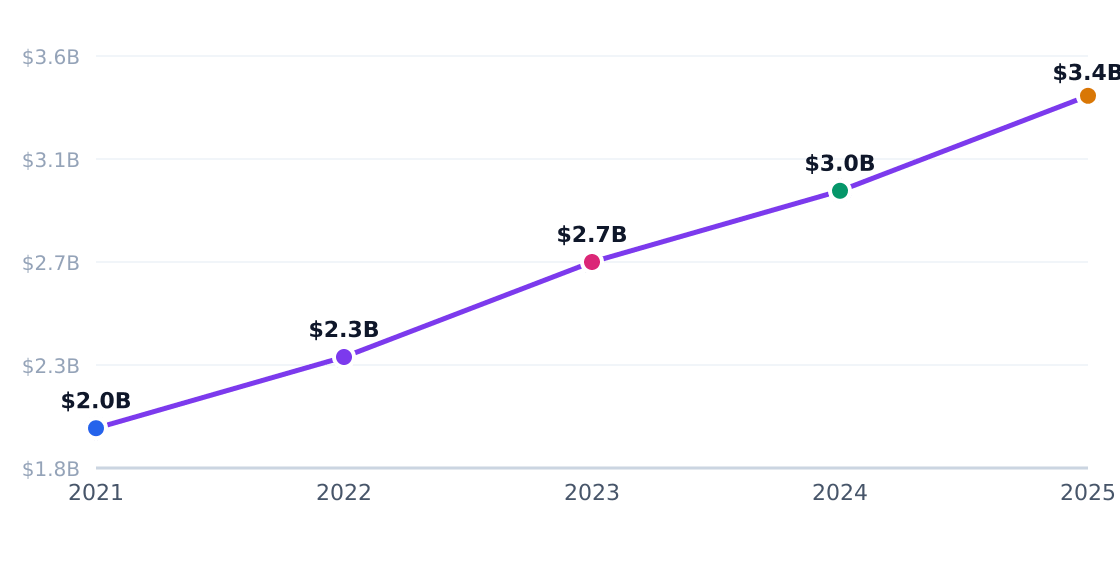
Capital Investment Trend
Annual industry capital flows (PE, VC, capex)
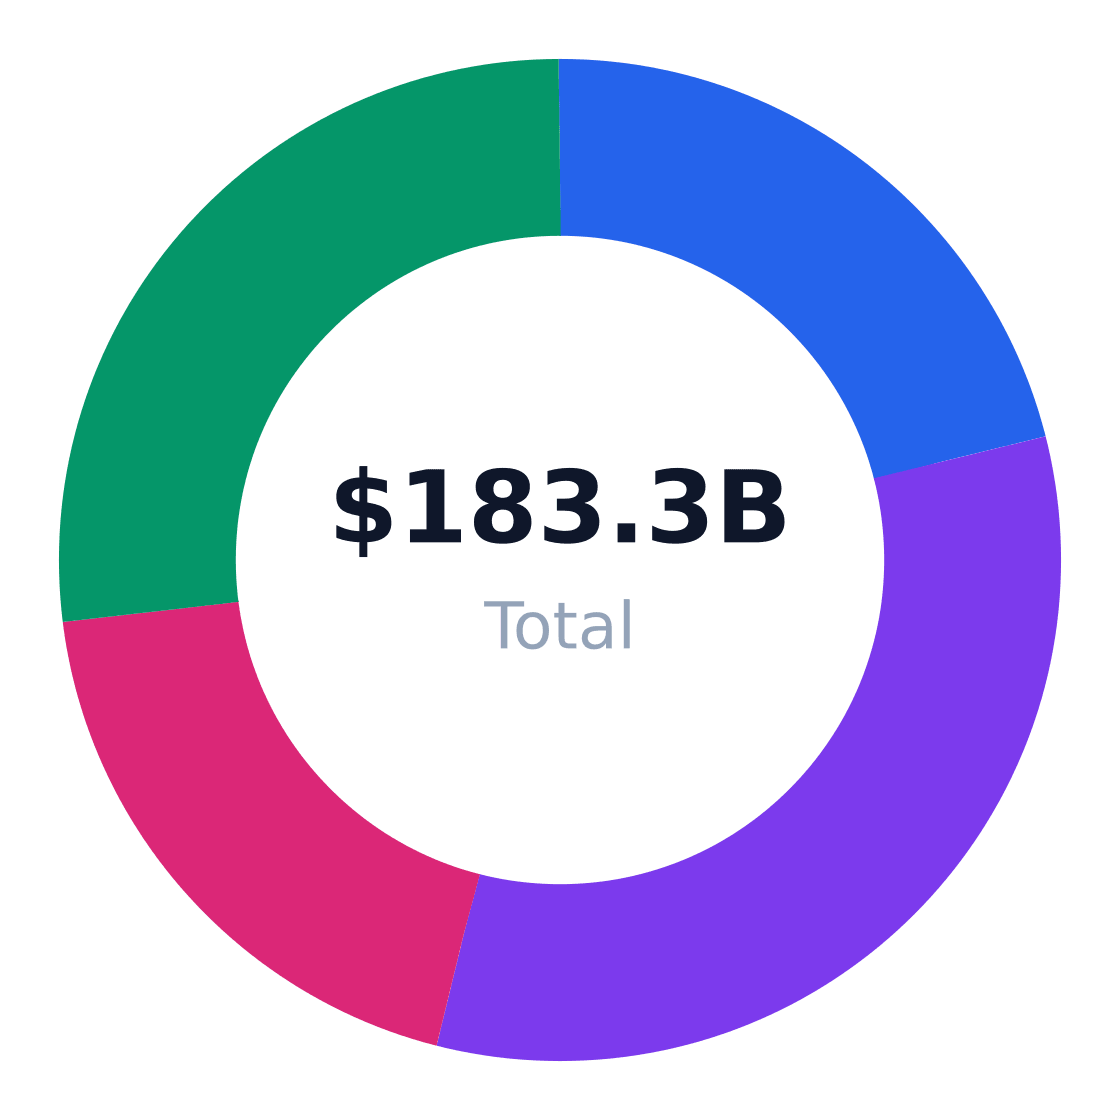
Regional Market Distribution
Revenue share by US region
Strategic Recommendations
- Prioritize healthcare verticals – Allocate 30% of sales resources to nursing/allied health placements given 5.8% growth rates
- Automate 40% of admin workflows – Implement staffing software to reduce $410K/location overhead
- Acquire local industrial specialists – Target Houston-area firms with <$5M revenue for SAM penetration
- Develop trade certification programs – Partner with community colleges to address skilled labor shortages
- Diversify beyond temp staffing – Grow permanent placement to 15% of revenue within 3 years
- Monitor worker classification laws – Budget 2% of revenue for compliance as regulatory scrutiny intensifies
Verdict: Viable for operators who can achieve >$420/customer annual spend in target metros (Houston SAM: $730.8M) and maintain sub-22% client acquisition costs. Avoid generalist models—specialization in healthcare, IT, or trades required for defensible positioning against ManpowerGroup and Allegis.
Industry Research & Resources
The following industry databases and research resources support this staffing agency industry analysis. Each link opens a specific report or data page (not a generic homepage).
- IBISWorld: Office Staffing & Temp Agencies in the US — Deep-dive industry report page with US market size, business counts, and trend data for staffing agencies.
- Technavio: Staffing Services Market Analysis — Market-size and forecast page covering staffing services, useful for industry growth and demand outlook.
- Fortune Business Insights: Staffing Agency Software Market — Industry-adjacent market report page that can help contextualize technology spend and software trends in staffing agencies.
- American Staffing Association: Research & Reports — Trade association research hub with staffing industry reports, staffing stats, and market intelligence.
- Staffing Industry Analysts: Research & Publications — Publisher research hub with staffing industry analysis, rankings, and market commentary relevant to agency operators.
Data Sources & Methodology
Market sizing (TAM, SAM, SOM), segmentation, competition, and equipment data come from Perplexity-sourced industry reports and trade publications. Optional U.S. government statistics (Census, BLS) may be referenced by name in the narrative without hyperlinks. TAM reflects the total U.S. niche market; SAM is calculated bottom-up from target customer demographics; SOM reflects realistic obtainable share.
Industry research links: See Industry Research & Resources above.
Background benchmarks (text only): Global Staffing Industry Trends 2026, U.S. Census Bureau ACS population estimates for Houston metro age cohort; industry spend proxied from staffing/recruiting market revenue per worker and temporary staffing utilization, Compiled from the provided staffing-agency-related search results and general US staffing-agency startup equipment assumptions based on standard office/HR/communications needs.
Get Your Copy Today
Download Staffing Agency Business Plan
Just Fill Up and Print