How to Read the 2024 ACS 5-Year Estimates for Business Market Sizing

Why the 2024 ACS 5-Year Estimates Are Your Best Tool for Market Sizing
If you're sizing a business market in 2024, you need the American Community Survey (ACS) 5-year estimates. Not the 1-year data, not the decennial census—this is the dataset that gives you stable, granular insights into neighborhoods, income brackets, and niche demographics. I’ve used this for everything from retail site selection to policy analysis, and here’s how to read it right.
What Makes the 5-Year ACS Different?
The ACS 5-year series pools responses from 2019 to 2024, smoothing out volatility and allowing analysis of small geographies like census tracts (average 4,000 people) and block groups (600-3,000 people). Unlike the 1-year estimates, which only cover areas with 65,000+ people, the 5-year data lets you drill down to specific neighborhoods—critical for local businesses.
How to Extract Business Insights
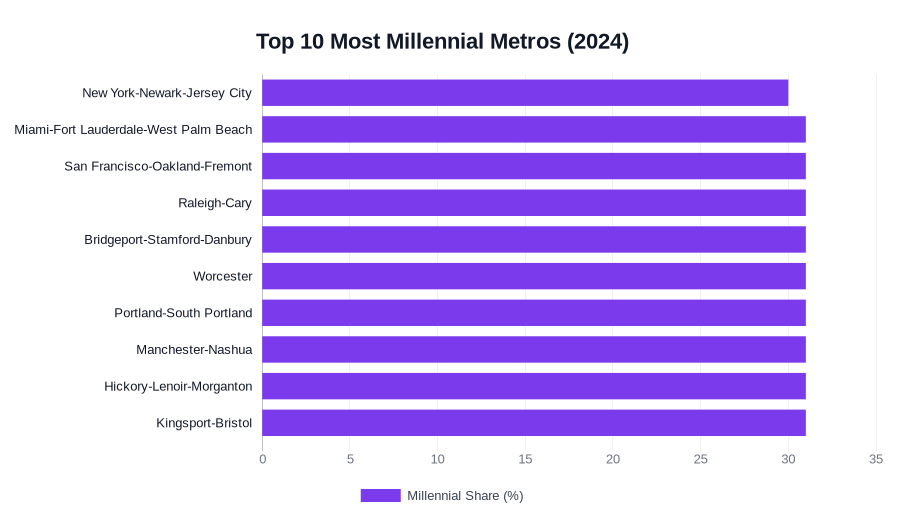
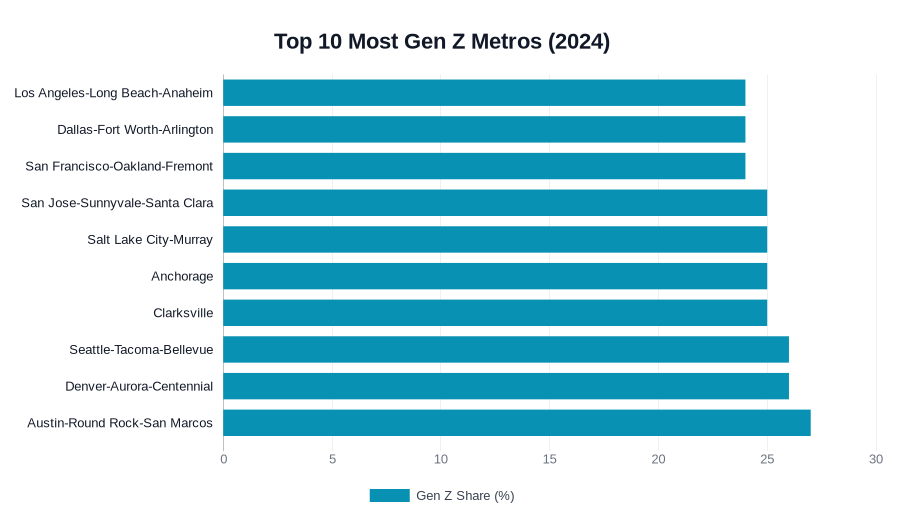
First, ignore the headline population totals. The ACS is a survey, not a full count, so focus on estimated percentages and margins of error. For example, if you’re targeting Gen Z consumers, the chart above shows metros where they cluster—but always check the margin of error before betting your expansion budget.
Second, use comparison tables cautiously. The Census Bureau explicitly warns against comparing overlapping periods (e.g., 2018-2022 vs. 2019-2024). For trends, stick to non-overlapping windows like 2014-2018 vs. 2019-2024. Recent research shows this avoids false signals from shared survey years.
The Practical Workflow
Here’s how I approach it:
- Define your geography: ZIP Code Tabulation Areas (ZCTAs) for regional services, tracts for neighborhood retail. Social Explorer’s tools help visualize these.
- Isolate your segment: Use table B19001 for income bands, B15003 for education, or B25070 for rent burdens. The Household Shift Tracker automates some of this.
- Check the margin of error: If your target group’s MOE exceeds 20% of the estimate, consider aggregating geographies or broadening criteria.
When to Look Elsewhere
The 5-year ACS isn’t perfect. For rapidly changing markets (like pandemic-era migration hotspots), the 1-year estimates or even local surveys might supplement. And if you need real-time data, you’re better off with credit card spending or mobility data—but for stable demographic baselines, this remains the gold standard.
The bottom line? Treat ACS estimates as directional, not exact. A tract showing 1,200 college grads ±300 is telling you "this area has concentration," not "there are precisely 1,200 customers." That’s how smart businesses use it—and how you should too.