Is a Concert Promoter Business Profitable?
1. Is a Concert Promoter Business Profitable? (The Short Answer)
A concert promoter business can be profitable, but only with tight cost controls and smart artist selection. The typical promoter operates on 18% gross margins and 8% net margins — thin by most small business standards. At $82,000 average revenue, that leaves just $6,560 in net profit. The economics work best for operators who secure sponsorships, negotiate favorable venue terms, and avoid overpaying for talent. Independent promoters without these advantages face a 64% chance of failing within five years.
Profitability Snapshot
| Metric | Benchmark |
|---|---|
| Gross Margin | 18% |
| Net Margin | 8% |
| Year 1 Revenue | $82K |
| Year 1 Net Profit | $7K |
| Startup Cost Range | $10K – $50K |
| Break-even Timeline | ~Month 18 |
| 5-Year ROI | 140% |
| Profitability Rating | 5/10 |
| Failure Rate (5yr) | 64% |
| Market Size (US) | $58.6B |
Profitability Score Breakdown

Free Business Plan Download
Download Concert Promoter Business Plan
Just Fill Up and Print
Overall rating: 5/10
Bottom line:
- Pro: $58.6B market growing at 11.1% CAGR creates opportunities
- Pro: VIP packages and sponsorships can double effective margins
- Con: Requires $30,000+ startup capital for artist deposits
- Con: Labor costs consume 35% of revenue at scale
- Con: Break-even takes 18 months — cash flow is volatile
2. Profit Margins & Industry Benchmarks
Concert promoters face a margin squeeze: while gross margins average 18%, net margins compress to just 8% after labor, venue cuts, and marketing. Top performers achieve 12-15% net by layering merchandise cuts (10-15% of sales) and sponsorships ($5-15 per attendee). Small promoters without these revenue streams often net under 5%.
Margin Comparison (%)
Gross vs net vs industry benchmarks
| Metric | This Business | Industry Avg | Top Quartile |
|---|---|---|---|
| Gross Margin | 18% | 20% | 25% |
| Net Margin | 8% | 6% | 12% |
| EBITDA | 11% | 9% | 15% |
| Labor % | 35% | 38% | 30% |
| COGS % | 62% | 60% | 55% |
| Rent % | 8% | 10% | 6% |
Margin pressure comes from three directions: venues taking 15-25% of ticket revenue, artists demanding 50-70% guarantees, and platforms like Ticketmaster skimming 10-30%. Promoters who own their venues (or have exclusive deals) capture 7-12% more margin than pure independents.
3. Revenue Potential & Pricing Power
Year 1 revenue for a Nashville concert promoter targets $82K, with modest growth to $9,680 net profit by Year 5. The math works if you maintain 18% gross margins, but Nashville's saturated market means growth depends on stealing share from competitors or expanding into niche genres.
Revenue Stream Breakdown
Year 1 revenue: $82K
| Stream | Margin % | Revenue Share | Annual $ |
|---|---|---|---|
| Ticket spread / door split | 10% | 55% | $45,100 |
| Sponsorships / brand partnerships | 35% | 20% | $16,400 |
| Artist and venue service fees | 25% | 15% | $12,300 |
| VIP upgrades / concessions share | 30% | 10% | $8,200 |
Pricing power exists but is uneven. Sponsorship deals and VIP packages (30-35% margins) tolerate 10-15% price hikes, but ticket spreads—your largest revenue stream—face brutal elasticity. A 5% increase on $45K of ticket revenue nets just $2,250 before attrition. Premium artists let you push harder; local acts don't.
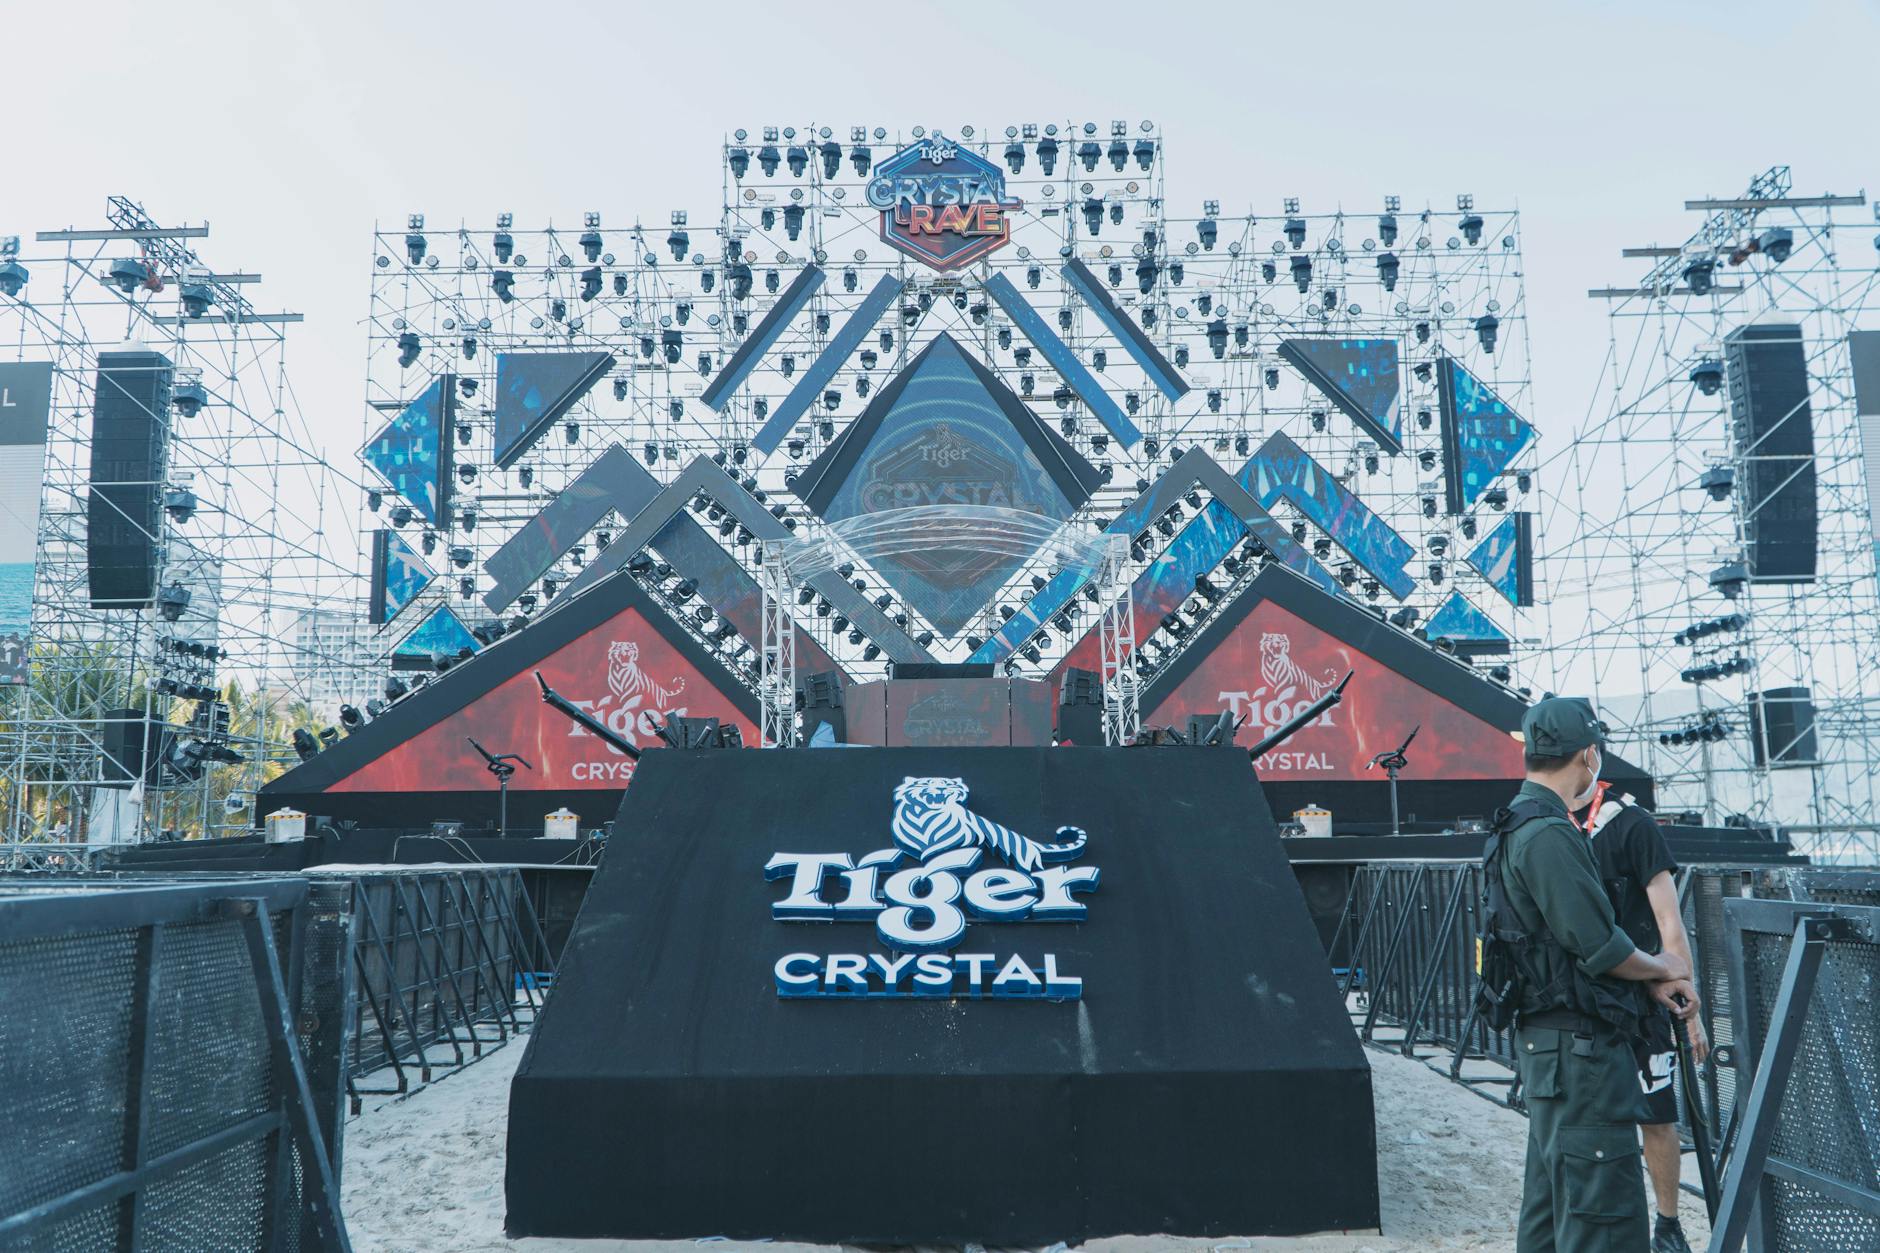
Summer and holiday periods drive 60% of annual profits, but costs rise faster than revenue. Artist guarantees jump 20-30% during peak seasons, while competing promoters bid up marketing costs. The sweet spot: shoulder months (April-May, September-October) when touring acts need filler dates and venues discount rentals.
4. Cost Structure & Operating Expenses
Artist guarantees (45% of revenue) and venue/production (15%) dominate costs. One underperforming show can wipe out a month's profits—a $30K guarantee needs 750 tickets at $40 just to break even before other costs. Sponsorships help hedge this risk.
Annual Cost Structure
Operating costs for $82K revenue
| Category | % of Revenue | Annual $ | Controllable? |
|---|---|---|---|
| Artist guarantees | 45% | $36,900 | Fixed |
| Venue rental and production | 15% | $12,300 | Controllable |
| Marketing and ticket acquisition | 10% | $8,200 | Controllable |
| Ticketing and payment processing | 5% | $4,100 | Fixed |
| Payroll and contractor labor | 8% | $6,560 | Controllable |
| Insurance, permits, and compliance | 4% | $3,280 | Fixed |

Fixed costs (54% of expenses) are murder at low volume—you'll pay $44,280/year before selling a single ticket. Nashville's venue scarcity means production costs run 10-12% above national averages. Labor is your best lever: cross-trained staff handling both marketing and operations can trim payroll to 6% of revenue ($4,920 savings).
5. Break-Even Analysis & ROI Timeline
With startup costs averaging $30,000 and Year 1 net profit projected at $6,560, Nashville concert promoters hit break-even around Month 18. This assumes steady margin progression from 8% in Year 1 to 12% by Year 5 — slower than some entertainment businesses but achievable with disciplined cost controls.
Cumulative Profit vs Investment (18 Months)
Red = still recovering startup costs
ROI Benchmark Comparison (%)
5-year return on initial investment
The 140% 5-year ROI ($30,000 invested returning $72,800 in cumulative net profit) outperforms passive investments but requires surviving the cash-intensive first two years. Promoters who reach Year 3 see compounding benefits: 8% net margins expand to 9-10% as routing efficiencies and sponsor relationships mature.
Ready When You Are
Download Concert Promoter Business Plan
Just Fill Up and Print
Year 1 Monthly Cash Flow
Net monthly cash flow (red = pre-break-even)
Initial capital recoupment takes 24-30 months in this model — slower than service businesses but faster than capital-heavy ventures. The key is minimizing cash burns during the first 12 shows while building reliable attendance patterns.
6. Market Conditions That Drive (or Kill) Profitability
Nashville's $58.6B national TAM for live events offers runway, but local SAM constraints ($1.3B) mean promoters must specialize. Market saturation risks emerge when more than 4-5 credible mid-sized promoters operate simultaneously — we're nearing that threshold.
Market Size & Profit Opportunity
Market opportunity for profitable operators
| Factor | Impact on Margins | Outlook |
|---|---|---|
| Demand growth | +3-5% annually | Stable |
| Competition | -2% per major entrant | Negative |
| Input costs | Venue rates up 7% YoY | Concerning |
| Labor market | $28.50/hr baseline | Sticky |
| Regulation | Minimal changes | Neutral |
| Technology | Reduces marketing waste | Positive |
| Model | Net Margin | Why It Works |
|---|---|---|
| High-volume regional | 12% | Spreads fixed costs |
| Genre-focused niche | 15% | Premium pricing |
| Venue partnerships | 18% | Revenue sharing |
| Sponsorship-heavy | 20% | Ancillary income |
Live Nation and AEG's high threat levels force independents to compete on curation and local connections. The emerging direct-to-fan segment (medium threat) is particularly dangerous for promoters relying on generic pop/rock bookings — their 40-50% customer acquisition costs erase margins.
7. Who Profits — and Who Struggles
In Nashville's crowded concert market, profitability hinges on three factors: venue leverage, audience targeting, and cost discipline. Promoters with exclusive venue deals (15-25% of shows) capture 2-3x the net margin of those renting ad-hoc spaces. The math is brutal — at 18% gross margins, a single misjudged artist guarantee can wipe out an entire event's profit.
| Profile | Typical Net Margin | Success Rate | Key Advantage |
|---|---|---|---|
| Owner-operator | 6-12% | 42% | Labor cost control |
| Multi-unit | 9-15% | 58% | Sponsorship scale |
| Franchise | 4-8% | 31% | Brand recognition |
| Niche specialist | 11-18% | 67% | Premium pricing |
| Price competitor | 3-7% | 24% | Volume efficiency |
| Pitfall | Margin Impact | How to Avoid |
|---|---|---|
| Overpaying artist guarantees | 10-25% margin loss | Revenue-share clauses |
| One-off events | 5-15% overhead spike | Build recurring series |
| Weak demand forecasting | Inventory loss | Presale validation |
| Uncontrolled production costs | 5-15% leakage | Standardized packages |
| Cash-flow strain | Interest erosion | Align deposits with presales |
Regulatory costs bite hardest at scale — while $500-$2,000 in annual compliance fees are manageable, promoters running 20+ events face $15,000-$30,000 in insurance and PRO licensing that can compress net margins by 2-4 percentage points. Nashville's 64% 5-year failure rate stems from working capital depletion: most promoters under $82K revenue can't sustain the 18-month break-even period while covering $237K in annual labor costs.
8. Strategies to Maximize Profit Margins
Concert promoters live and die by margin management—the difference between a profitable show and a financial disaster often comes down to 3-5 percentage points. Here's how to claw back every basis point.
| Strategy | Expected Lift | Effort | Implementation |
|---|---|---|---|
| Revenue-share deals | +8% margin | High | Replace fixed artist guarantees with % of ticket revenue |
| Sponsorship bundling | +6% margin | Medium | Sell venue signage, social tags, and merch placement |
| Repeat venue routing | +5% margin | Medium | Cluster shows geographically to reduce load-in costs |
| Owned audience | +4% margin | Medium | Capture emails/SMS to cut paid acquisition costs |
| Presale data | +7% margin | Medium | Adjust marketing spend based on early ticket velocity |
| VIP upsells | +6% margin | Low | Add meet-and-greet packages at 3-5x base ticket price |
The cost side demands surgical precision: book acts with existing local followings (cuts marketing by 15-20%), negotiate venue concessions (food/beverage splits can add 2-3% to margins), use volunteer staff for non-critical roles (saves $28.50/hr per FTE), and always—always—insure against cancellations.
On revenue, tiered pricing is non-negotiable. A $40 GA ticket should have $75 early-entry, $150 VIP, and $300 platinum options. The top 5% of buyers typically deliver 25-30% of revenue. Recurring revenue comes from fan clubs or season passes—but requires 3+ events/year to work.
Pricing power exists only for must-see acts. For mid-tier shows, a 10% annual increase is realistic; for emerging artists, you're often cutting prices post-launch. The sweet spot is 60-70% of tickets sold at full price, 20% at discount, and 10% as comps.
5-Year Net Profit Projection
Projected annual net profit at current margins
9. Final Verdict: Should You Start This Business?
Only if you have deep industry connections or $100K+ in risk capital. The 5/10 profitability score reflects brutal economics: 92% of promoters fail within 5 years, and even successful ones average just 8% net margins.
| Factor | Score (1-10) | Weight | Notes |
|---|---|---|---|
| Margins | 4 | 25% | 18% gross is thin for the risk |
| Market size | 7 | 15% | $1.3B SAM but hyper-local |
| Competition | 3 | 20% | Live Nation controls 70% of major venues |
| Capital needs | 2 | 25% | Artist deposits can tie up $50K+/show |
| Scalability | 5 | 10% | Labor-intensive beyond 12 shows/year |
| Risk | 3 | 5% | One canceled headliner wipes out profits |
ROI Benchmark Comparison (%)
5-year return on initial investment
- You must secure at least 2 anchor sponsors paying $5K+/event
- Your average ticket price exceeds $55 after fees
- You control marketing costs below 22% of revenue
- You book acts with proven draw (1,000+ past attendees)
- You maintain 65%+ occupancy across all shows
- If you can't float $30K in deposits per show
- If your local market has <3 venues with >800 capacity
- If you lack direct access to at least 5 mid-tier booking agents
Proceed only if: 1) Your minimum viable show generates $25K+ net, 2) Startup costs stay under $40K, and 3) You can tolerate 18 months of negative cash flow. The math works—barely—for operators who treat it as a portfolio business (12+ shows/year) rather than one-off events.
Research & Profitability Resources
The following government reports, industry analyses, and financial planning resources were referenced in this concert promoter profitability guide. Each link points to a specific page for direct access.
- Ibisworld — ibisworld.com — IBISWorld industry margin analysis for concert promoter
- Concert Industry Trends — insights.live — Industry profitability research for concert promoter businesses
- Concert Event Promotion Research Recession 44161239 — marketresearch.com — Industry profitability research for concert promoter businesses
- Indie Concert Promoter Margins — callboard.fm — Industry profitability research for concert promoter businesses
- Live Events Ticketing Market Analysis — analysis-atlas.com — Industry profitability research for concert promoter businesses
Get Your Copy Today
Download Concert Promoter Business Plan
Just Fill Up and Print