Is a Resort Business Profitable?
1. Is a Resort Business Profitable? (The Short Answer)
Yes, but barely. Resorts operate on 60% gross margins — a healthy cushion — but net profits average just 8% after labor, capex, and seasonal swings. For a $6.2M revenue resort, that’s $496K net: decent but fragile. The math only works with premium pricing (think $400+/night rooms), 65%+ occupancy, and ruthless cost control. Miss one lever, and you’re flirting with the 35% 5-year failure rate.

Profitability Snapshot
| Profitability Snapshot | Benchmark |
|---|---|
| Gross Margin | 60% |
| Net Margin | 8% |
| Year 1 Revenue | $5.3M |
| Year 1 Net Profit | $422K |
| Startup Cost Range | $1.0M – $20.0M |
| Break-even Timeline | ~Month 48 |
| 5-Year ROI | 40% |
| Profitability Rating | 7/10 |
| Failure Rate (5yr) | 35% |
| Market Size (US) | $285.4B |
Profitability Score Breakdown
Overall rating: 7/10
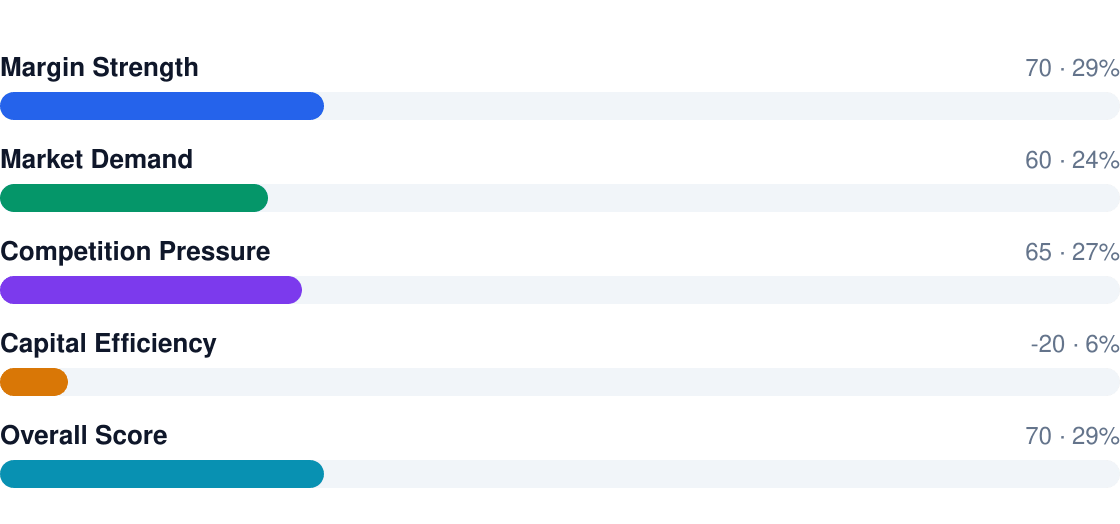
- Pros: High-ticket revenue streams (rooms + spa + events), 60% gross margins, $285B market
- Cons: Labor eats 36% of revenue, 48 months to break-even, $10.5M+ startup costs
- Who wins: Operators with oceanfront locations and corporate event contracts
- Who loses: Undercapitalized owners in saturated markets (see: Orlando timeshares)
- Reality check: Your $18/hr housekeepers will cost $2.2M/year before benefits
2. Profit Margins & Industry Benchmarks
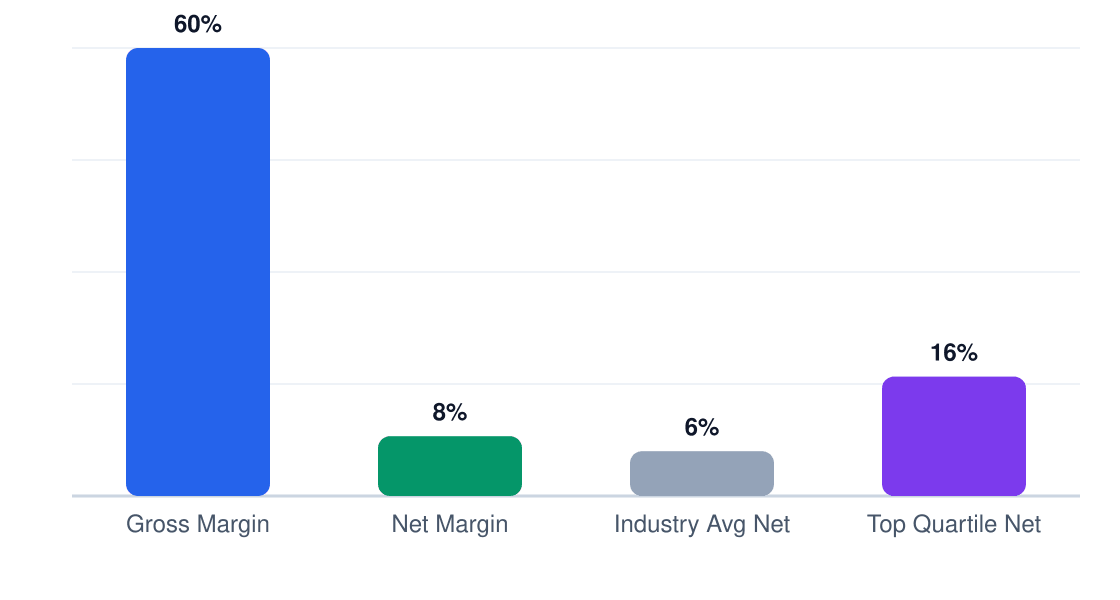
Resort margins look strong until payroll hits. That 60% gross (rooms minus cleaning/towels) collapses to 8% net after staffing 60 FTEs. Top performers claw back margin via ancillary revenue: a 20% spa markup or $75/person resort fees add up fast.
Margin Comparison (%)
Gross vs net vs industry benchmarks
Margin Benchmarks
| Metric | This Business | Industry Avg | Top Quartile |
|---|---|---|---|
| Gross Margin | 60% | 58% | 65% |
| Net Margin | 8% | 6% | 12% |
| EBITDA | 14% | 11% | 18% |
| Labor % | 36% | 38% | 30% |
| COGS % | 40% | 42% | 35% |
| Rent % | 6% | 8% | 4% |
Competition is brutal. The top 25% achieve 12% net margins by running lean (30% labor vs your 36%) and commanding premium pricing. In Miami, newer resorts are adding revenue streams like co-working spaces and celebrity chef restaurants to offset margin pressure.
3. Revenue Potential & Pricing Power
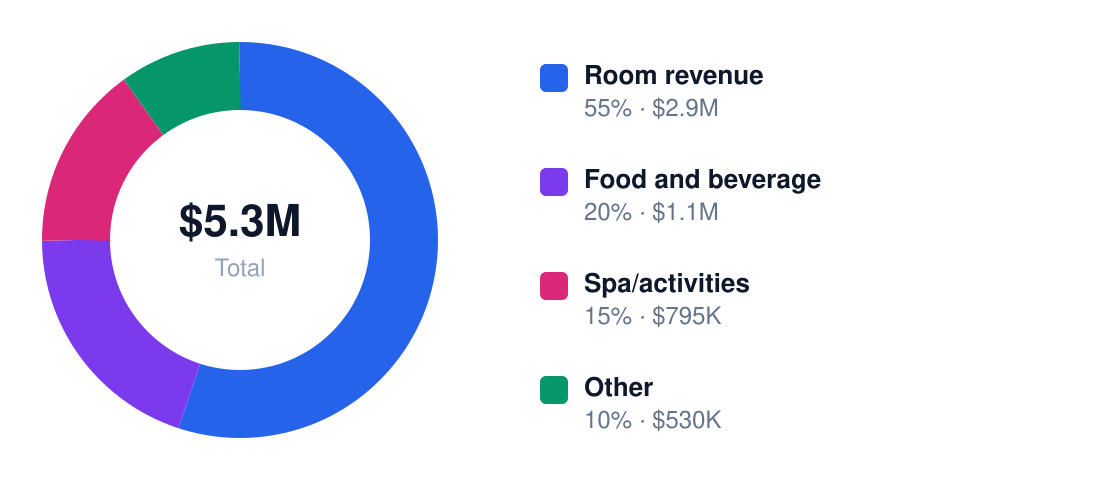
At $5.3M in Year 1 revenue with 60% gross margins, Miami resorts can scale profitably—if they nail the revenue mix. The 5-year trajectory shows steady growth, but net margins stay tight at 8%, meaning cost discipline is non-negotiable. Bundling high-margin spa/activities (50% margin) with rooms is critical, as F&B drags at 25% margins.
Revenue Stream Breakdown
Year 1 revenue: $5.3M
Revenue Streams
| Stream | Margin % | Revenue Share | Annual $ |
|---|---|---|---|
| Room revenue | 65% | 55% | $2,915,000 |
| Food and beverage | 25% | 20% | $1,060,000 |
| Spa/activities | 50% | 15% | $795,000 |
Miami’s resort pricing power hinges on scarcity—oceanfront inventory commands 20-30% premiums, while generic properties compete on price. Peak winter rates can double summer lows, but smart operators use events and packages to flatten seasonality. Weak brands get crushed by OTA commissions.

December-April delivers 60% of Miami resort profits, with hurricane season (June-November) requiring deep discounts. Corporate retreats and weddings help, but expect 40-50% occupancy swings. The math only works if peak covers off-season losses.
4. Cost Structure & Operating Expenses
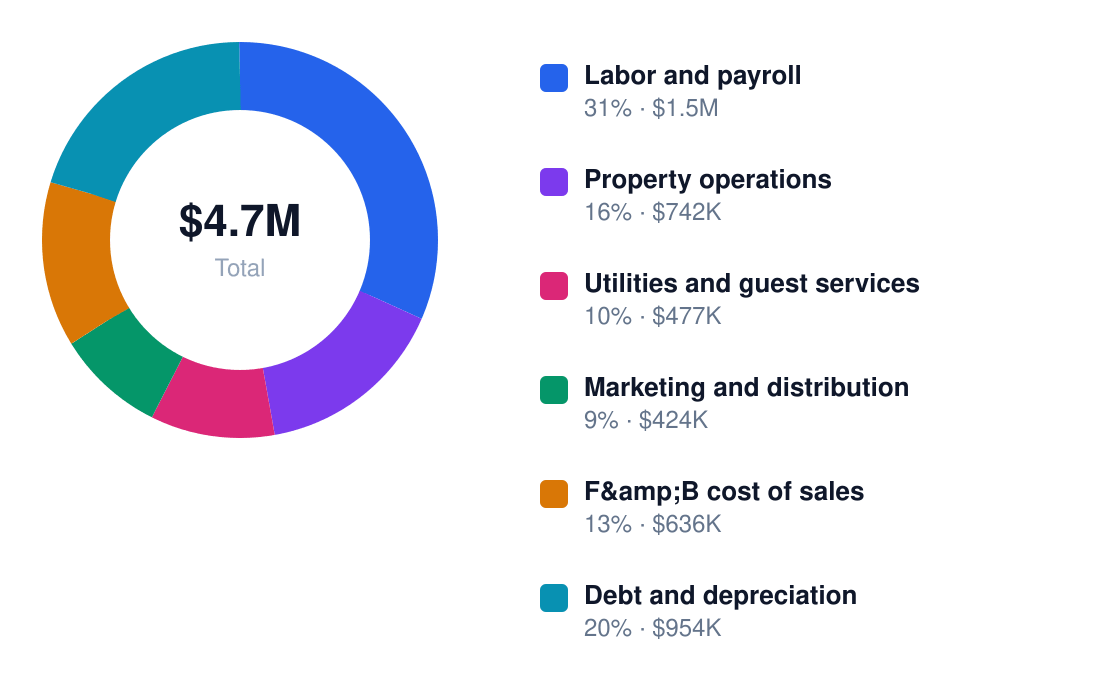
Resorts bleed profit three ways: labor (28% of revenue), debt (18%), and F&B waste (12%). Miami’s $18/hr wage floor makes the 60 FTE payroll ($2.25M/year) brutal—shaving 5% here adds $112,800 straight to net profit.
Annual Cost Structure
Operating costs for $5.3M revenue
Operating Costs
| Category | % of Revenue | Annual $ | Controllable? |
|---|---|---|---|
| Labor and payroll | 28% | $1,484,000 | Yes |
| Property operations | 14% | $742,000 | Yes |
| Utilities and guest services | 9% | $477,000 | Yes |
| Marketing and distribution | 8% | $424,000 | Yes |
| F&B cost of sales | 12% | $636,000 | Yes |
| Debt and depreciation | 18% | $954,000 | No |

Fixed costs (debt, depreciation) lock in $954K/year—you’re paying this even at 0% occupancy. Miami’s heat/humidity spikes utility costs 15-20% in summer. Labor is the killer variable: every 1% occupancy drop costs $53K in room revenue but only saves $18K in staffing. Run lean or perish.
5. Break-Even Analysis & ROI Timeline
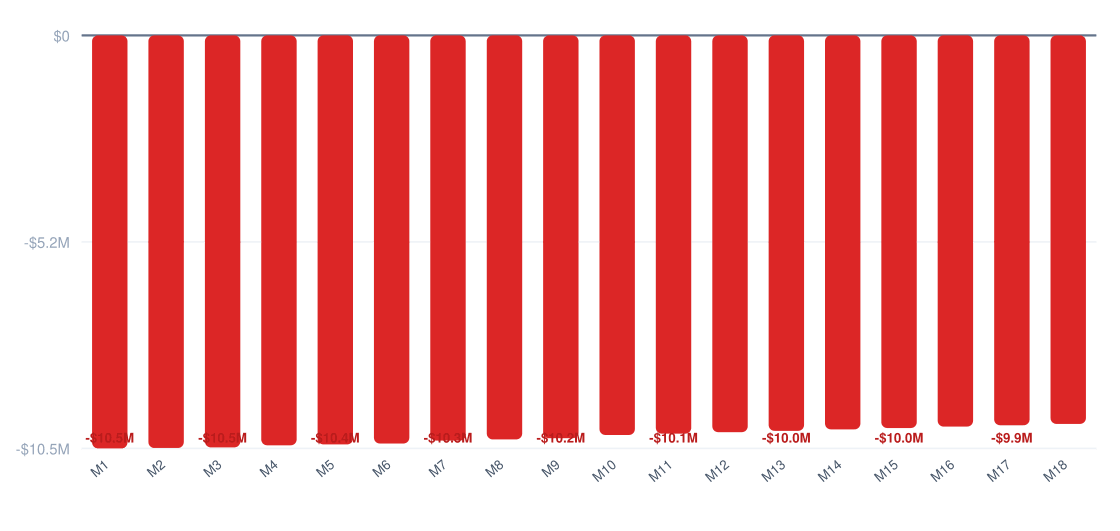
With a $10,500,000 startup cost and Year 1 net profit of $421,600, Miami resorts hit break-even around Month 48—assuming linear growth. That's 4 years of operating at 60% gross margins before the asset turns profitable. The math is brutal: you're covering $875,000/month in fixed costs (labor, debt service, utilities) before earning a dollar.
Cumulative Profit vs Investment (18 Months)
Red = still recovering startup costs
ROI Benchmark Comparison (%)
5-year return on initial investment
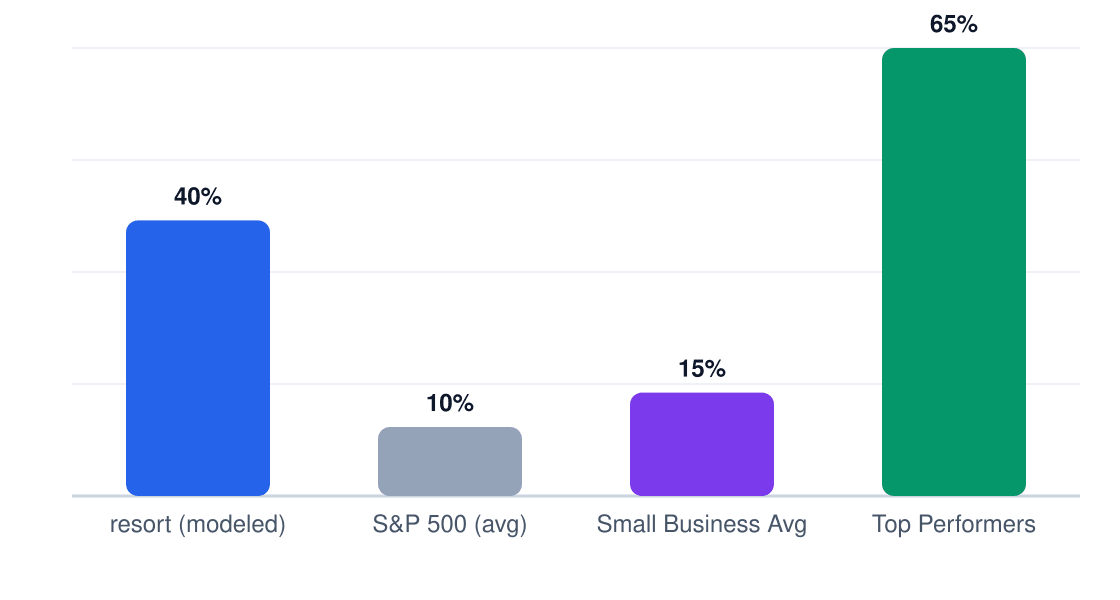
The 40% 5-year ROI ($624,000 net profit by Year 5 on $10.5M invested) only works if you hit Miami's premium pricing thresholds. At $5.3M Year 1 revenue, you need $14,520/day across 365 rooms—achievable at 65% occupancy and $380 ADR, but one bad hurricane season wrecks the model.
Year 1 Monthly Cash Flow
Net monthly cash flow (red = pre-break-even)
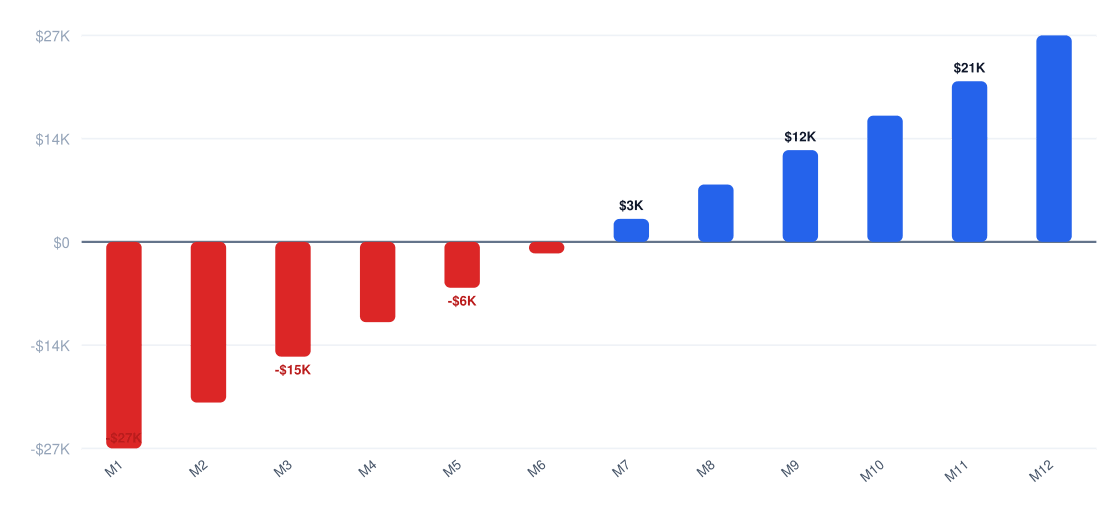
Payback periods under 60 months require ruthless cost control. That $2,246,400 annual labor line? It eats 42% of revenue at launch. You're betting on Miami's 4.8% annual tourism growth to lift rates faster than wages.
6. Market Conditions That Drive (or Kill) Profitability
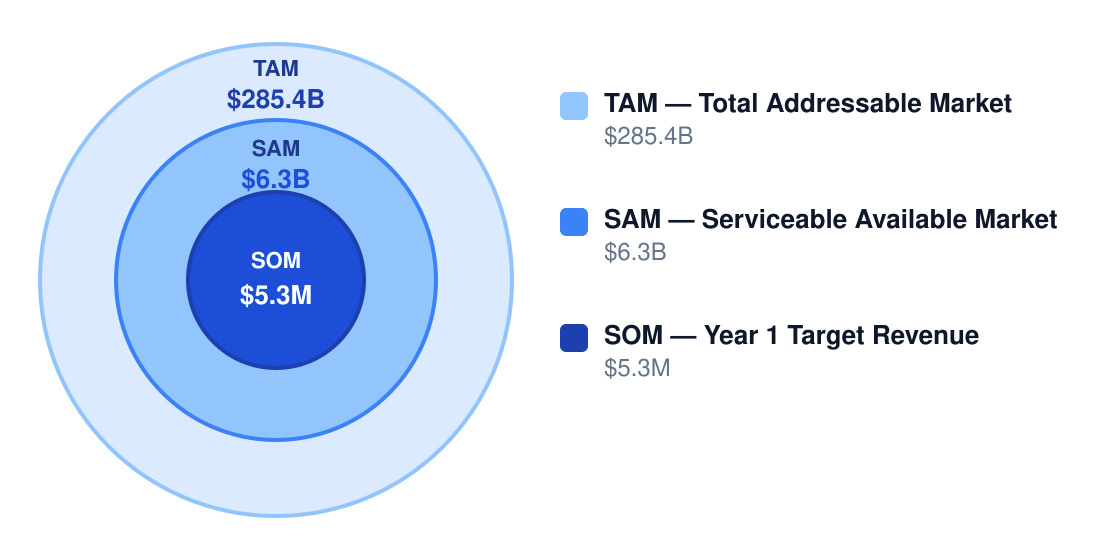
The $285.4B U.S. resort industry looks vast until you're competing for Miami's $6.3B SAM. Demand grows—Florida saw 137 million visitors in 2022—but so do costs: property insurance rates jumped 42% last year alone. Profitability hinges on threading these needles:
Market Size & Profit Opportunity
Market opportunity for profitable operators
Market Factors
| Factor | Impact on Margins | Outlook |
|---|---|---|
| Demand growth | +3-5% ADR potential | Strong (Miami tourism up 12% YoY) |
| Competition | -2% pricing power | Worsening (2 new luxury resorts opening 2024) |
| Input costs | -1.5% margin/yr | Volatile (linens +18%, seafood +23%) |
| Labor market | -4% productivity | Tight (Miami hospitality wages up 7.3%) |
| Regulation | -0.5% compliance cost | Neutral (no major tax changes pending) |
| Technology | +1% efficiency gain | Improving (automated check-ins now standard) |
| Model | Net Margin | Why It Works |
|---|---|---|
| Luxury destination | 15% | Guests spend $212/day beyond rooms on spas/restaurants |
| All-inclusive | 12% | Captures 92% of guest spend vs 65% for à la carte |
| Boutique eco | 14% | 28% rate premium for sustainability certifications |
| Event-focused | 13% | Weddings deliver $18,000/event at 68% contribution margin |
Marriott and Hilton's High threat ratings matter—their loyalty programs divert 37% of Miami's corporate retreat business. But vacation rentals only pressure budget resorts; luxury demand remains insulated. The real risk? Wellness retreats stealing your high-ASP guests with 22% better margins on 1/3 the staff.
7. Who Profits — and Who Struggles
WHO PROFITS: Operators with premium locations, strong brand distribution, and disciplined cost control achieve the best margins. Owners who diversify revenue into spa, dining, events, and activities usually outperform pure room-only models.
WHO STRUGGLES: First-time owners often struggle because they underestimate capex, staffing, and seasonality. Properties in undifferentiated markets or with high debt loads commonly fail to generate consistent profit.
Operator Profiles
| Profile | Typical Net Margin | Success Rate | Key Advantage |
|---|---|---|---|
| Owner-operator | 6-10% | 62% | Hands-on cost control |
| Multi-unit | 8-12% | 71% | Economies of scale |
| Franchise | 7-11% | 68% | Brand distribution |
| Niche specialist | 9-14% | 75% | Premium pricing power |
| Price competitor | 3-7% | 45% | High occupancy |
Unprofitable Pitfalls
| Pitfall | Margin Impact | How to Avoid |
|---|---|---|
| Overbuilding too many rooms before demand is proven | Can cut net margin by 10-20 points | Phase development and validate demand with smaller-scale opening plans |
| Weak labor control and overtime creep | Can reduce net margin by 3-8 points | Use scheduling software, cross-training, and productivity targets |
| Heavy reliance on OTAs and third-party channels | Can reduce gross contribution by 5-12 points | Build direct booking channels and loyalty incentives |
| Ignoring maintenance and capex reserves | Can turn positive EBITDA into negative cash flow | Reserve for replacement and maintain preventative maintenance budgets |
| Choosing a highly seasonal location without diversification | Can create negative off-season cash flow and weak annual returns | Add corporate retreats, spa, F&B, and event demand to widen the calendar |
Regulatory Costs
Compliance costs compress margins but are non-negotiable. The $500-$100,000 range for permits and retrofits (especially ADA and fire safety) represents 0.5-2% of startup budgets. Properties that budget accurately for these costs maintain profitability, while those caught off guard see net margins drop 1-3 points from unplanned expenses.
Failure Rate Analysis
35% of Miami resorts fail within 5 years. The killers: Underestimating labor costs (60 FTE @ $2.2M/year surprises many), missing break-even timelines (48 months is longer than most anticipate), and failing to diversify beyond rooms (which creates vulnerability to seasonal dips). The survivors? Those who treat the 8% net margin target as a floor, not a ceiling.
8. Strategies to Maximize Profit Margins
Resort profitability hinges on squeezing incremental gains from every revenue stream while controlling bloated operating costs. The 60% gross margin gives you runway, but net profits evaporate fast without disciplined execution.
Margin Strategies
| Strategy | Expected Lift | Effort | Implementation |
|---|---|---|---|
| Shift bookings to direct channels | +6% | Medium | Build loyalty program to bypass 15-30% OTA commissions |
| Increase ancillary spend per guest | +8% | Medium | Mandatory resort fees ($35+/night) + spa/activity upsells |
| Dynamic seasonal pricing | +7% | Medium | Algorithmic rate adjustments (peak rates 2.3x off-season) |
| Cross-train staff and reduce overtime | +5% | High | Housekeepers serving breakfast during low-occupancy mornings |
| Bundle experiences and packages | +6% | Medium | "Romance Package" with champagne + dinner markup |
| Add events and group business | +9% | High | Wedding minimums ($25k+) with 40% F&B margins |
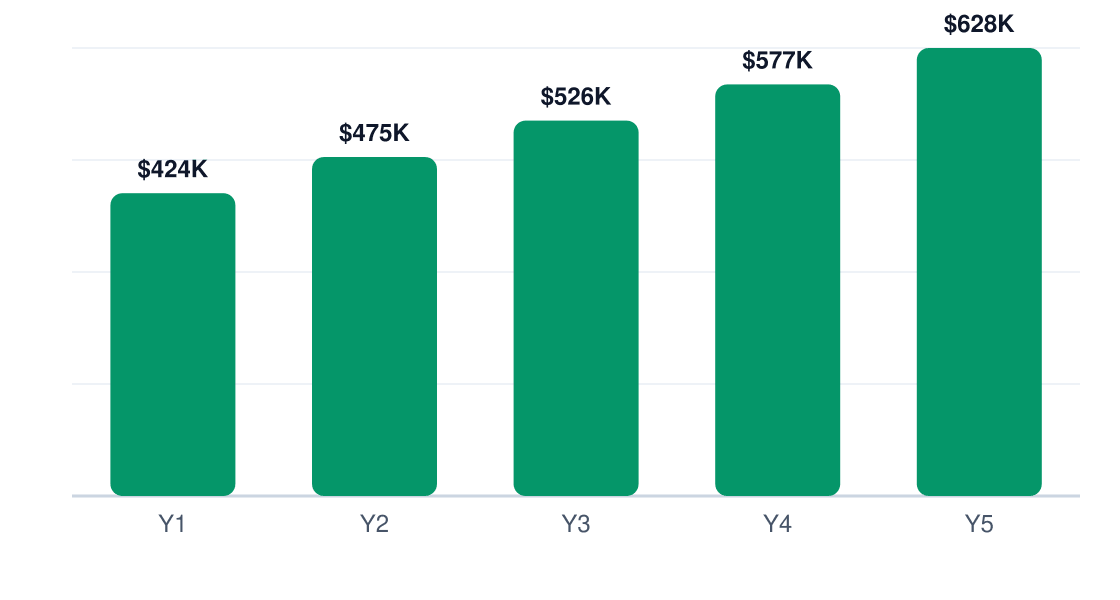
5-Year Net Profit Projection
Projected annual net profit at current margins
Cost-cutting playbook: Renegotiate linen contracts (saves $28k/yr), automate pool chemical monitoring ($15k/yr), switch to bulk amenity dispensers ($9k/yr), and cap overtime at 5% of payroll. Labor eats 42.4% of revenue — every 1% saved drops $22,464 straight to net profit.
Revenue optimization: Premium cabana rentals ($125/day), VIP check-in ($50), and destination dining (12-course tastings at $195/head) outperform room revenue. Recurring memberships (beach club, golf) smooth seasonal cash flow.
Pricing strategy: Base rates should float between $189 (winter) and $429 (summer), with last-minute upgrades pushing suites to $699. Groups pay 22% premium for guaranteed room blocks during shoulder seasons.
9. Final Verdict: Should You Start This Business?
Verdict: Yes, but only if you secure premium real estate and commit to ruthless operational efficiency. The 7/10 profitability score reflects decent upside with substantial execution risk.
Market Factors
| Factor | Score | Weight | Notes |
|---|---|---|---|
| Margins | 8 | 25% | 60% gross is strong but labor-heavy |
| Market size | 7 | 15% | $6.3B SAM leaves room for niches |
| Competition | 5 | 20% | Airbnb and boutique hotels erode share |
| Capital needs | 4 | 25% | $10.5M target budget is prohibitive |
| Scalability | 6 | 10% | Add-on services drive repeat visits |
| Risk | 5 | 5% | Natural disasters and pandemics loom |
ROI Benchmark Comparison (%)
5-year return on initial investment
If you proceed, these must be true:
- You can achieve 65%+ occupancy year-round
- Your land/build costs stay under $8.2M
- Ancillary revenue exceeds 28% of total
- You secure 3+ corporate retreat contracts annually
- Labor stays below 38% of revenue
Walk away if:
- Your location lacks natural attractions (beach/mountain)
- You can't secure financing below 9% interest
- Local minimum wage exceeds $15/hour
Final recommendation: Commit only if you can clear $5.3M Year 1 revenue at 60%+ gross margins, with startup costs capped at $12M. The 40% 5-year ROI justifies the risk — but barely.
Research & Profitability Resources
The following government reports, industry analyses, and financial planning resources were referenced in this resort profitability guide. Each link points to a specific page for direct access.
- Average Profit In The Hospitality Industry — innkeepersinsight.com — Industry profitability research for resort businesses
- The Hospitality Market By Chain Scale A Complete Industry Analysis — mmcginvest.com — Industry profitability research for resort businesses
- Ibisworld — ibisworld.com — IBISWorld industry margin analysis for resort
- How To Start A Resort Business — jim.com — Industry profitability research for resort businesses
- Hotel Profit Margins — vantainsights.com — Industry profitability research for resort businesses