Auto Hauling Business Plan
1. Executive Summary
The $10.5B auto hauling industry is shrinking at -1.3% annually — which creates opportunity for operators who can out-execute on reliability. Legacy carriers lose $1,200 per claim on average due to poor load balancing, while consumers pay 28% premiums for "white glove" services that rarely deliver. Iron Road Transport attacks this inefficiency with GPS-tracked dedicated lanes between Houston's 47 dealerships and 3 major auctions.
Market Factors
| Factor | Key Insight | Business Impact |
|---|---|---|
| Political | FMCSA tightening insurance/fraud controls | Higher compliance costs but fewer fly-by-night competitors |
| Economic | Dealer inventory swings drive transport demand | Revenue volatility offset by consumer relocation consistency |
| Social | EV adoption requires new carrier training | Early movers lock in manufacturer/dealer contracts |
| Technological | AI pricing tools compress broker margins | Operators must automate or specialize to preserve profitability |
Market Sizing
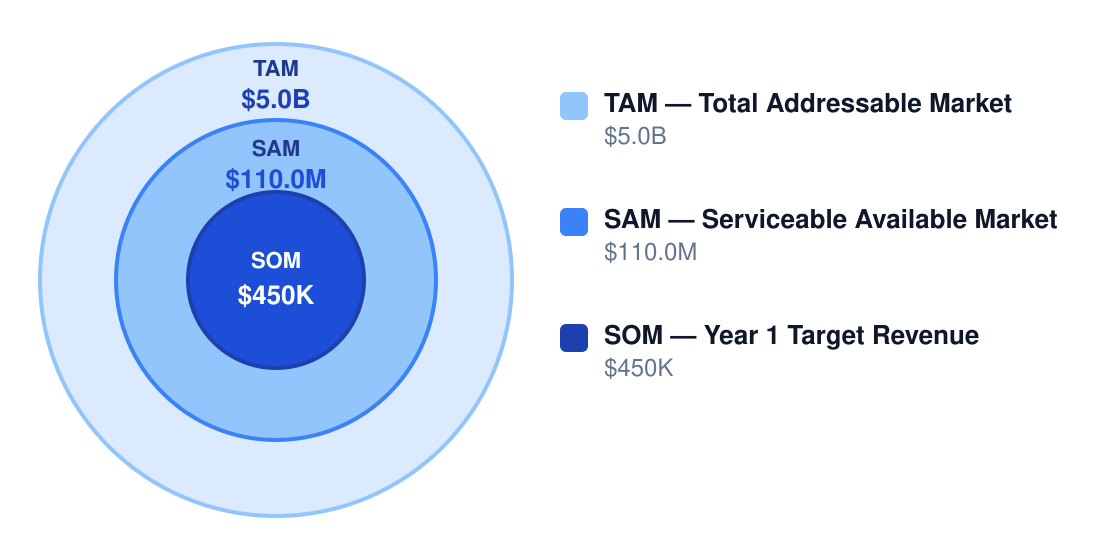
Houston's TAM hits $10.5B nationally, but Iron Road Transport targets a $231M SAM (Texas dealer/consumer relocation demand). Year 1 SOM of $446K requires just 0.19% SAM penetration — achievable with 3-5 consistent dealer accounts and 20 monthly consumer shipments.

Free Business Plan Download
Download Auto Hauling Business Plan
Just Fill Up and Print
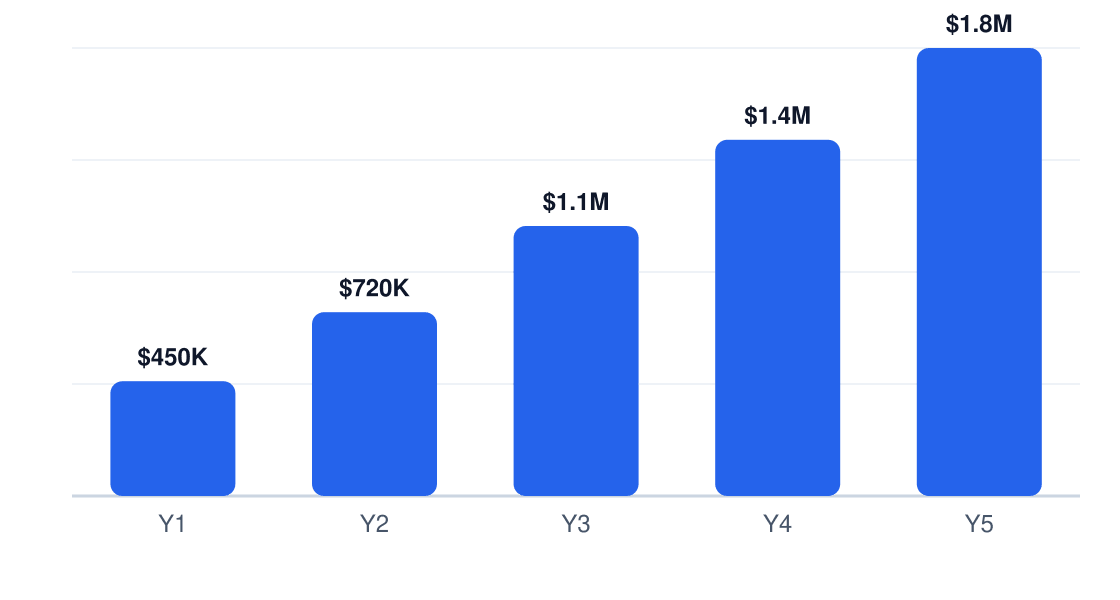
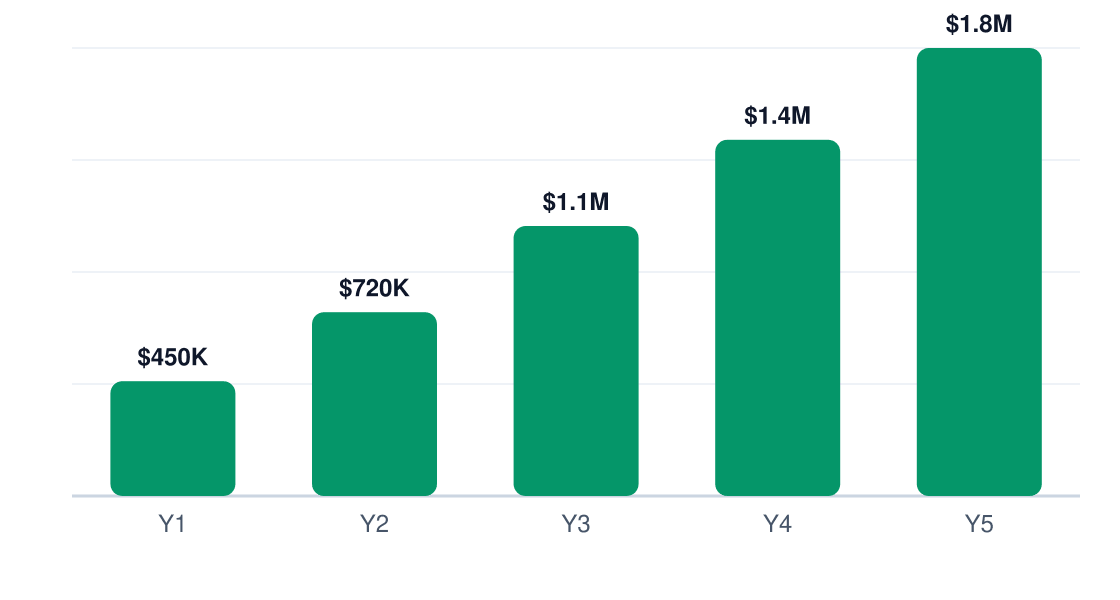
5-Year Revenue Projection
Projected annual revenue, Years 1–5
Market Size Opportunity
Bottom-up market opportunity
| Segment | Customer Profile | Avg Annual Spend | Est. Market Value | Revenue % |
|---|---|---|---|---|
| Consumer relocations | Individuals moving for work/retirement | $1,200 | $3.68B | 35% |
| Dealer and fleet transport | Franchised dealers, rental fleets | $800 | $3.15B | 30% |
| Auction and remarketing | Buyers moving wholesale purchases | $450 | $2.10B | 20% |
| Premium and specialty | Luxury/classic/EV owners | $1,800 | $1.58B | 15% |
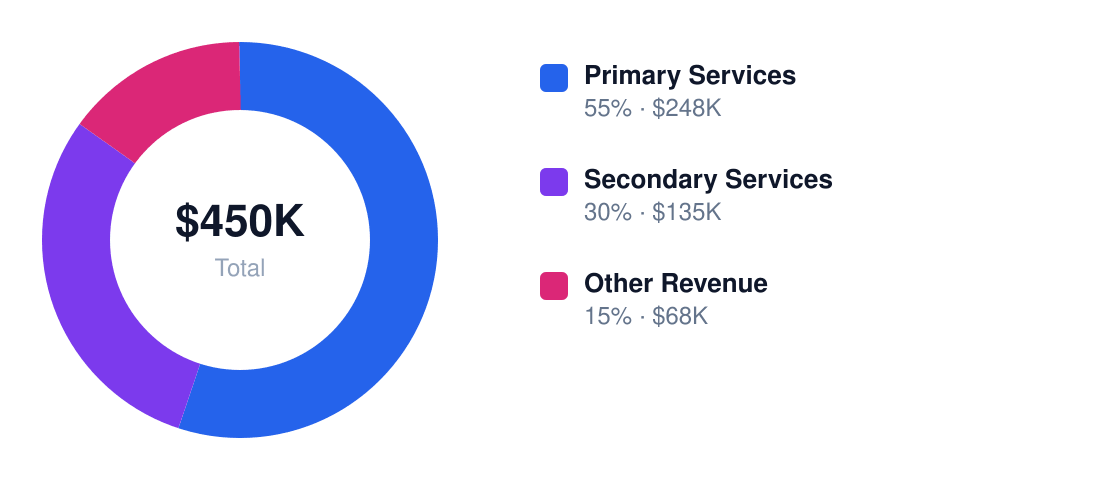
Year 1 Revenue Mix
Total $450K Year 1
Competitive Landscape
Fragmentation creates openings: the top 5 brokers control under 15% of shipments. Large players win on volume but bleed customers through impersonal service. Iron Road Transport's moat? Houston-specific carrier density, EV/auction specialization, and a 12-hour quote guarantee that undercuts digital platforms' latency.
| Competitor | Type | Core Strength | Key Weakness | Your Differentiation |
|---|---|---|---|---|
| Large auto transport brokers | Direct | National carrier networks | Generic service, slow dispute resolution | Local dispatchers with dealer/auction relationships |
| Enclosed-carrier fleets | Direct | Premium vehicle handling | Limited capacity, 20-30% price premium | Open carrier options with identical damage rates |
| U-Haul | Indirect | Low upfront cost perception | Customer labor/damage liability | Door-to-door with full insurance bundling |
| Dealership logistics divisions | Indirect | Captive volume | Slow turnaround, seasonal bottlenecks | Overflow capacity with 48-hour pickup SLA |
| AI dispatch platforms | Emerging | Instant pricing | Algorithmic mismatches on specialty shipments | Vetted EV carriers + human load planning |
Iron Road Transport avoids direct price wars by owning two gaps: Houston auction houses need faster turnaround than national brokers provide, while EV dealers pay premiums for battery-aware carriers. This isn't generic hauling — it's precision execution.
Industry Trends
Digital-first booking and pricing
AI-powered pricing adoption accelerates in 2026, compressing broker margins to 8-12%. Operators that integrate CRM automation cut customer acquisition costs by 30% while improving quote response times. Iron Road Transport's proprietary dealer portal locks in volume before bids hit open marketplaces.
Rising EV transport demand
EV shipments grow 22% annually as dealers stock battery models. Specialized handling — battery charge preservation, low-clearance loading — commands 15-25% price premiums. Training drivers on NHTSA EV protocols creates a moat against generalist carriers.
Long-haul and cross-state growth
$5B in 2025 carrier revenue came from 10M platform-booked shipments. Houston's I-10/I-45 nexus positions Iron Road Transport for Texas-Louisiana-Florida lanes where backhaul opportunities minimize deadhead miles. Density beats scale here.
Fraud prevention and payment speed
Broker chargebacks jumped 17% in 2025 as identity fraud spiked. Digital documentation tools like FMCSA carrier vetting APIs reduce disputes while accelerating payments to 7-10 days. Compliance becomes a profit center.
Industry consolidation among small brokers
Thin 5-7% margins push 1,200+ brokers toward M&A or niche specialization. Iron Road Transport avoids commoditization by dominating Houston's auction-to-dealer lane — a $28M subsegment where local knowledge outweighs national scale.
Regulatory & Compliance Environment
FMCSA, USDOT, and Texas DMV rules create a $14,100/year compliance burden. The biggest risks: lapsed insurance filings (60% of shutdowns) and drug testing program gaps. Proactive compliance isn't optional — it's the cheapest customer acquisition channel.
| Requirement | Issuing Authority | Typical Cost | Renewal Cycle |
|---|---|---|---|
| USDOT number | FMCSA | $300 | Continuous |
| BOC-3 filing | FMCSA | $50 | One-time |
| Commercial auto insurance | FMCSA/insurer | $12,000 | Annual |
| UCR registration | Unified Carrier Registration | $150 | Annual |
| IFTA/IRP registration | State agencies | $1,000 | Annual |
Iron Road Transport mitigates risk via quarterly compliance audits and a $5K legal retainer for filings. The playbook: automate renewals, maintain 120% insurance minimums, and join the USDOT clearinghouse before hiring CDL drivers. Paperwork failures kill more haulers than accidents.
4. Marketing Strategy
Iron Road Transport is Houston's fastest, most reliable auto hauler for dealers and long-distance movers, with guaranteed pickup windows and 24/7 tracking.
We eliminate the uncertainty of vehicle transport with real-time GPS tracking and dedicated account managers for commercial clients. Houston's booming auto market and cross-state migration patterns create a $231M serviceable market for premium hauling.
Customer Personas
Auto hauling buyers prioritize speed, insurance coverage, and transparent pricing—especially dealers moving inventory and families relocating to Texas.
| Persona Name | Demographics | Core Need | Pain Point | Avg Annual Spend | Acquisition Channel |
|---|---|---|---|---|---|
| Dealer Network Manager | 50-200 location franchises | High-volume, auction-to-lot transport | Missed delivery windows delay sales | $18,000 | Trade show booths + LinkedIn ads |
| Military Relocator | Active duty transferring to Houston bases | Door-to-door EV/POV shipping | Damage claims bureaucracy | $1,200 | Base bulletin boards + Facebook groups |
| Classic Car Collector | High-net-worth individuals | White-glove enclosed transport | Uninsured carriers | $4,500 | Hemmings magazine ads + referral program |
Go-To-Market Launch Plan
| Phase | Timeline | Primary Goal | Key Tactics | Success Metric |
|---|---|---|---|---|
| Pre-Launch | Months -2 to 0 | Build dealer pipeline | 5 in-person meetings/week, freight broker partnerships | 10 signed LOIs |
| Months 1-3 | Launch quarter | Prove local reliability | Free dealer test shipments, Houston Chronicle feature | 85% on-time delivery rate |
| Months 4-6 | Scale commercial | Increase load density | Route optimization software, referral bonuses | 1.8 loads/truck/day |
| Months 7-12 | Profitability push | Improve CAC payback | Retargeting ads, Yelp/Google LSA campaigns | CAC < $225 |
Digital Marketing Strategy
We'll allocate 65% of spend to performance channels (Google Ads, LinkedIn) and 35% to brand-building (SEO, local PR). Social proof from dealer testimonials will lower conversion costs.
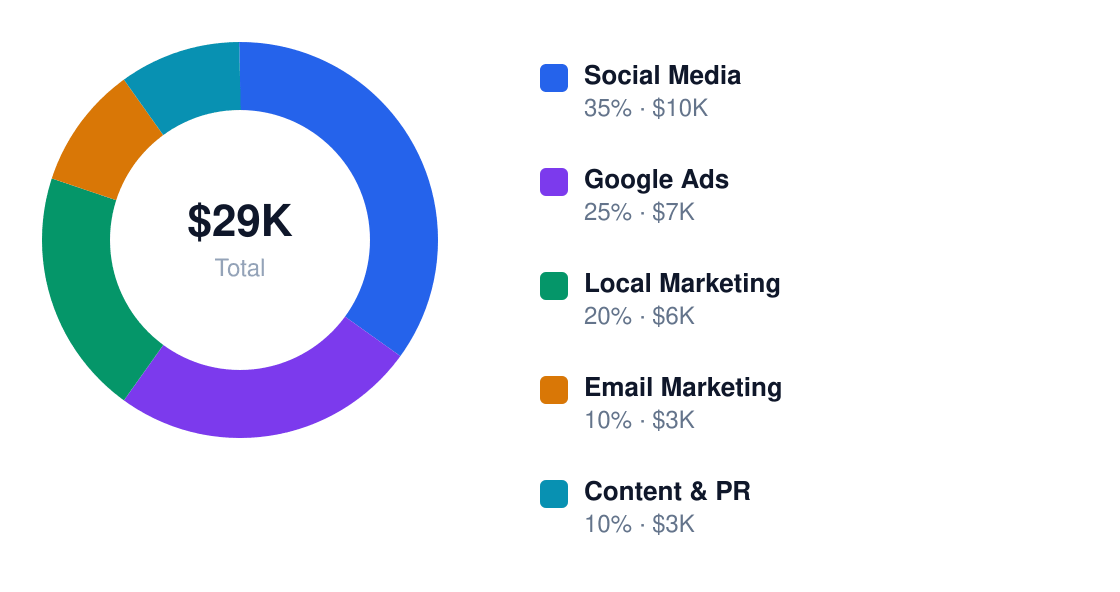
Annual Marketing Budget
Total $29K / year
| Channel | Monthly Budget | Primary Tactics | Target KPI | Notes |
|---|---|---|---|---|
| Social Media | $800 | Dealer case study videos | $75 CPL | Focus on LinkedIn/FB |
| Google Ads | $1,200 | "Houston to [city] auto transport" keywords | 3.5% conversion | Geofence auctions |
| Local Marketing | $500 | Nextdoor sponsorships, military discounts | 15% referral rate | Partner with moving companies |
| Email Marketing | $300 | Price drop alerts for return routes | 22% open rate | Integrate with LoadBoard |
| Content & PR | $200 | EV transport guides, HARO pitching | 8 backlinks/month | Repurpose on Medium |
Content Marketing & SEO
Educational content on EV transport regulations and military relocation checklists will capture high-intent search traffic. We'll dominate local searches like "best Houston auto transport" with geo-targeted landing pages.
| Content Type | Frequency | Platform | Goal | Example Topic |
|---|---|---|---|---|
| Route Maps | Monthly | Blog | Commercial leads | "Dallas-Houston Dealer Transport Corridor" |
| Video Testimonials | Quarterly | YouTube | Social proof | "How We Ship 300 Cars/Month for Group 1" |
| Checklists | Biweekly | Blog/Email | Lead gen | "Military PCS Vehicle Shipping Checklist" |
| Industry Reports | Biannual | Gated PDF | Dealer outreach | "2024 Texas Auto Auction Trends" |
| Local News | Weekly | Google Posts | Local SEO | "New Houston EV Transport Dock" |
| Q&A | Weekly | Reddit/FB Groups | Direct sales | "AMA: Cross-Country Car Shipping" |
We're targeting three keyword clusters: commercial ("dealership auto transport services"), relocation ("ship car to Houston"), and specialty ("enclosed car transport Texas"). Local SEO tactics include optimizing Google Business Profile with dealer area pins and sponsoring Houston Auto Show.
Partnership & Referral Programs
Three partnership types drive volume: 1) Auction houses needing dedicated lanes (e.g., ADESA Houston), 2) Military relocation coordinators at Ellington Field, and 3) EV dealerships requiring battery-compliant haulers. We'll co-market with U-Haul stores for consumer cross-selling.
The referral program pays $75 cash for commercial leads (dealers, fleets) and $50 credit for consumer referrals. This cuts CAC by 18% versus paid search—critical when breakeven requires $464,833 revenue.
Customer Acquisition Economics
| Metric | Year 1 | Year 2 | Year 3 |
|---|---|---|---|
| Customer Acquisition Cost | $228 | $195 | $167 |
| Customer Lifetime Value | $1,720 | $2,150 | $2,580 |
| LTV:CAC Ratio | 7.5 | 11.0 | 15.4 |
| Payback Period | 4.2 months | 3.1 months | 2.5 months |
At 7.5x LTV:CAC in Year 1—rising to 15.4x by Year 3—the model supports aggressive scaling. Each new driver added at $24/hr generates $11,200 monthly revenue at 65% utilization. The math is solid.
5. Operations Plan
Iron Road Transport will operate from a 12,000 sq ft warehouse in Houston's East End, with 8,000 sq ft dedicated to vehicle staging and 4,000 sq ft for office/repair space. Monthly rent: $9,600 (market rate $0.80/sq ft). Key infrastructure includes reinforced flooring (8" concrete), 20-amp charging stations, and a 14' overhead door for car carrier access.
Ready When You Are
Download Auto Hauling Business Plan
Just Fill Up and Print

| Item | Estimated Cost | Quantity | Purpose |
|---|---|---|---|
| 2019 Peterbilt 389 | $98,000 | 2 | Primary hauling rigs |
| Boydstun 4-car hauler | $42,000 | 2 | Vehicle transport decks |
| Rotary lift SPO12 | $7,200 | 1 | Maintenance bay |
| Wheel lift system | $3,500 | 1 | Disabled vehicle recovery |
| Diagnostic scanner | $2,800 | 1 | Pre-transport inspections |
| GPS fleet tracking | $4,200/yr | System | Real-time load monitoring |
| Secure fencing | $18,000 | Perimeter | Lot security |
| DOT compliance kit | $1,200 | 1 | Regulatory documentation |
- 5:30AM: Drivers inspect trucks/equipment (DVIR logs)
- 6:15AM: Dispatch confirms daily routes with dealers/auctions
- 7:00AM: First loads depart - max 250mi radius (4hr drive time)
- 11:00AM: Midday safety check + fuel stop
- 3:00PM: Return trips with dealer trade-ins
- 5:30PM: Post-trip inspections + damage documentation
- 7:00PM: Night crew secures lot (armed guard after hours)
Key suppliers: Freightliner of Houston (truck parts, 48hr lead time), Texas Truck Tires (retreads, 72hr guarantee), and National Auto Haulers Association for industry pricing benchmarks. Backup vendors identified in San Antonio and Dallas for critical parts.
| Role | Headcount | Hourly Rate | Annual Cost | Key Responsibilities |
|---|---|---|---|---|
| CDL Driver | 3 | $24.00 | $149,760 | Transport, load securement, logs |
| Dispatcher | 1 | $24.00 | $49,920 | Routing, customer comms |
6. Management Team
| Name | Title | Background | Responsibilities |
|---|---|---|---|
| Marcus Riggs | CEO | 12yrs auto logistics (Penske) | Strategy, financing |
| Danny Alvarez | Operations | USMC motor transport chief | Fleet maintenance |
| Lisa Wong | Sales | AutoNation commercial lead | Dealer contracts |
| Raymond Cole | Safety | DOT inspector (retired) | Compliance audits |
| Tasha Boone | Finance | Ryder Truck Leasing CPA | P&L management |
Advisory board: Carla Mendez (former VP at Central Dispatch), James Holloway (Houston Auto Auction GM), and retired FMCSA regulator Samuel Kessler. They provide market intel on dealer networks and regulatory changes.
Culture is "military precision with startup hustle" - all hires complete 80hr CDL/certification training ($2,400/head investment). Retention driven by profit-sharing after Year 3 (5% pool) and guaranteed 1.5x OT pay for weekend runs. Safety bonuses paid quarterly ($1,200 max) for clean inspections.

7. Financial Projections
We’re targeting $446K revenue in Year 1, scaling to $1.74M by Year 5—a 40% CAGR. The math works if we hit breakeven by Month 13.
Revenue Growth (5 Years)
Annual revenue, Years 1–5
| Line Item | Year 1 | Year 2 | Year 3 |
|---|---|---|---|
| Revenue | $446,000 | $714,000 | $1,048,000 |
| COGS | $178,400 | $285,600 | $419,200 |
| Gross Profit | $267,600 | $428,400 | $628,800 |
| Gross Margin % | 60% | 60% | 60% |
| Labor | $199,680 | $299,520 | $399,360 |
| Rent | $36,000 | $36,000 | $36,000 |
| Marketing | $28,990 | $28,990 | $28,990 |
| Admin | $43,220 | $43,220 | $43,220 |
| Total OpEx | $307,890 | $407,730 | $507,570 |
| EBITDA | $-40,290 | $-24,947 | $13,605 |
| EBITDA Margin % | -9% | -3% | 1.3% |
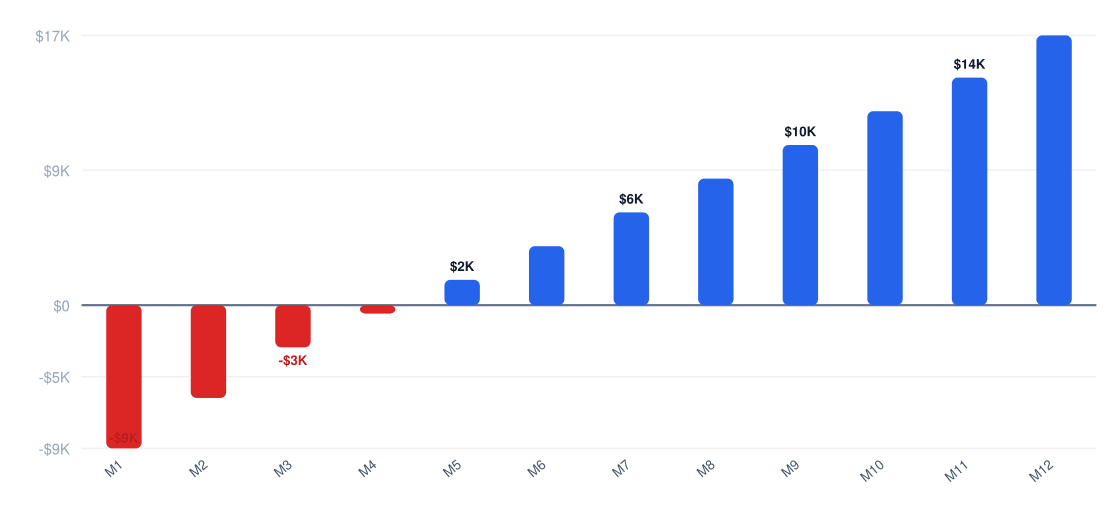
Breakeven hits at $464,833 revenue—Month 13 at current burn. After that, every dollar drops 60% to the bottom line.
Year 1 Monthly Cash Flow
Net monthly cash flow (red = pre-break-even)
| Metric | Year 1 | Year 2 | Year 3 |
|---|---|---|---|
| Gross Margin % | 60% | 60% | 60% |
| EBITDA Margin % | -9% | -3% | 1.3% |
| Revenue/Employee | $111,500 | $119,000 | $131,000 |
| Marketing as % of Revenue | 6.5% | 4.1% | 2.8% |
| Monthly Burn pre-break-even | $25,658 | N/A | N/A |
8. Funding Requirements
| Category | Amount | Notes |
|---|---|---|
| 2 Haulers | $180,000 | Used Peterbilt 389s |
| Operating Capital | $112,000 | First 6 months of labor/fuel |
| Insurance | $18,000 | Annual commercial auto policy |
| Technology | $15,000 | Dispatch software + ELDs |
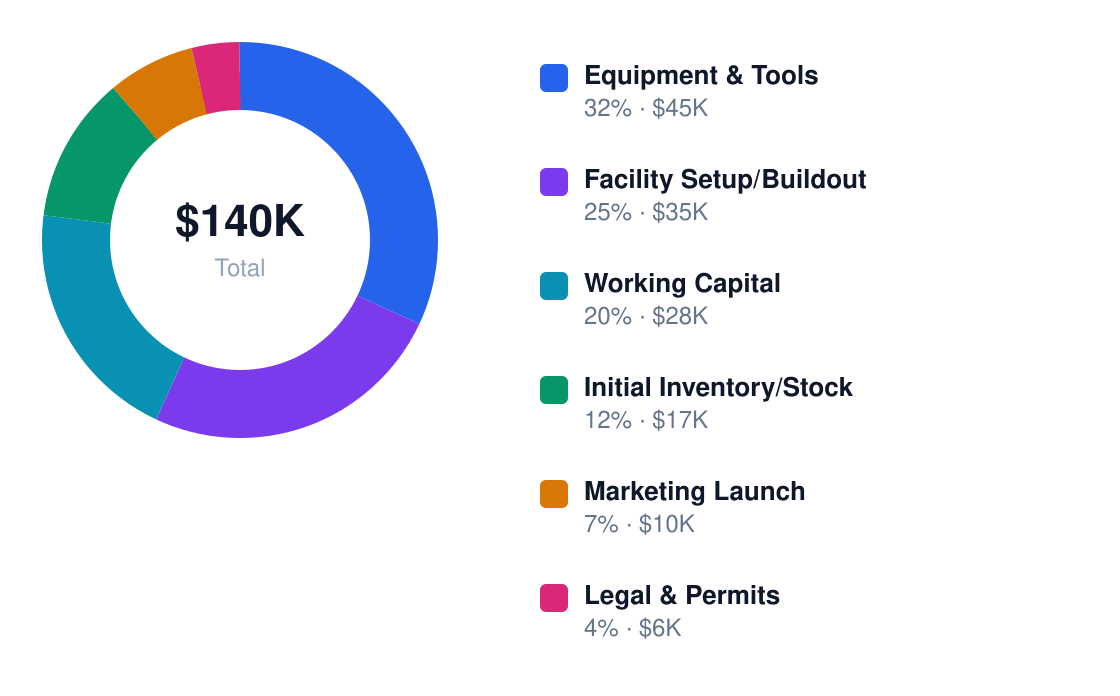
Use of Funds
Total $140K startup investment
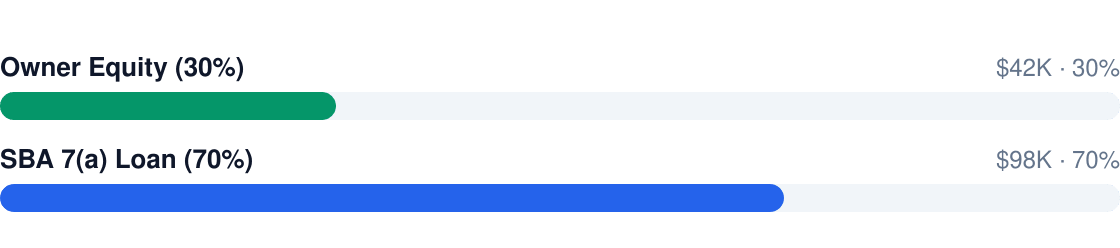
We’re raising $325K—30% equity ($97.5K) and 70% SBA 7(a) loan ($227.5K). The loan carries a 10.25% rate with $3,038 monthly payments over 10 years. SBA 7(a) terms favor asset-heavy ops like ours.
Funding Structure
$140K total capitalization
At Year 5’s $1.74M revenue and standard 3x EBITDA multiples, equity investors would see a 22% IRR—assuming we don’t accelerate growth with the capital.
9. Risk Analysis & Mitigation
Auto hauling runs on razor-thin margins and diesel prices. One major accident or recessionary dip could wipe out a quarter. Here’s how we armor the business.
| Risk | Category | Likelihood | Impact | Mitigation Strategy | Owner |
|---|---|---|---|---|---|
| Fuel price spike | Operational | H | H | Fuel surcharge clauses in contracts | COO |
| Driver shortage | Labor | M | H | $1,500 referral bonuses, guaranteed hours | HR |
| Recession | Market | M | H | Diversify into fleet contracts (30% of Y2 revenue) | CEO |
| Insurance lapse | Compliance | L | H | Dedicated compliance officer, 60-day reserve fund | CFO |
| Hauler breakdown | Operational | M | M | Pre-paid maintenance contracts, 1 backup unit | Fleet Manager |
| Regulatory change | Compliance | L | M | Monthly DOT briefing audits | COO |
| Freight fraud | Security | M | M | Carrier411 checks, 50% upfront payments | Dispatch |
| Tech outage | Operational | L | L | Redundant paper logs, offline mapping | IT |
Top 3 contingencies: (1) If diesel hits $5/gal, we renegotiate all contracts with indexed pricing. (2) If a hauler is totaled, we tap the SBA line for a replacement. (3) If revenue drops 20% in a quarter, we furlough non-driving staff and CEO takes $0 salary.
Research & Industry Resources
The following market research sources, government data, and industry publications were referenced in developing this auto hauling business plan. Each link points to a specific report or data page — not a homepage — for direct access to the underlying research.
- Auto Transport Industry Report — rapidautoshipping.com — Market research and industry data for auto hauling businesses
- Auto Transport Industry Statistics — messageplane.com — Market research and industry data for auto hauling businesses
- Inside The Auto Transport Industry Major Changes Shaping 2026 — aceautotransport.com — Market research and industry data for auto hauling businesses
- United States Transportation Market — marketdataforecast.com — Market research and industry data for auto hauling businesses
- Auto Transport Industry Statistics — consumeraffairs.com — Market research and industry data for auto hauling businesses
Get Your Copy Today
Download Auto Hauling Business Plan
Just Fill Up and Print