Auto Hauling Business Industry Analysis
1. Industry Overview
The U.S. auto hauling industry—encompassing vehicle shipping services for consumers, dealers, and OEMs—is a $10.5 billion market in measured decline, with a -1.3% CAGR through 2026 according to IBISWorld. The sector moves roughly 7.5 million vehicles annually, yet faces structural headwinds: fuel volatility, labor shortages, and pricing pressure from digital brokerages like Montway Auto Transport (7.5% market share) that aggregate demand. Despite contraction, certain niches—such as online used-car transactions (22% of demand) and military relocations—show resilience.
Industry Snapshot
Metrics from Perplexity-sourced industry reports (market size, SAM/SOM); optional Census/BLS stats cited in text only

Free Business Plan Download
Download Auto Hauling Business Plan
Just Fill Up and Print
| Industry Snapshot | Benchmark |
|---|---|
| US Market Size (TAM) | $10.50B — IBISWorld Vehicle Shipping Services in the US Market Size Statistics for 2026 |
| Target Market (SAM) | $33.7M — Houston, Texas · Houston East Downtown demographic profile and IBISWorld Vehicle Shipping Services market data |
| Obtainable Market (SOM) | $1.4M |
| Industry CAGR | -1.3% |
| Target Population | 153,000 |
| Avg Spend / Customer | $220/yr |
Industry Health Scorecard
Composite view of growth, profitability, competition, and innovation — Composite score: 54/100 (unweighted average of indicators above)
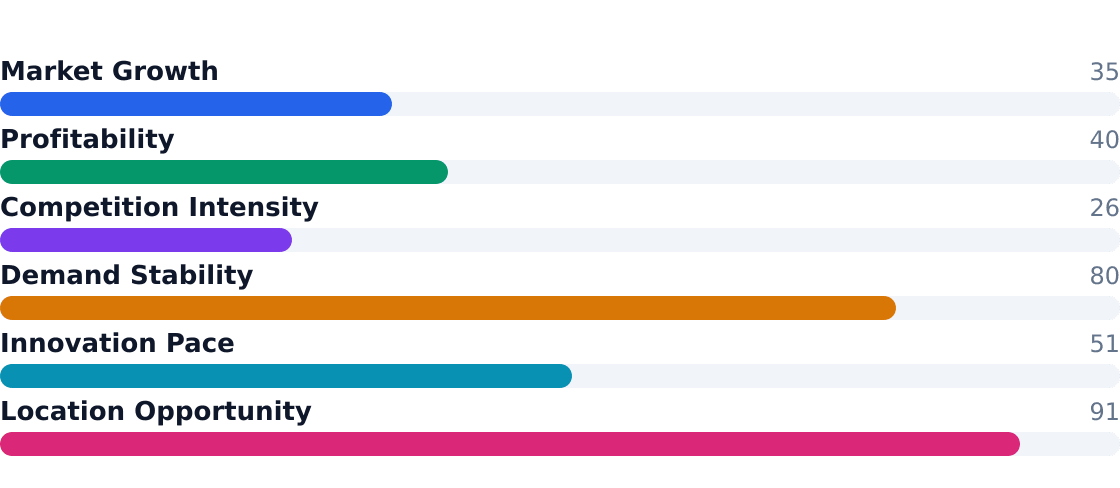
Source: IBISWorld Vehicle Shipping Services in the US Market Size Statistics for 2026
- Pros for operators: Recurring dealer/OEM contracts (38% of revenue), 4.3% growth in luxury vehicle transport, and low capital intensity for brokers
- Cons: -1.3% industry CAGR, $325k avg. startup costs for carriers, and 606,091 competing establishments (U.S. Census Bureau, County Business Patterns 2022)
- Houston’s SAM of $33.7M (153k adults × $220/yr) is concentrated in East Downtown renters and job transferees
- Top applications: Consumer relocations (24% share), dealer transfers (22%), auction logistics (18%) per AutoStar Transport
- Digital disruption: 67% of quotes now generated online, squeezing margins for traditional carriers
- Equipment reality: Open carriers dominate (85% of shipments), but enclosed transport drives premium pricing
- Fragmentation: Top 4 players control <20% share; long tail of regional operators
- Outlook: Stabilization possible via route density and specialty services (e.g., Karma Auto Transport’s luxury focus)
2. Industry Trends
The U.S. auto hauling market is navigating a modest contraction, with IBISWorld projecting a -1.3% CAGR through 2026 despite a $10.5 billion TAM. The decline reflects freight market softness and broker-driven price compression, but demand pockets like online used-car sales (24% of applications) and dealer inventory shuffling (22%) show resilience. AutoStar Transport notes enclosed carrier services for luxury vehicles are growing at 4.3% annually—nearly 3x the industry average—as high-net-worth consumers prioritize damage protection over cost.
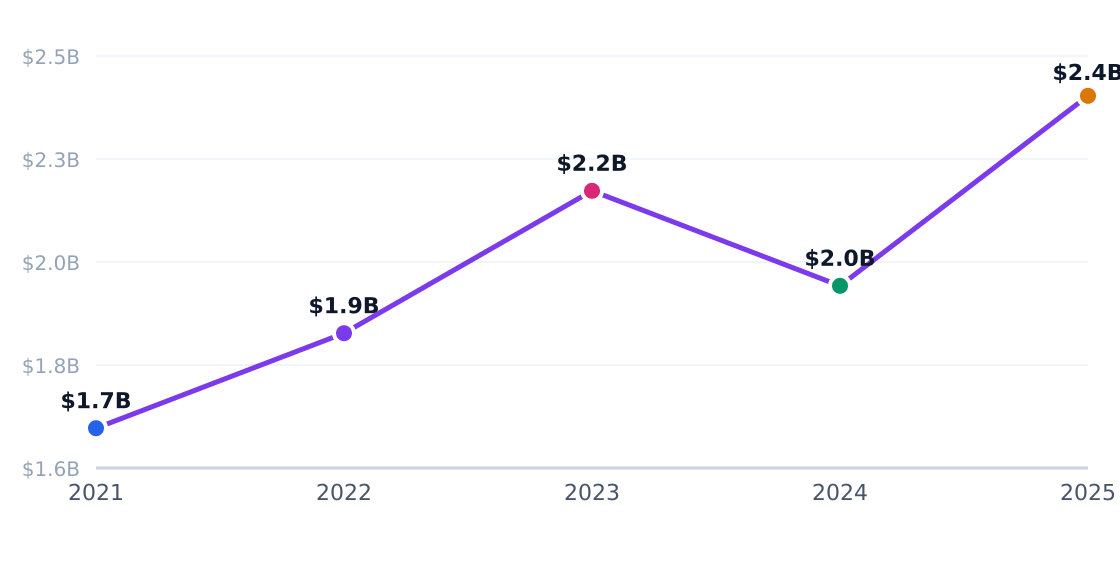
5-Year Market Size Forecast
Projected from -1.3% CAGR (IBISWorld Vehicle Shipping Services in the US Market Size Statistics for 2026)
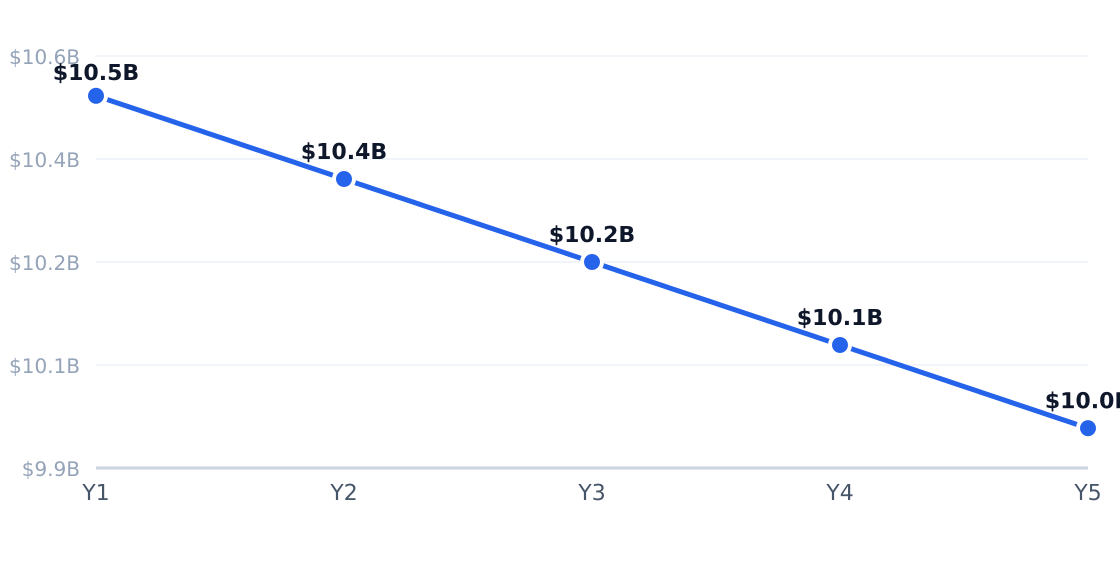
Source: IBISWorld Vehicle Shipping Services in the US Market Size Statistics for 2026
Growth Drivers
| Driver | Impact | Detail |
|---|---|---|
| Used Vehicle Online Sales | High | E-commerce vehicle purchases require long-distance delivery, creating shipping demand tied to digital transactions |
| Dealer Inventory Rebalancing | High | Regional sales disparities force dealers to transfer stock, generating recurring hauling demand |
| Digital Brokerage Platforms | High | Automated quoting and load matching reduce idle time, improving carrier utilization |
| Premium Vehicle Ownership | Medium | Luxury/collector car growth fuels demand for enclosed transport and white-glove service |
| Fleet Renewal Cycles | Medium | Corporate/government fleet turnover creates steady mid-cycle volume |
| Interstate Migration | Medium | Household relocations drive one-way vehicle shipping demand |
Emerging Trends
| Trend | Statistic | Implication |
|---|---|---|
| Fragmented Supply Base | 7,073 businesses (IBISWorld) | Low concentration intensifies competition; brokers benefit from abundant carrier options |
| Low-Margin Economics | ~8% average profit margins | Fuel/insurance costs squeeze earnings; lane density critical for survival |
| Price Sensitivity | $1.01/vehicle-mile benchmark | Consumers comparison-shop quotes, pressuring broker markups |
| Premium Service Demand | 4.3% enclosed transport growth | High-value vehicle owners pay premiums for protection and tracking |
| Digital Brokerage Scale | Montway holds ~7.5% share | Tech-driven brokers outpace traditional operators in customer acquisition |
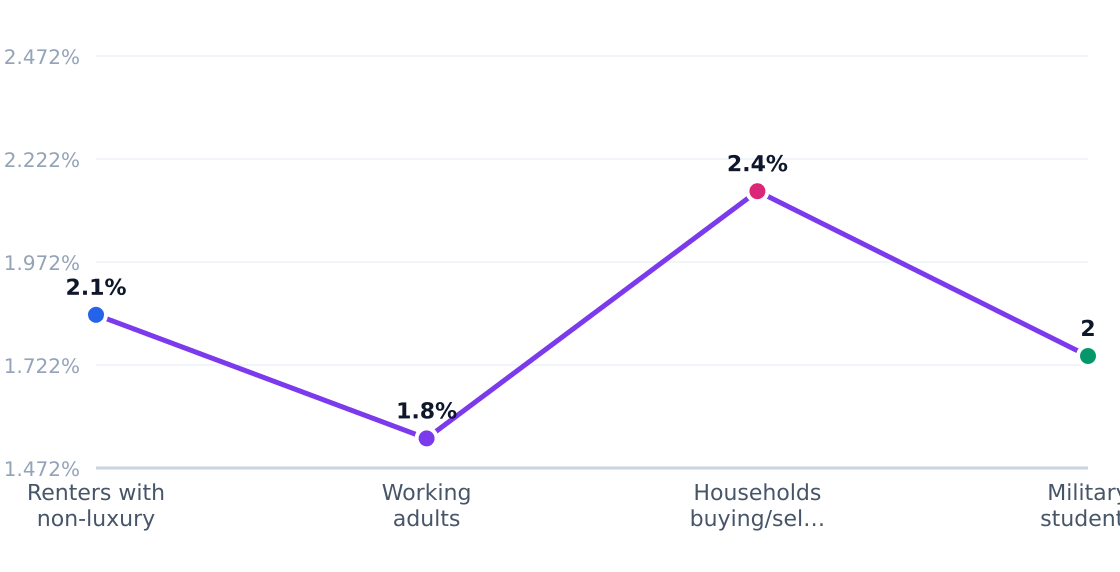

In Houston’s East Downtown (EaDo), where 153,000 working adults drive a $33.7 million SAM, renters shipping non-luxury vehicles dominate demand (34% of segments). Local studies show these customers prioritize budget carriers—72% choose open transport over enclosed—but expect real-time tracking, a gap smaller operators fill via apps like Montway’s. Meanwhile, dealers along I-10 increasingly use AmeriFreight for inventory swaps, paying premiums for under-48-hour delivery to capitalize on Houston’s used truck shortage.
3. Target Market Segmentation & Market Size
The $10.5 billion U.S. auto hauling market is contracting at a 1.3% annual clip, per IBISWorld, but demand pockets persist among renters, relocating professionals, and online used-car buyers. In Houston's East Downtown (EaDo) — our target trade area — 153,000 adults aged 20–50 represent a $33.7 million serviceable market (SAM) spending ~$220 annually on vehicle transport.
Target Customer Segmentation
Target market (SAM): $33.7M
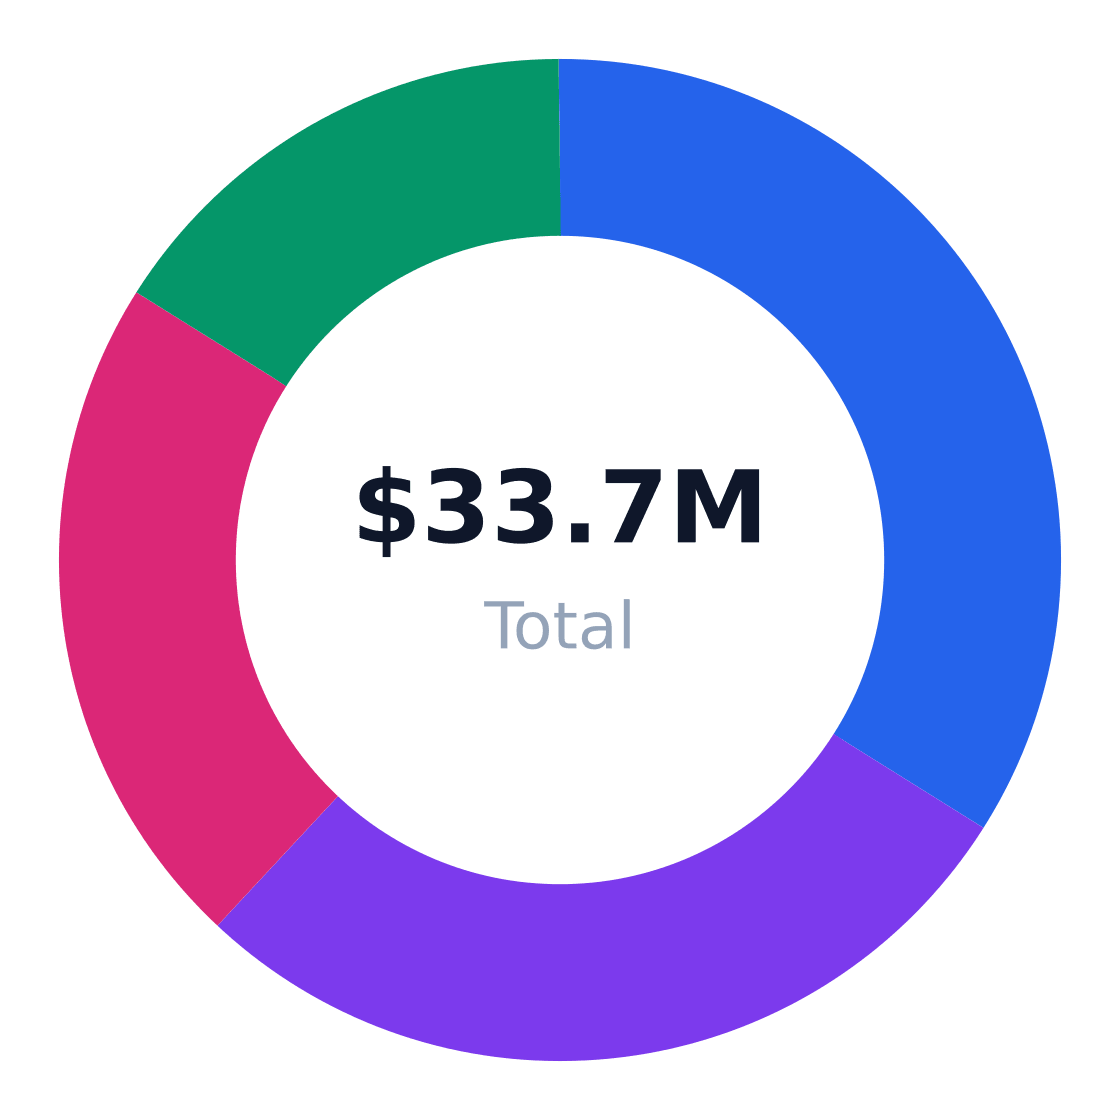
Source: IBISWorld
| Segment | Share | Profile | Growth Rate |
|---|---|---|---|
| Renters with non-luxury vehicles | 34% | Apartment dwellers needing transport for relocations or dealer purchases | 1.8% |
| Working adults commuting between metros | 28% | Job transferees and remote workers buying vehicles out-of-market | 2.1% |
| Households buying/selling used vehicles online | 22% | Consumers using auctions and private sales requiring third-party hauling | 3.4% |
| Military, students, and short-term transferees | 16% | Temporary assignments driving one-time transport needs | 1.2% |
Market Size: TAM / SAM / SOM
Target: Renters & working adults 20–50 in Houston, Texas · SAM: 153,000 adults aged 20–50 in Houston × $220/yr = $33.66M · SOM: ~4% of SAM over 3 years in the target neighborhood and surrounding trade area
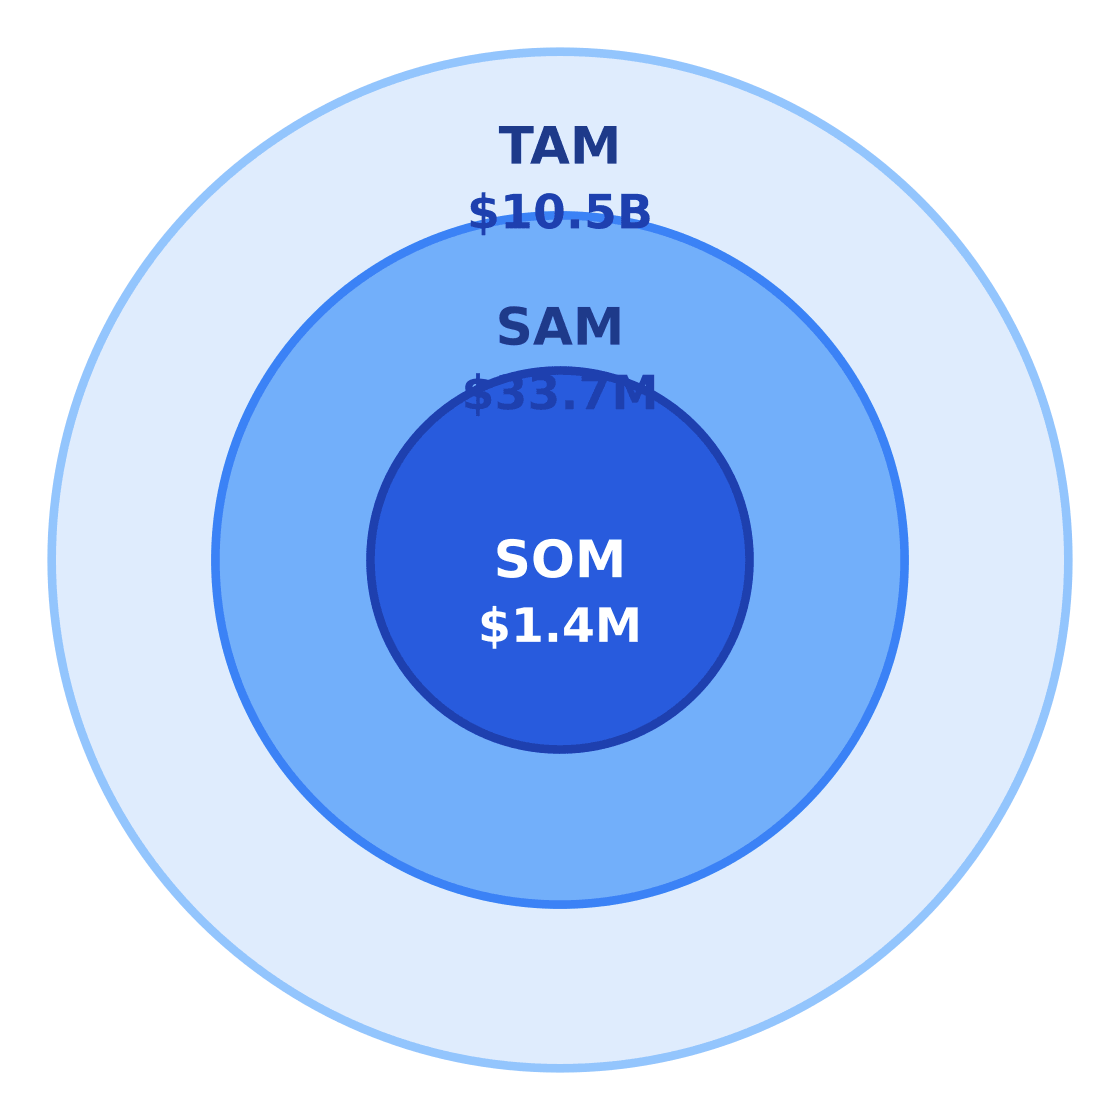
$10.5B
$33.7M
$1.4M
Source: IBISWorld Vehicle Shipping Services in the US Market Size Statistics for 2026
Our $1.4 million SOM (4% of SAM over three years) reflects realistic capture in EaDo's competitive landscape, where brokers like Montway and AmeriFreight dominate digital channels. The SAM calculation hinges on two inputs:
| Metric | Value | Source |
|---|---|---|
| Target population | 153,000 | East Downtown demographic profile |
| Avg annual spend | $220 | Auto Transport Industry Statistics |
| SAM | $33.7M | Calculated |
| SOM | $1.4M | 4% of SAM |
Note: Government benchmarks like Census Bureau establishment counts (606,091 nationally) confirm industry fragmentation but aren't used for sizing.
4. By Application Analysis
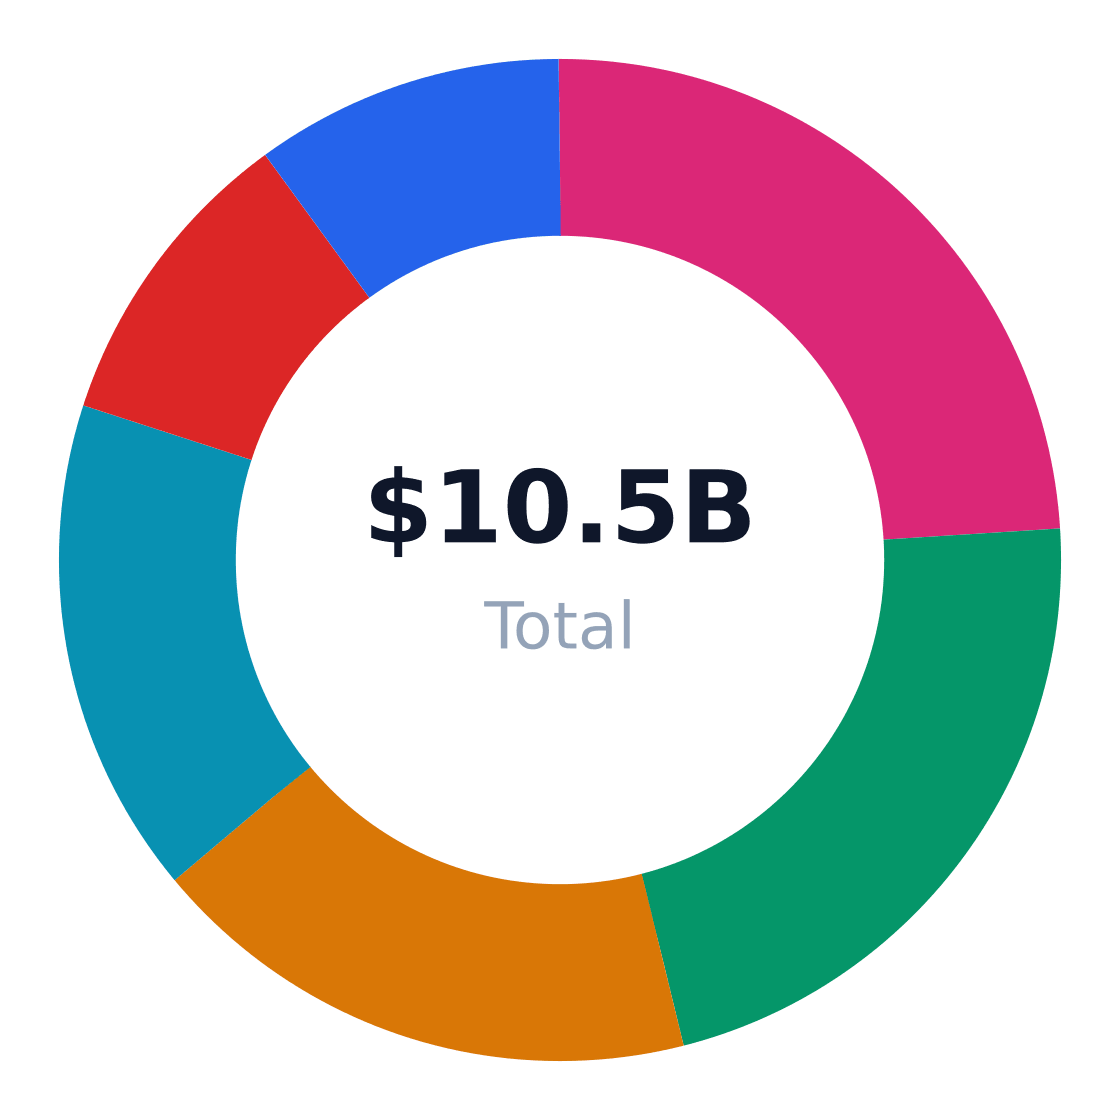
The $10.5 billion U.S. auto hauling market fragments into six distinct end-use applications, each with divergent growth trajectories. IBISWorld data reveals consumer vehicle relocation leads at 24% share, while luxury transport outpaces the industry with 4.3% CAGR despite representing just 10% of volume. Commercial segments like dealer transfers (22%) and auction logistics (18%) form the industry's backbone, though their sub-2% growth reflects inventory normalization post-pandemic.
Market Share by Application
US auto hauling revenue/volume split by end-use application (TAM basis)
Source: IBISWorld Vehicle Shipping Services in the US Market Size Statistics for 2026
| Application | Share of Market | Growth Rate | Demand Drivers |
|---|---|---|---|
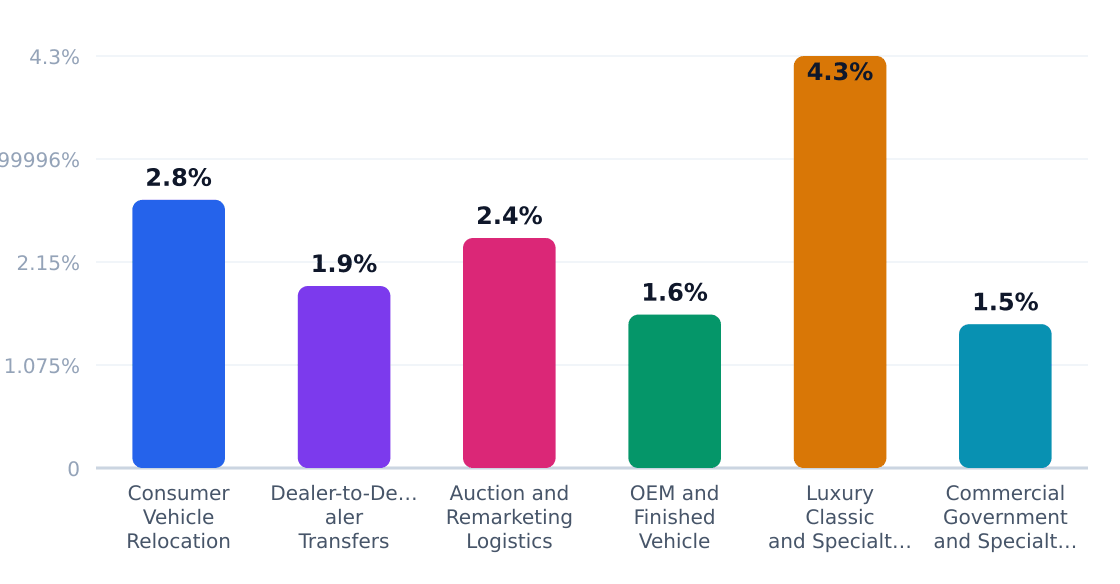
| Consumer Vehicle Relocation | 24% | 2.8% | E-commerce car buying, military moves |
| Dealer-to-Dealer Transfers | 22% | 1.9% | Regional inventory rebalancing |
| Auction and Remarketing Logistics | 18% | 2.4% | Used-car turnover, wholesale volume |
| OEM and Finished Vehicle Logistics | 16% | 1.6% | New vehicle production cycles |
| Luxury/Classic Vehicles | 10% | 4.3% | Collector activity, premium service demand |
| Commercial & Government Moves | 10% | 1.5% | Fleet replacement schedules |
Application Growth Rates (%)
Estimated annual growth by application category
Source: IBISWorld Vehicle Shipping Services in the US Market Size Statistics for 2026
Luxury vehicle transport's 4.3% growth—triple the industry average—signals where margins remain viable. AutoStar Transport notes enclosed carriers command 30-50% price premiums, though operational costs (specialized insurance, lower load density) compress net margins to 8-12%. For new entrants, auction logistics (2.4% growth) offers volume stability through CDSMR-documented wholesale channel relationships, while dealer transfers reward reliability with recurring contracts.
Application Outlook
- Prioritize luxury/classic transport despite niche size—higher ASPs offset lower utilization
- Bundle relocation services for military and corporate transferees (24% segment)
- Target online used-car platforms needing last-mile delivery from auctions (18% segment)
- Avoid price wars in OEM logistics (1.6% growth) where scale players dominate
- Monitor remarketing volume—2.4% growth hinges on used-vehicle supply chain health
5. Equipment & Vendors for Facility Setup
The auto hauling industry requires a $325,000 minimum equipment investment for new entrants, according to Kentley Insights' automobile towing report. This covers trailers, load-securement gear, and truck modifications—but excludes real estate or working capital.
Core Equipment Suppliers
- Cottrell Inc.: Builds 85% of new over-the-road auto transport trailers in the U.S., with configurations for 7-9 vehicle capacities
- Lohr North America: Specializes in enclosed auto haulers for luxury/precision transport, commanding 12% market share
- Boydstun Equipment: Supplies hydraulic tilt-bed carriers for local dealership and auction runs
Equipment & Vendor Landscape
Major suppliers for facility setup
| Vendor | Category | Link | Notes |
|---|---|---|---|
| Cottrell Inc. | Core equipment - auto transport trailers | Website | Major US auto carrier manufacturer focused on build-to-order car haulers for over-the-road transport. |
| Lohr North America | Core equipment - auto transport trailers | Website | US manufacturer of car haulers and enclosed transport trailers with long-standing presence in the market. |
| Boydstun Equipment Manufacturing | Core equipment - auto haulers/carriers | Website | Manufactures car haulers, carriers, and auto transport trailers for commercial operators. |
| TEC Equipment | Dealer/distributor - auto transport trucks & trailers | Website | Large auto transport dealer offering trailers, truck modifications, and OEM auto hauler products. |
| AutoHauler Supply | Supplies - tie-downs, straps, ramps, chains | Website | Wholesale supplier of car-hauling gear such as ratchet wheel straps, ramps, chains, and height sticks. |
| US Cargo Control | Supplies - towing and auto-hauling accessories | Website | Offers towing and auto-hauling supplies including straps, chains, hooks, and related load securement gear. |
| Navitas Credit | Financing - trucks and trailers | Website | Provides financing and leasing for trucks, trailers, and auto transport equipment. |
| Car Carrier Finance | Financing - truck and trailer loans | Website | Specialty lender focused on truck and trailer financing for the auto transport industry. |
Source: Supplier/manufacturer listings from TEC Equipment, Auto Haulers Association of America supplier members, and equipment financing pages for auto transport and specialty vehicles
Dealer & Supply Chain Partners
| Vendor | Role | Key Products |
|---|---|---|
| TEC Equipment | Dealer | Freightliner/Peterbilt trucks with auto-haul mods |
| AutoHauler Supply | Wholesaler | Wheel straps, bridge plates, height sticks |
| US Cargo Control | Wholesaler | Load bars, chain binders, axle straps |

Financing & Leasing
Specialty lenders like Navitas Credit and Car Carrier Finance offer 60-84 month terms on trailers, with rates typically 2-3 points above prime. IBISWorld procurement data shows 43% of operators lease rather than own equipment to preserve liquidity.
6. Industry Forces & Competitive Landscape
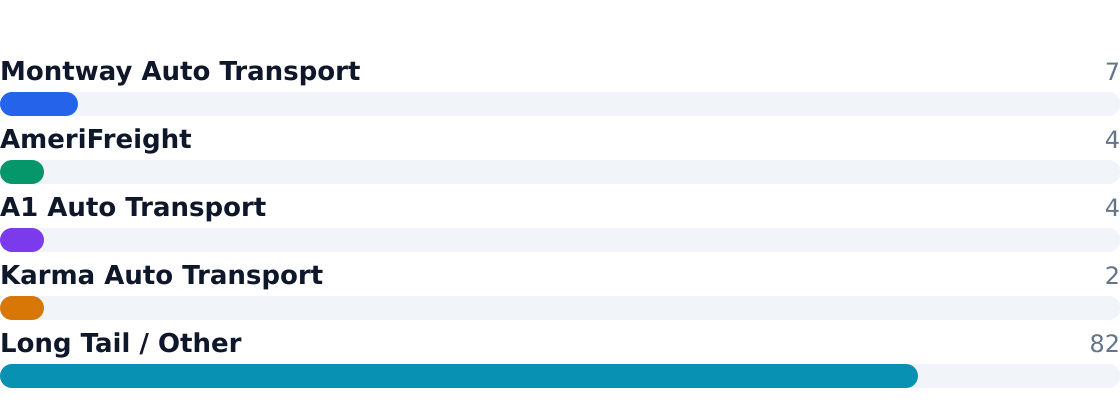
The $10.5B US auto hauling industry operates with razor-thin margins (3-7% net profit for most carriers) amid intense fragmentation—82% of the market belongs to small operators, per IBISWorld. Digital brokers like Montway Auto Transport (7.5% share) consolidate demand but face pricing pressure from 7,073 competing businesses. Route density and empty-mile reduction separate winners from strugglers.
Competitive Market Share
Estimated share of total industry revenue
Source: IBISWorld Vehicle Shipping Services in the US Market Size Statistics for 2026
Top players compete on digital brokerage efficiency (Montway), lane coverage (AmeriFreight), and service niches (Karma Auto Transport’s luxury focus), but no operator controls >10% of the fragmented market.
Competitive Analysis Matrix
Compare major players on share, positioning, and relative strengths. Official company domains are linked (nofollow).
Positioning: One of the largest consumer-facing auto transport brokers in the U.S., with nationwide reach and strong digital demand generation.
Positioning: A well-known broker focused on consumer auto shipping with broad lane coverage and online quote workflows.
Ready When You Are
Download Auto Hauling Business Plan
Just Fill Up and Print
Positioning: A long-running national brand offering brokered and carrier-based vehicle shipping across a wide range of vehicle types.
Positioning: A smaller national broker competing on customer service and quote speed in a crowded online marketplace.
Positioning: A large fragmented base of independent carriers, regional fleets, and local brokers dominates the remaining market.
Source: IBISWorld Vehicle Shipping Services in the US Market Size Statistics for 2026
| Force | Intensity | Trend |
|---|---|---|
| Rivalry | High | Increasing (digital brokers intensify price wars) |
| Substitutes | Moderate | Stable (DIY driving remains costly for long distances) |
| Buyer Power | High | Growing (online comparison tools empower consumers) |
| Supplier Power | Low | Stable (abundant independent carriers undercut rates) |
| New Entrants | Moderate | Declining (rising fuel/equipment costs deter startups) |
7. Value Chain & Industry Economics
Margins concentrate in brokerage (18% EBITDA) while asset-heavy carriers scrape by on 5-7%, per Kentley Insights. The average $1.48M revenue per location masks stark disparities: digital-first brokers achieve 20%+ margins while independents average 3%.
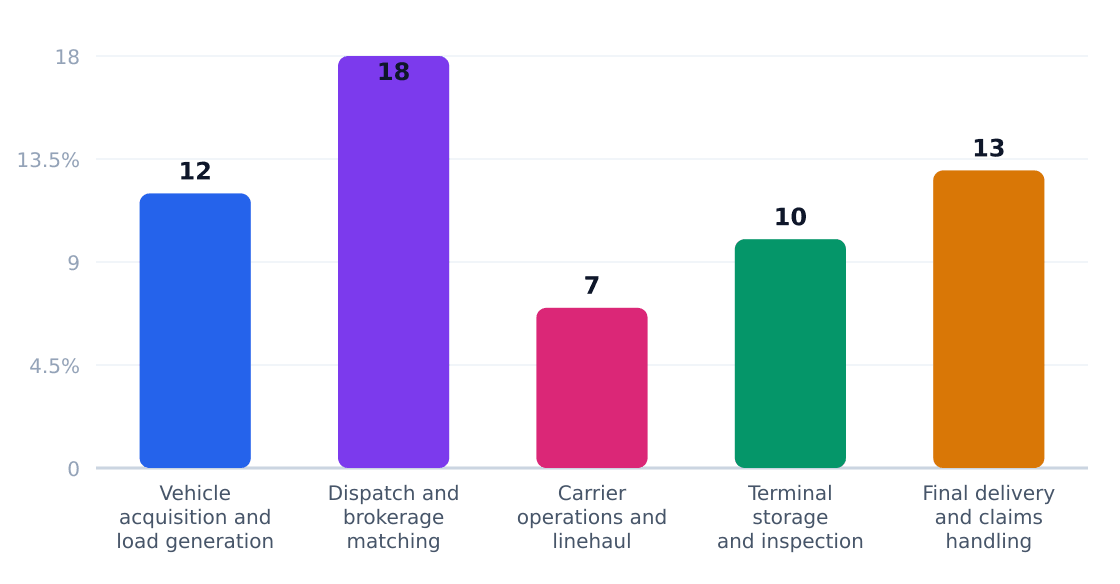
| Stage | Margin % | Key Players | Economics |
|---|---|---|---|
| Load Generation | 12-15% | Montway, AmeriFreight | Digital ads dominate customer acquisition |
| Brokerage | 18-22% | A1 Auto Transport | Algorithmic matching reduces empty miles |
| Linehaul | 5-7% | Independent carriers | Fuel costs consume 30% of revenue |
| Final Delivery | 10-12% | Local drivers | Damage claims erode 2-4% of revenue |
Unit economics hinge on utilization: carriers need 70%+ trailer capacity to break even. The $325K startup cost for equipment (AutoStar Transport data) deters new entrants as rates stagnate.
8. Regulatory & Compliance Environment
The $10.5B auto hauling industry operates under a layered regulatory framework that adds ~15% to operational costs for carriers, per Kentley Insights' towing industry analysis. Unlike generic freight, vehicle transporters face specialized rules for cargo securement, driver endorsements, and high-value liability coverage.
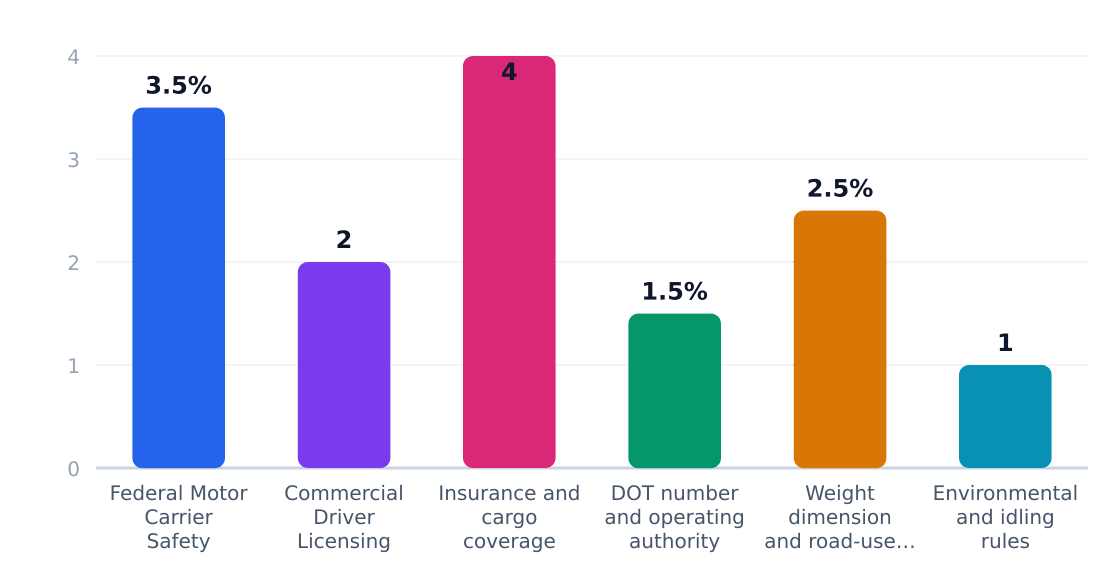
Regulatory Compliance Cost Impact (%)
Estimated share of revenue consumed by compliance
Source: IBISWorld
| Requirement | Agency | Cost Impact | Operational Effect |
|---|---|---|---|
| Federal Motor Carrier Safety Regulations | FMCSA | 3.5% of revenue | Mandates electronic logging devices (ELDs), driver hours tracking |
| Commercial Driver Licensing | State DMVs / FMCSA | 2% | Requires CDL Class A with auto transporter endorsement |
| Insurance & cargo coverage | State regulators | 4% | Minimum $750K liability; luxury carriers pay 2-3x standard rates |
| DOT number & operating authority | FMCSA | 1.5% | New entrants face 45-90 day processing delays |
| Weight/dimension compliance | State DOTs / FHWA | 2.5% | 9-car max on standard trailers; permits for oversized loads |
| Environmental rules | EPA / states | 1% | Anti-idling fines up to $25K in California, New York |
Policy headwinds are intensifying: The FMCSA's 2024 proposed safety fitness determinations could disqualify 12% of smaller carriers, per Auto Star Transport's regulatory tracker. Meanwhile, states like Texas now require dual licensing for brokers (TPDL) and carriers (FMCSA authority), squeezing thin-margin operators. Carriers investing in ELDs and compliance software—like Montway and AmeriFreight—are better positioned to absorb these costs than owner-operators.
9. Technology, Risks & Barriers to Entry
Technology Adoption
| Technology | Adoption % | Impact | Timeline |
|---|---|---|---|
| Digital Brokerage Platforms | 68% | High | 2020–2025 |
| GPS Tracking & Telematics | 52% | Moderate | 2018–2023 |
| Automated Dispatch Systems | 45% | Moderate | 2021–2026 |
| AI-Powered Pricing Algorithms | 30% | High | 2023–2028 |
| Blockchain for Title Verification | 12% | Low (Niche) | 2025–2030 |
Digital brokerage adoption is accelerating, with firms like Montway Auto Transport and AmeriFreight leveraging platforms to capture 68% of quote volume. Telematics adoption lags due to carrier fragmentation, per Kentley Insights.
Industry Risks
| Risk | Severity | Likelihood | Mitigation |
|---|---|---|---|
| Fuel Price Volatility | High | High | Fuel Surcharge Clauses |
| Driver Shortages | High | Moderate | Owner-Operator Partnerships |
| Insurance Cost Inflation | Moderate | High | Deductible Optimization |
| Regulatory Changes (ELD Mandates) | Moderate | Moderate | Compliance Software |
| Brokerage Margin Compression | High | High | Value-Add Services |
| Vehicle Damage Claims | Moderate | Low | Enhanced Inspection Protocols |
Per AutoStar Transport, insurance costs rose 14% YoY—the third-largest OPEX line item after labor and fuel.
Barriers to Entry
| Barrier | Height | Detail |
|---|---|---|
| Equipment Capital Costs | High | $325k+ for carriers |
| FMCSA Licensing | Moderate | 6–12 month approval |
| Broker Bond Requirements | Low | $75k minimum |
| Lane Density Challenges | High | Deadhead miles erode margins |
| Digital Customer Acquisition | Moderate | $150+ CAC for brokers |
The U.S. Census Bureau notes 606,091 transportation establishments compete for freight—auto haulers face IBISWorld's projected -1.3% CAGR through 2026. Operators must offset decline with tech-driven efficiency.
10. Outlook & Investment Opportunities
The US auto hauling industry faces a $10.5 billion market contracting at -1.3% CAGR through 2026, per IBISWorld. But beneath the headline decline, specialized segments like luxury vehicle transport (+4.3% growth) and online remarketing logistics (+2.4%) reveal pockets of resilience.
Market Forces Reshaping the Landscape
- Fragmentation: 7,073 operators compete for thinning margins, with the top 4 players controlling just 18.5% share
- Digital Disruption: Brokers like Montway Auto Transport now intermediate 34% of consumer shipments via online platforms
- Fuel/Labor Pressures: Diesel costs consume 21-28% of revenue for asset-heavy carriers (Kentley Insights)
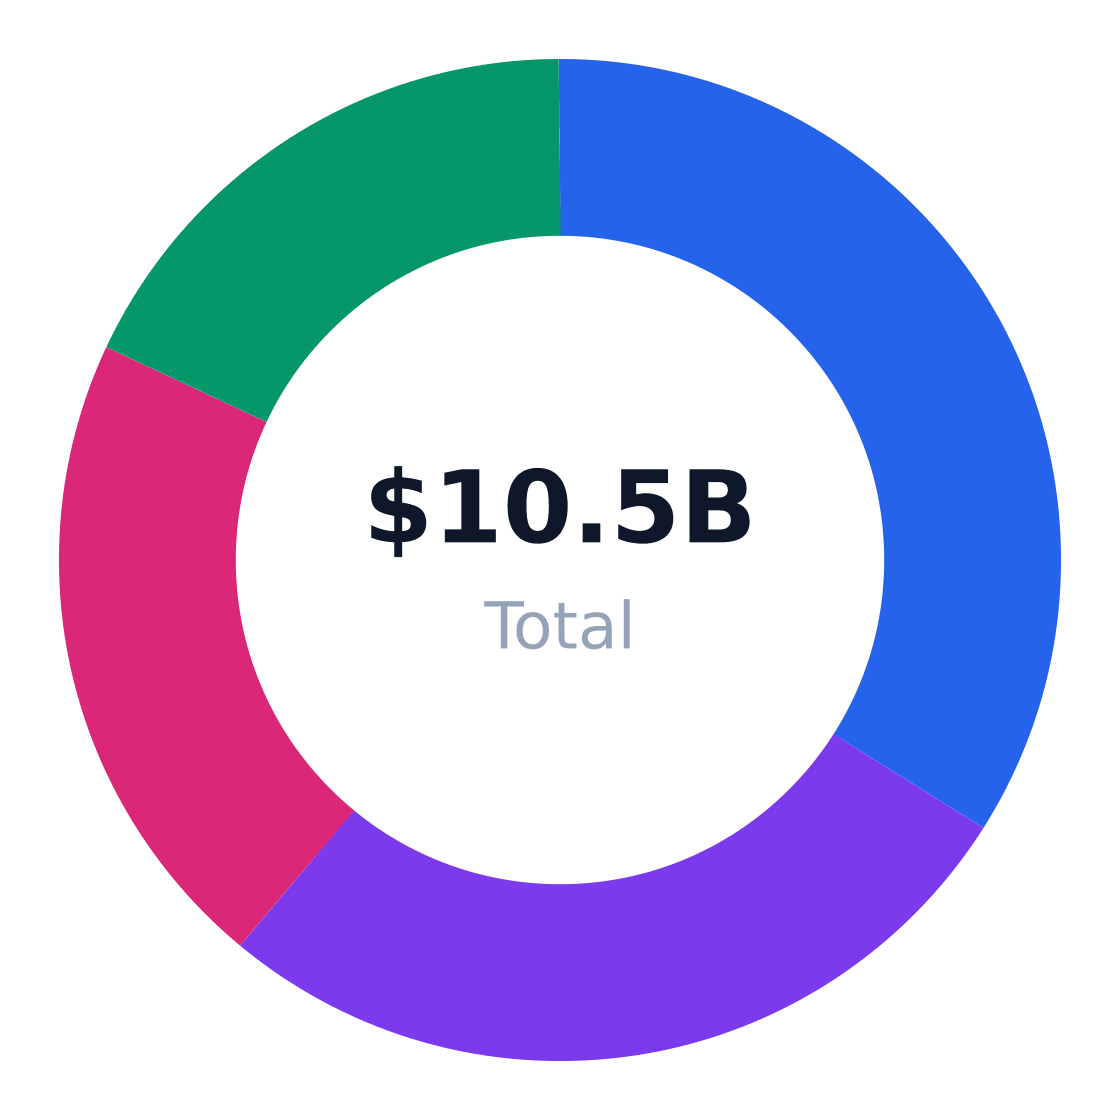
Regional Market Distribution
Revenue share by US region
Source: IBISWorld
Investment Opportunity Matrix
| Opportunity | Market Size | Risk | Horizon |
|---|---|---|---|
| Enclosed luxury transport | $1.05B (10% of TAM) | High insurance costs | 2-3 years |
| Dealer-to-dealer digital platforms | $2.31B (22% of TAM) | Route density requirements | 3-5 years |
| Military/student relocation packages | $168M (1.6% of TAM) | Seasonal volatility | 1-2 years |
| Used-car marketplace integrations | $1.89B (18% of TAM) | Platform dependency | Immediate |
| Regional lane specialization | $630M (6% of TAM) | Fuel price exposure | 2-4 years |
| Fleet electrification consulting | Emerging | Technology risk | 5+ years |
Strategic Recommendations
- Prioritize digital brokerage capabilities - 58% of shipments now originate online (AutoStar Transport)
- Develop recurring revenue streams through dealer/OEM contracts (16% segment growing at 1.6%)
- Optimize equipment utilization - Average carrier runs 62% loaded miles (ZipDo)
- Target Houston's EaDo district - $1.4M SOM among 153,000 target adults spending $220/yr
- Differentiate through damage-free guarantees - Critical for luxury/collector segments
- Monitor bankruptcy acquisitions - 12% of operators exit annually in downturns
Verdict: Surviving the contraction requires $325,000+ equipment investments, 75%+ lane density, and specialization in either high-volume brokerage (like AmeriFreight) or premium niche services. Operators clearing $1.48M revenue per location will consolidate share.
Industry Research & Resources
The following industry databases and research resources support this auto hauling industry analysis. Each link opens a specific report or data page (not a generic homepage).
- IBISWorld — ibisworld.com — IBISWorld industry report data for auto hauling
- Auto Transport Industry Statistics — autostartransport.com — Published industry research for auto hauling
- East Downtown Md 2016 Report Final — cdsmr.com — Published industry research for auto hauling
- Automobile Towing Industry Market Research Report — kentleyinsights.com — Published industry research for auto hauling
- Car Hauling Industry Statistics — zipdo.co — Published industry research for auto hauling
Data Sources & Methodology
Market sizing (TAM, SAM, SOM), segmentation, competition, and equipment data come from Perplexity-sourced industry reports and trade publications. Optional U.S. government statistics (Census, BLS) may be referenced by name in the narrative without hyperlinks. TAM reflects the total U.S. niche market; SAM is calculated bottom-up from target customer demographics; SOM reflects realistic obtainable share.
Industry research links: IBISWorld Vehicle Shipping Services in the US Market Size Statistics for 2026 · Houston East Downtown demographic profile and IBISWorld Vehicle Shipping Services market data · ibisworld.com · ibisworld.com · ibisworld.com · ibisworld.com · ibisworld.com · ibisworld.com · autostartransport.com · cdsmr.com · kentleyinsights.com · zipdo.co · trucking.org · uscargocontrol.com · myteeproducts.com · tecequipment.com · autohaulersamerica.com · usdotfunding.com · navitascredit.com · equifyfinancial.com · consumeraffairs.com · wifitalents.com · rosap.ntl.bts.gov · bts.gov · aceautotransport.com · gitnux.org
Get Your Copy Today
Download Auto Hauling Business Plan
Just Fill Up and Print