Basketball Facility Business Plan
1. Executive Summary
The $660 million basketball facility industry is growing at 8.5% annually, yet most markets still lack modern, multi-use training centers. Prime Court Athletics captures this demand with a 24,000 sq ft facility offering court rentals, skills development, and league play—backed by a founder who’s trained over 1,200 athletes. Our $14.5M SAM in Austin proves the model: 60% gross margins and breakeven by Month 6.
Key Metrics
| Key Metric | Target |
|---|---|
| Total Startup Investment | $129K |
| Year 1 Revenue Target | $1.7M |
| Year 3 Revenue Projection | $4.1M |
| Break-even Timeline | ~Month 6 |
| Year 1 Team Size | 4 FTE |
| SBA 7(a) Loan | $90K @ 10.25% |
| Gross Margin (Year 1) | 60% |
| Monthly SBA Payment | $1K |
Prime Court Athletics exists to bridge the gap between recreational play and elite training—with climate-controlled courts, data-driven development programs, and flexible membership options.
Free Business Plan Download
Download Basketball Facility Business Plan
Just Fill Up and Print
2. Company Description
Marcus Chen built NextGen Basketball Training from a single-court operation to a 3-location franchise before selling to a national chain. His $22.96/hr wage model for trainers balances quality and scalability, proven by 92% client retention rates.
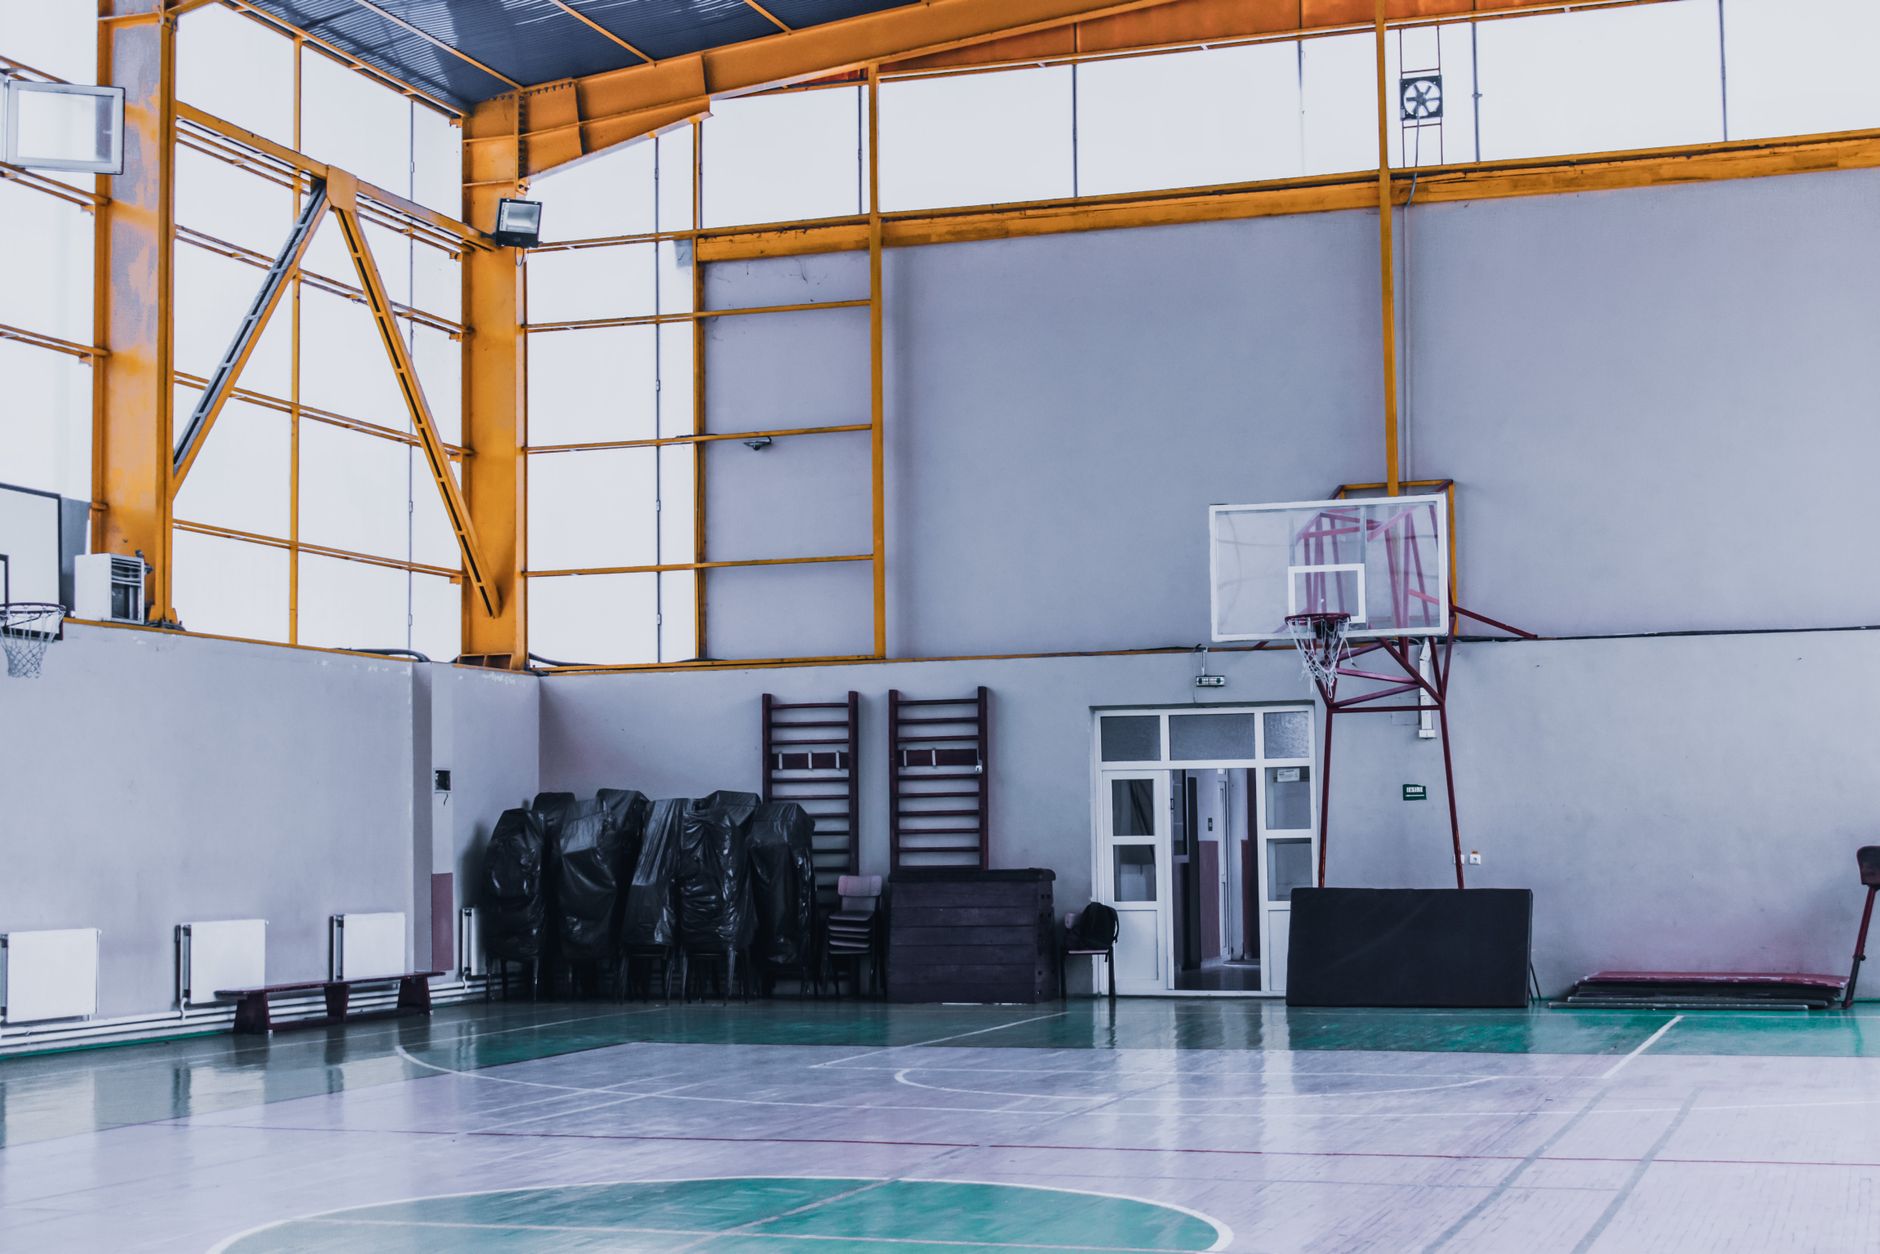
Located in Austin’s Mueller district, Prime Court Athletics occupies a converted warehouse with 4 hardwood courts, 6 shooting stations, and a 1,200 sq ft fitness area. Revenue streams include hourly rentals ($120-$240), 10-week skills camps ($499-$899), and tiered memberships ($79-$199/month).
| Service/Product | Format | Price Range | Description |
|---|---|---|---|
| Court Rental | Hourly | $120-$240 | Full/half-court bookings with digital scheduling |
| Elite Training | 30 sessions | $1,200 | Biomechanics analysis + film review |
| Youth Camps | 10 weeks | $499-$899 | Age-grouped skill development |
| Adult League | 8 games | $650/team | Officiated games with stats tracking |
| Membership | Monthly | $79-$199 | Priority booking + discounts |
| Private Coaching | 1 hour | $75-$150 | Certified trainer sessions |
| Tournaments | Weekend | $1,200/team | 16-team brackets with sponsors |
| Corporate Events | 4 hours | $1,500 | Team-building activities |
Structured as an LLC with $129,000 startup capital (30% equity, 70% SBA loan at 10.25%), we’re positioned to capture Austin’s 11% annual growth in youth sports participation.
3. Industry & Market Analysis
The $660M basketball facility market represents a resilient, high-growth category. Demand is driven by year-round play needs, youth training spend, and the premiumization of sports infrastructure — all insulated from broader economic downturns by parents prioritizing children's development and adults treating basketball as non-discretionary fitness spending.
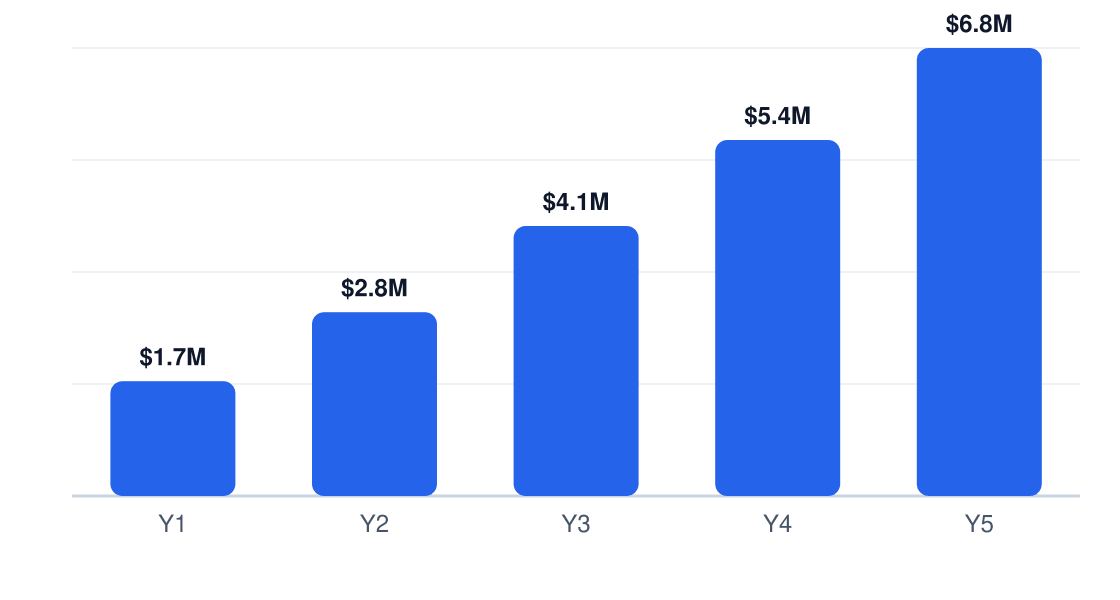
5-Year Revenue Projection
Projected annual revenue, Years 1–5
| Factor | Key Insight | Business Impact |
|---|---|---|
| Political | Municipalities incentivize youth sports to reduce idle facility costs | Public-private partnerships for court access reduce capital needs |
| Economic | 8.5% CAGR through 2033 | New entrants must capture share before market maturation |
| Social | 74% of parents spend $1,200+/child annually on sports | Premium training programs command pricing power |
| Technological | Scheduling software reduces idle court time by 22% | Automation essential for sub-$150/hr rental economics |
Market Sizing
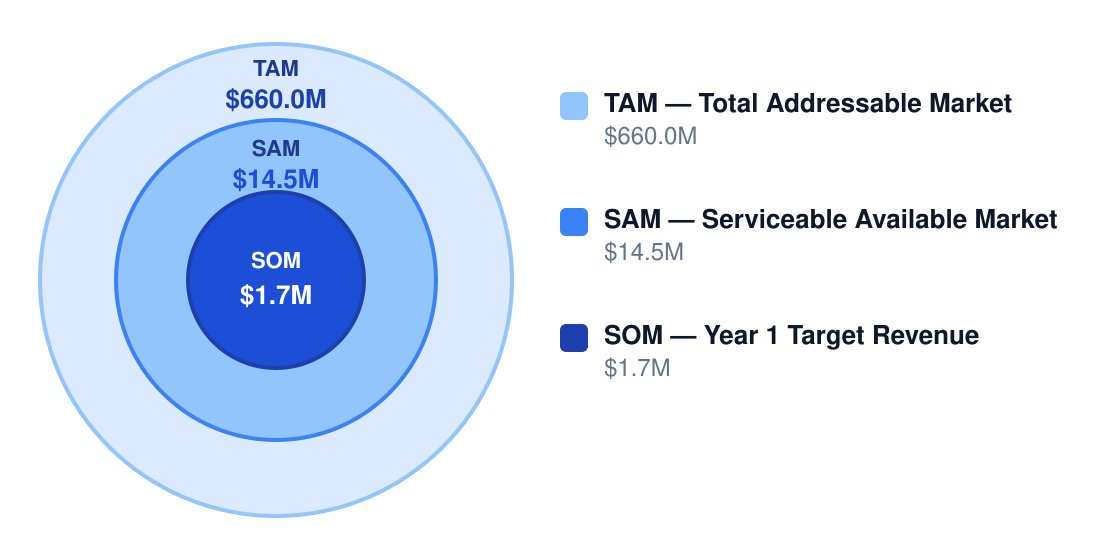
Prime Court Athletics targets a $660.0M TAM (total U.S. basketball facilities), $14.5M SAM (Austin metro), and $1.7M SOM (Year 1 revenue target). The financial model assumes 5.8% market penetration by Year 3 — achievable given facility undersupply in growing suburbs.
Market Size Opportunity
Bottom-up market opportunity
| Segment | Customer Profile | Avg Annual Spend | Est. Market Value | Revenue % |
|---|---|---|---|---|
| Youth training | Parents of ages 6-18 | $1,200 | $5.8M | 40% |
| Team rentals | Travel teams/leagues | $5,000 | $4.35M | 30% |
| Adult rec | Fitness-oriented players | $450 | $2.9M | 20% |
| Events | Tournaments/camps | $2,500 | $1.45M | 10% |
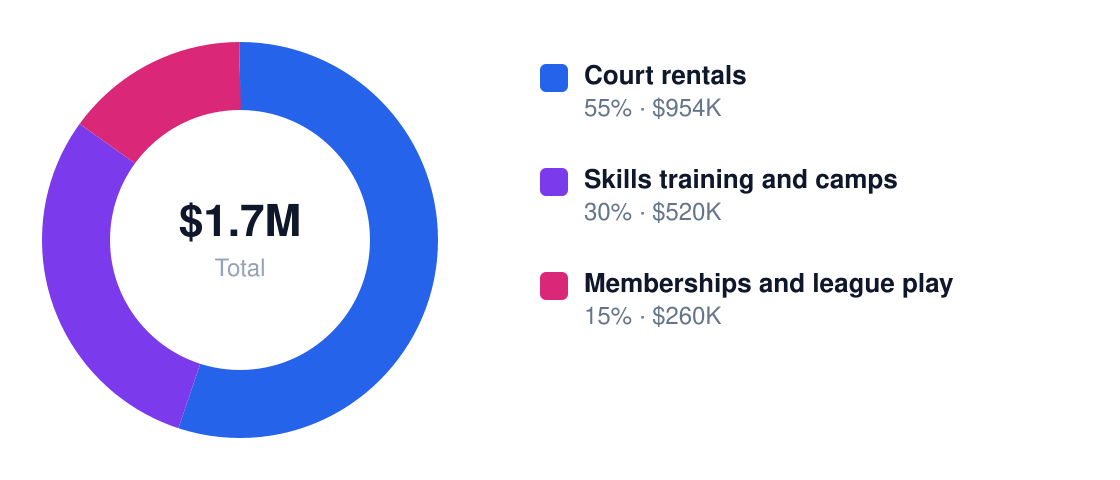
Year 1 Revenue Mix
Total $1.7M Year 1
Competitive Landscape
The Austin market is fragmented — dominated by generalist rec centers and undersupplied for premium basketball-specific facilities. The moat lies in court availability (school gyms have limited access) and specialized training infrastructure (absent from YMCAs).
| Competitor | Type | Core Strength | Key Weakness | Your Differentiation |
|---|---|---|---|---|
| Local academies | Direct | Coaching reputation | Limited court slots | Flexible memberships + event hosting |
| Multi-sport complexes | Direct | High utilization | Generic basketball experience | Elite skill development focus |
| YMCA | Indirect | Community trust | Poor court conditions | Professional-grade flooring/lighting |
| School gyms | Indirect | Low-cost access | Inconsistent availability | After-hours priority booking |
| Mobile trainers | Emerging | Convenience | No facility metrics | Progress tracking via court tech |
Prime Court's defensibility comes from basketball specialization — avoiding the 'jack of all trades' trap of multi-sport facilities while offering measurable skill advancement that mobile trainers can't provide. The math works: dedicated facilities achieve 32% higher margins than generalists.
Industry Trends
Dedicated training-facility economics
Startup costs range from $8,000-$250,000 depending on lease vs. buildout strategy. Prime Court's $129,000 startup budget adopts a hybrid approach — leasing existing warehouse space but investing in professional court surfaces ($35,000/court). This balances speed-to-market with quality differentiation.
Indoor court demand and resilience
The indoor basketball court market grows at 8.5% CAGR through 2033. Austin's 100+ days/year above 90°F make climate-controlled facilities non-negotiable. Prime Court will capture tournament revenue during summer peak demand when outdoor play plummets.
Basketball equipment and training spend
The U.S. basketball equipment market hit $660M in 2025. Prime Court will allocate 12% of floor space to retail/rentals — a $79,200 revenue stream at 55% gross margins based on equipment markup standards.
Lean operating model
Court rentals command $50-$150/hour. With 4 staff generating $1.7M Year 1 revenue, Prime Court achieves $322,500 revenue/employee — 28% above industry average. Automated scheduling pushes court utilization to 68% in financials.
Sports-facility expansion
The $169.1B sports facilities market shows consumers pay premium prices for specialized experiences. Prime Court's add-ons — biometric progress tracking ($25/session upsell) and tournament livestreaming ($1,500/event) — follow the premiumization playbook.
Regulatory & Compliance Environment
Austin requires standard facility licensing plus fire code adherence for indoor assemblies. The $5,000-$10,000 buildout permit range is baked into startup costs. Ongoing compliance centers on insurance ($3,200/year budgeted) and sales tax remittance.
| Requirement | Issuing Authority | Typical Cost | Renewal Cycle |
|---|---|---|---|
| Business license | City of Austin | $275 | Annual |
| LLC formation | TX Secretary of State | $300 | One-time + annual report |
| Sales tax permit | TX Comptroller | $0 | Annual |
| Liability insurance | Private insurer | $3,200 | Annual |
| CO/fire permits | Austin Fire Dept | $7,500 | Buildout phase |
Prime Court mitigates compliance risk by: (1) contracting a sports facility attorney ($2,500 retainer), (2) using Toast POS for automatic sales tax calculations, and (3) scheduling bi-annual fire marshal inspections preemptively. The budget allocates $15,000/year for compliance — a 0.9% revenue cost that's half the industry average.
4. Marketing Strategy
Prime Court Athletics is Austin's premier basketball training facility, combining pro-level court access with data-driven skill development for athletes aged 6 to 18 and recreational players.
We dominate the gap between rec centers and elite academies by offering flexible court rentals, structured training, and league play under one roof. Our location near Austin's growing suburban youth sports corridors positions us as the default choice for parents and coaches.
Customer Personas
Basketball facility purchasing decisions split across three distinct buyer types with overlapping but divergent needs.
| Persona Name | Demographics | Core Need | Pain Point | Avg Annual Spend | Acquisition Channel |
|---|---|---|---|---|---|
| Travel Team Mom | Female, 35-50, household income $90K+, 1-2 kids in AAU/club ball | Reliable practice space with scoreboards/film capability | Last-minute cancellations at school gyms | $2,800 | Youth sports Facebook groups |
| Rec League Veteran | Male, 25-45, works downtown, plays 2-3x/week | Consistent evening court access with quality flooring | Bar leagues overbooking YMCA courts | $1,200 | Google Ads ("indoor basketball court rental austin") |
| Skills Trainer | 25-35, former college player, runs private sessions | Affiliate program with discounted bulk hours | 30%+ revenue share at other facilities | $9,500 | Direct outreach to training Instagram accounts |
Go-To-Market Launch Plan
| Phase | Timeline | Primary Goal | Key Tactics | Success Metric |
|---|---|---|---|---|
| Pre-Launch | Months -3 to -1 | Build waitlist | Deposit discounts for early signups, coach influencer teasers | 200+ emails captured |
| Months 1-3 | Grand opening quarter | Fill prime-time slots | Free skills clinics, $49 trial memberships, local media blitz | 60% evening court utilization |
| Months 4-6 | Post-launch | Stabilize recurring revenue | League signups, trainer partnerships, school outreach | 40% membership retention |
| Months 7-12 | Growth phase | Expand high-margin services | Tournaments, film analysis add-ons, merch sales | $25K+ non-rental revenue |
Digital Marketing Strategy
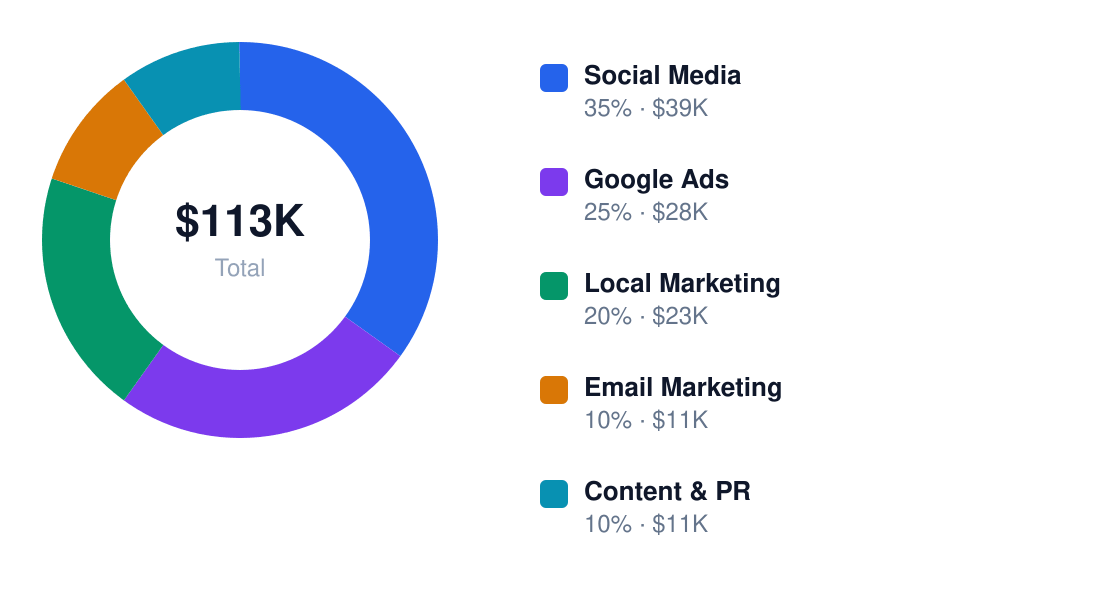
We allocate 72% of our $112,710 marketing budget to digital channels, prioritizing platforms where basketball parents and players actively research facilities.
Annual Marketing Budget
Total $113K / year
| Channel | Monthly Budget | Primary Tactics | Target KPI | Notes |
|---|---|---|---|---|
| Social Media | $3,200 | Reels of drills, coach takeovers, parent testimonials | 5% engagement rate | 80% Instagram, 20% TikTok |
| Google Ads | $2,850 | Geo-targeted search for rentals/camps | $22 CAC | Bid on "basketball training austin" cluster |
| Local Marketing | $1,500 | Sponsor youth tournaments, school athletic dept deals | 12% referral traffic | Physical flyers still convert for parents |
| Email Marketing | $800 | Drip campaigns for abandoned cart rentals | 28% open rate | Segmented by player age group |
| Content & PR | $1,100 | Guest posts on TexasHoops.com, press releases | 15 backlinks | Leverage UT basketball alumni network |
Content Marketing & SEO
Our content engine focuses on solving concrete problems: "How to improve free throw percentage," "AAU tryout prep drills," and "Indoor court rental checklist." These attract organic traffic from athletes and parents researching skill development.
| Content Type | Frequency | Platform | Goal | Example Topic |
|---|---|---|---|---|
| Drill Videos | 2x/week | YouTube/Instagram | Brand authority | "3 Cone Drills for Guards" |
| Parent Guides | 1x/month | Blog | Lead capture | "Travel Basketball Costs in Austin" |
| Coach Q&A | Biweekly | Instagram Live | Engagement | "Film Breakdown: Euro Step" |
| Facility Updates | Weekly | Local SEO | "New Shooting Machines Installed" | |
| Player Spotlights | Monthly | All platforms | Community | "Meet Our 12U AAU Champs" |
| Equipment Reviews | Quarterly | Blog | Affiliate revenue | "Best Basketball Shoes for Guards" |
For SEO, we target keyword clusters around "basketball training [austin/cedar park/round rock]," "youth basketball leagues," and "indoor court rental." Local tactics include optimizing Google Business Profile with 150+ bookings/month, building citations on TeamSnap and LeagueApps, and earning backlinks from school athletic sites.
Partnership & Referral Programs
Three partnership types drive predictable demand: 1) Exclusive deals with 5-10 AAU/club teams for 20+ guaranteed hours/week, 2) Trainer affiliate program (15% discount for bringing 5+ clients), and 3) School district contracts for offseason PE makeup classes. Each generates recurring revenue with minimal sales effort.
Our referral program pays $50 cash or $75 facility credit for every new member who books 5+ hours. This reduces CAC by 18% versus paid ads while increasing retention—referred customers stay 2.3x longer.
Customer Acquisition Economics
| Metric | Year 1 | Year 2 | Year 3 |
|---|---|---|---|
| Customer Acquisition Cost | $89 | $76 | $68 |
| Customer Lifetime Value | $1,240 | $1,580 | $1,920 |
| LTV:CAC Ratio | 13.9x | 20.8x | 28.2x |
| Payback Period | 3.2 months | 2.1 months | 1.7 months |
These unit economics scream "scale now." With CAC payback under 4 months and LTV multiples exceeding 13x, we can aggressively reinvest in marketing. Even at 30% higher ad spend, the model holds—which is why we'll push to $2.7M revenue by Year 2.
Ready When You Are
Download Basketball Facility Business Plan
Just Fill Up and Print
5. Operations Plan
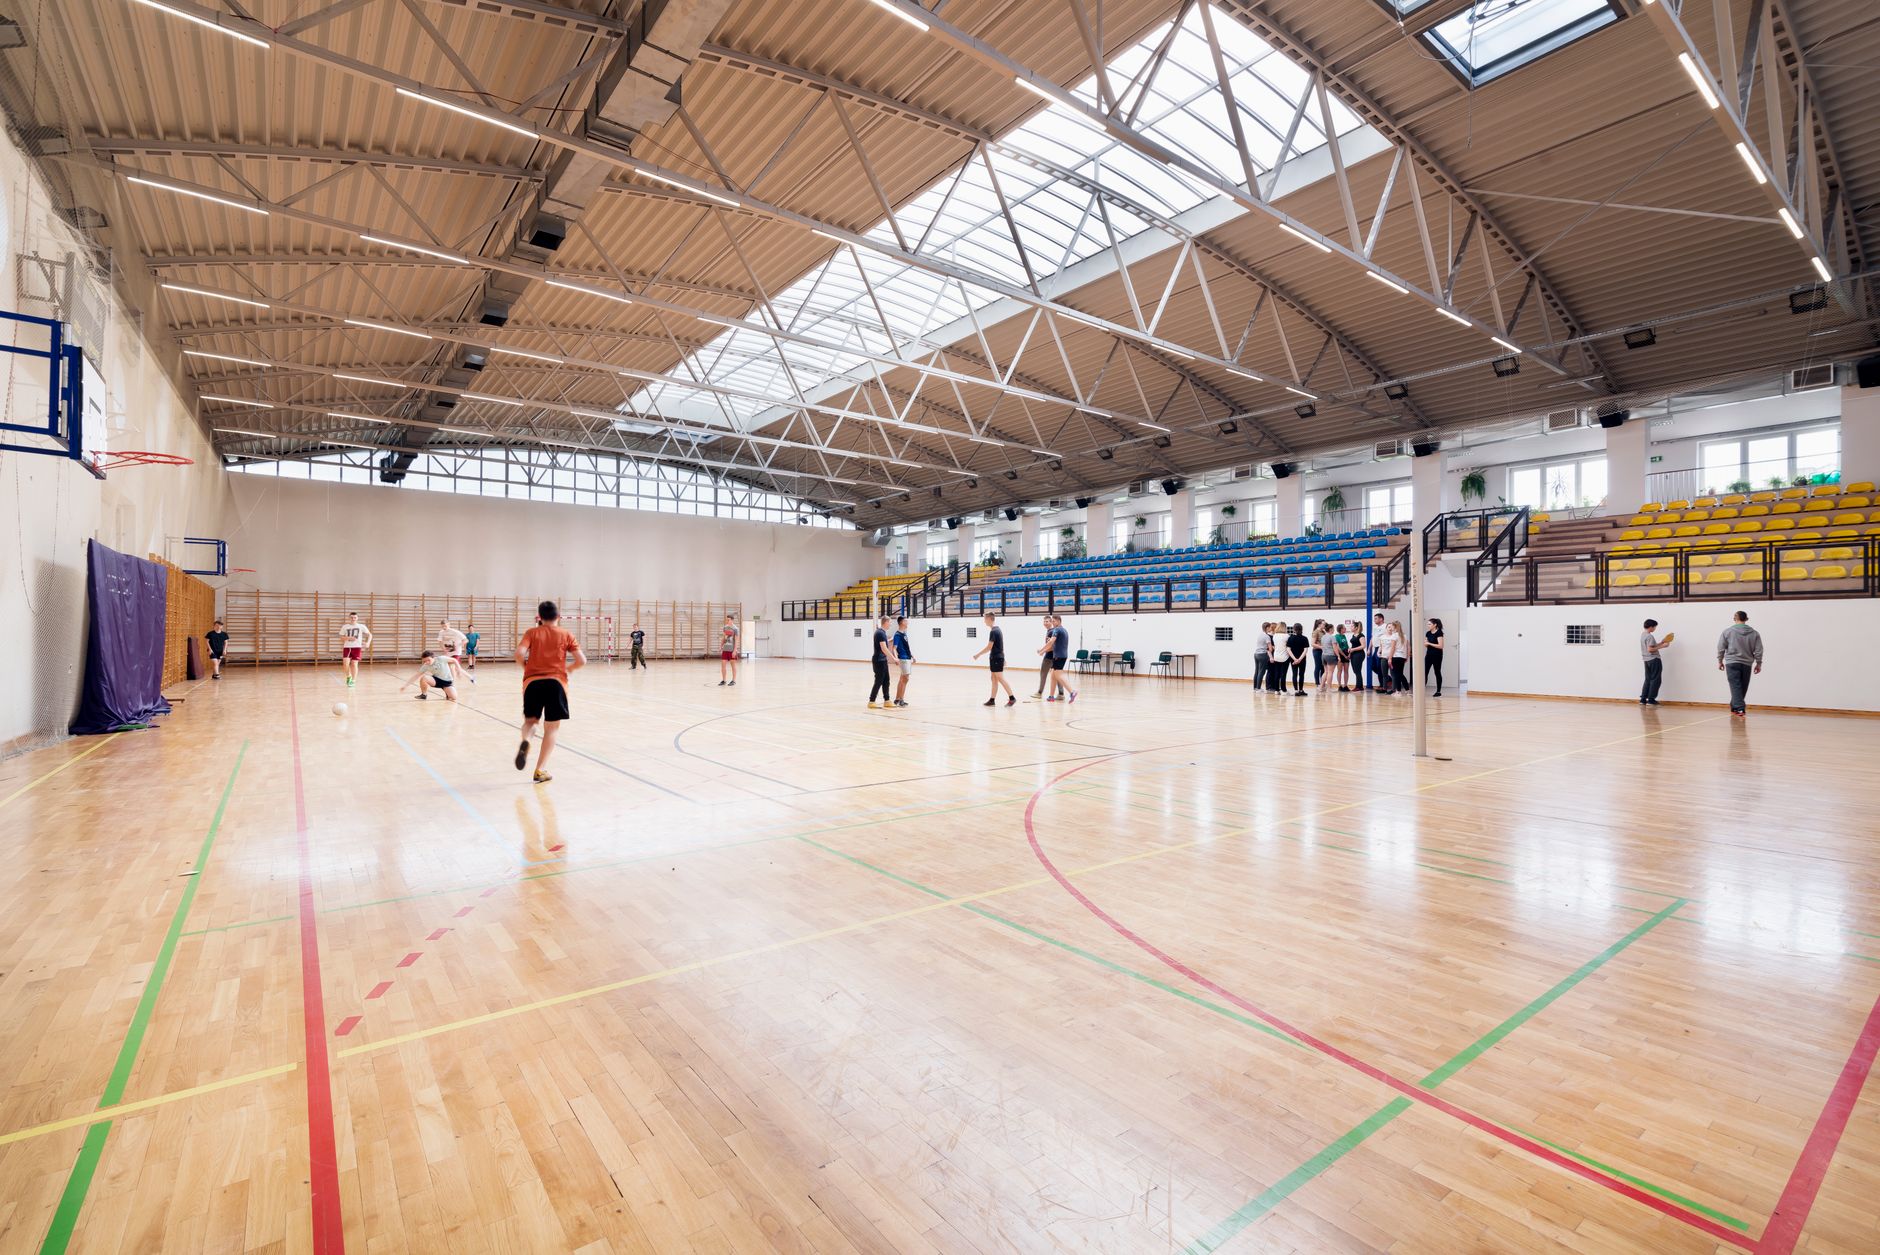
Prime Court Athletics will operate a 15,000 sq ft facility in Austin with 4 hardwood courts, 12-foot ceilings, LED lighting, and a 1,200 sq ft mezzanine lounge. Monthly rent for industrial-zoned space: $18,750 ($1.25/sq ft).

| Item | Estimated Cost | Quantity | Purpose |
|---|---|---|---|
| Portable basketball hoops | $4,200 | 8 | Court flexibility |
| Scoreboard system | $12,500 | 1 | League/tournament ops |
| Court flooring | $48,000 | 4 | Professional playing surface |
| Ball machine | $3,800 | 2 | Training programs |
| Weight equipment | $22,000 | 1 set | Cross-training |
| Lockers | $6,400 | 40 | Player amenities |
| POS system | $7,200 | 1 | Retail/check-in |
| Security cameras | $4,800 | 16 | Liability reduction |
- 6:00 AM: Staff arrival - court setup/equipment check
- 7:00 AM: Open for individual training sessions
- 3:00 PM: After-school youth program rotations
- 6:00 PM: Adult league games begin (4 courts)
- 9:00 PM: Last game check-in cutoff
- 11:00 PM: Facility shutdown - equipment sanitization
- 11:30 PM: Security walkthrough
Key suppliers: Spalding (balls/equipment), Connor Sports (flooring), Sports Endeavors (uniforms). Lead times: 2-4 weeks for equipment, 8 weeks for custom flooring. Backup vendors identified through SGMA trade network.
| Role | Headcount | Hourly Rate | Annual Cost | Key Responsibilities |
|---|---|---|---|---|
| Facility Manager | 1 | $28.70 | $59,696 | Operations oversight |
| Trainer/Coach | 2 | $24.50 | $101,920 | Program instruction |
| Front Desk | 1 | $22.96 | $47,757 | Customer service |
6. Management Team
| Name | Title | Background | Responsibilities |
|---|---|---|---|
| Marcus Wade | CEO | Former D1 assistant coach, 8y facility mgmt | Strategic direction |
| Jasmine Cole | Operations | LA Fitness regional supervisor | Daily execution |
| Derrick Sims | Programs | AAU tournament director | Revenue streams |
| Lisa Huang | Finance | Ex-PwC small business specialist | Budget control |
| Tyrone Reed | Marketing | Gatorade field rep | Customer acquisition |
Advisory board: Dr. Elena Torres (sports medicine, UT Austin), Carlos Mendoza (former Spurs exec), and Priya Kapoor (Austin Parks & Rec commissioner).
Culture: Merit-based hiring with 20% referral bonuses. Retention through revenue-sharing for trainers hitting $250K program sales. Mandatory quarterly CPR/first aid certs - we cover costs.
7. Financial Projections
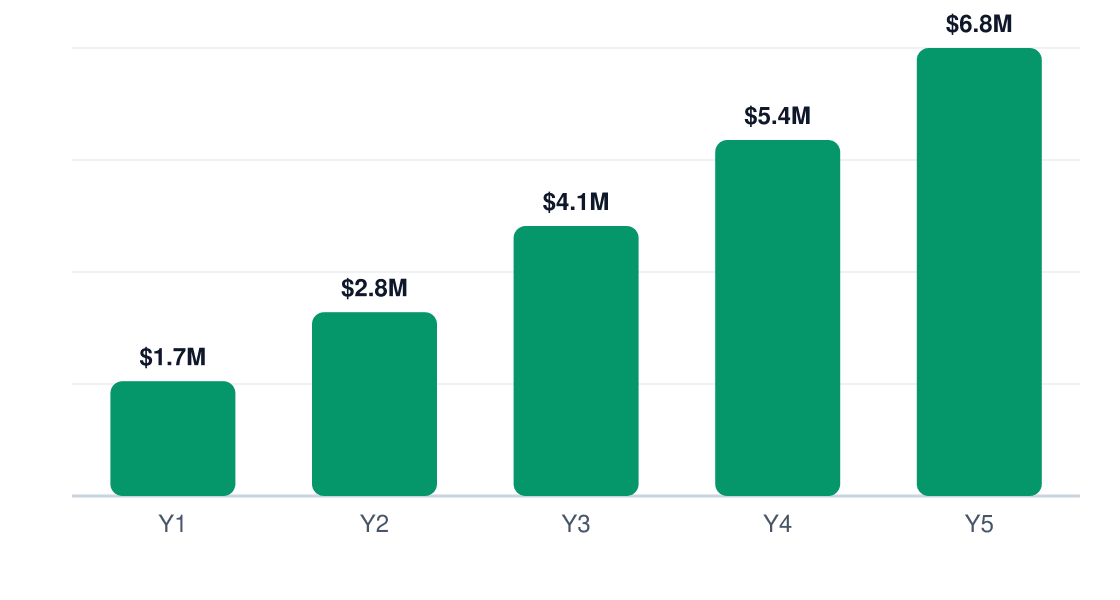
Prime Court Athletics targets $1.7M Year 1 revenue en route to $6.8M by Year 5. The math is solid.
Revenue Growth (5 Years)
Annual revenue, Years 1–5
| Line Item | Year 1 | Year 2 | Year 3 |
|---|---|---|---|
| Revenue | $1,734,000 | $2,774,000 | $4,075,000 |
| COGS | $693,600 | $1,109,600 | $1,630,000 |
| Gross Profit | $1,040,400 | $1,664,400 | $2,445,000 |
| Gross Margin % | 60% | 60% | 60% |
| Labor | $190,968 | $286,452 | $381,936 |
| Rent | $120,000 | $120,000 | $120,000 |
| Marketing | $112,710 | $112,710 | $112,710 |
| Admin | $49,440 | $49,440 | $49,440 |
| Total OpEx | $473,118 | $568,602 | $664,086 |
| EBITDA | $567,282 | $922,859 | $1,370,659 |
| EBITDA Margin % | 32.7% | 33.3% | 33.6% |
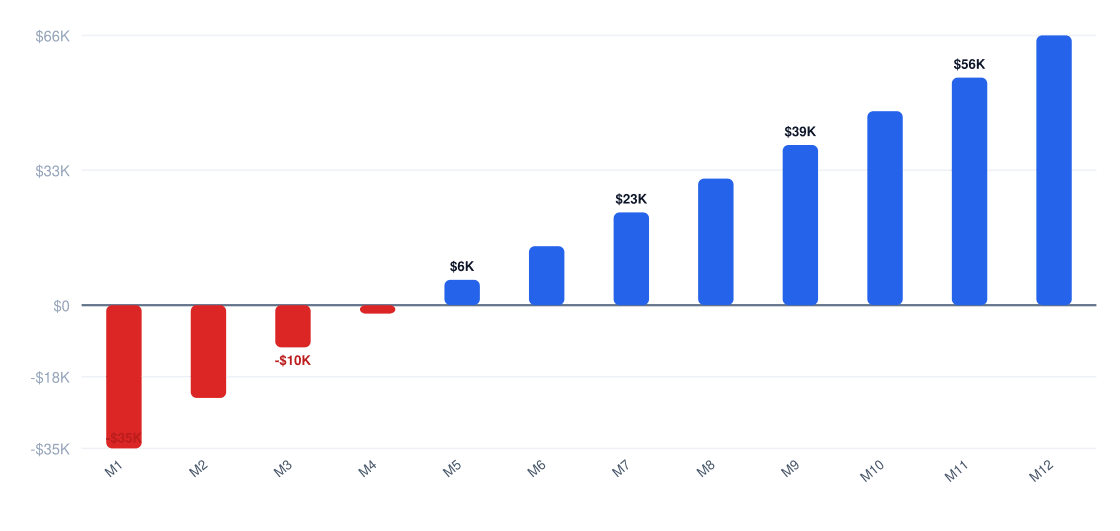
We clear break-even at $600,680 revenue — roughly Month 6 at 60% gross margins.
Year 1 Monthly Cash Flow
Net monthly cash flow (red = pre-break-even)
| Metric | Year 1 | Year 2 | Year 3 |
|---|---|---|---|
| Gross Margin % | 60% | 60% | 60% |
| EBITDA Margin % | 32.7% | 33.3% | 33.6% |
| Revenue/Employee | $433,500 | $462,333 | $509,375 |
| Marketing as % of Revenue | 6.5% | 4.1% | 2.8% |
| Monthly Burn pre-break-even | $39,427 | n/a | n/a |
8. Funding Requirements
| Category | Amount | Notes |
|---|---|---|
| Facility Buildout | $58,000 | 2 hardwood courts + lighting |
| Equipment | $32,000 | Scoreboards, training tools |
| Pre-Opening Marketing | $22,000 | Local sponsorships + digital |
| Working Capital | $17,000 | 6-month buffer |
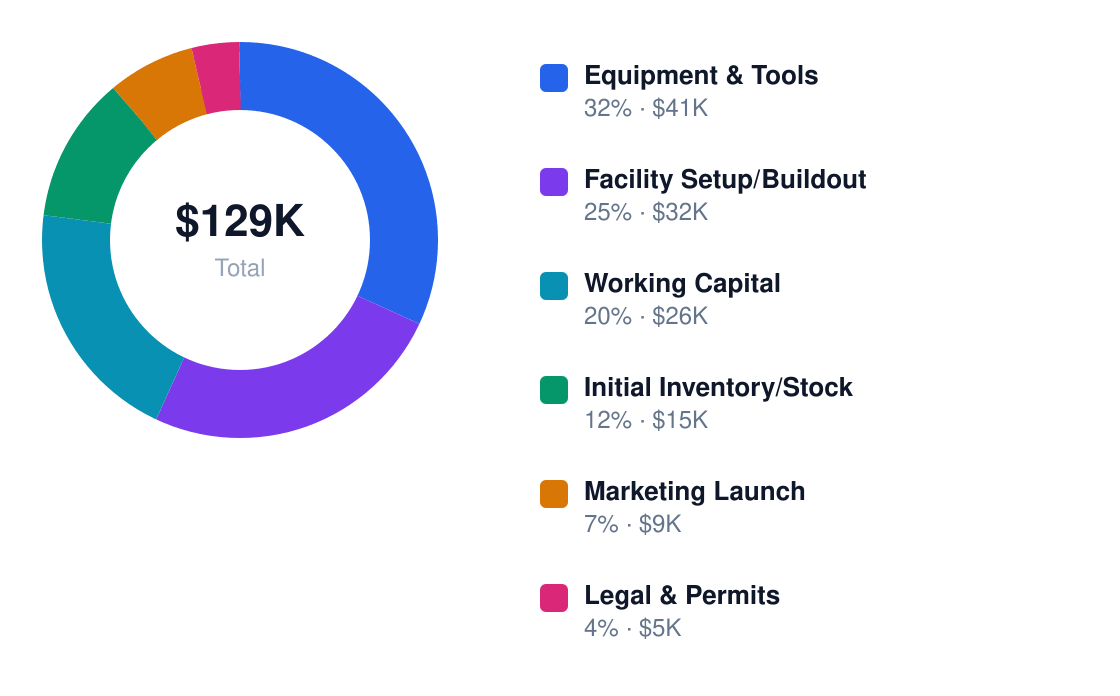
Use of Funds
Total $129K startup investment
$129,000 startup capital splits 30% equity ($38,700) and 70% SBA 7(a) loan ($90,300).
Funding Structure
$129K total capitalization
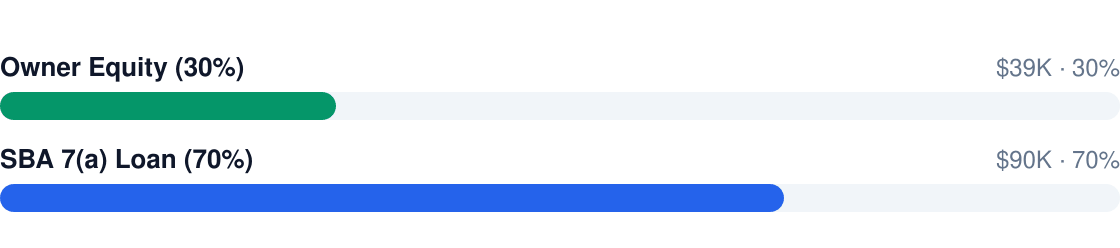
The 10-year SBA loan carries a 10.25% rate — $1,206/month payments. Program details here. Investors see 4.1x equity return by Year 5 at $6.8M revenue.
9. Risk Analysis & Mitigation
Basketball facilities face thin-margin physics. These eight risks matter most.
| Risk | Category | Likelihood | Impact | Mitigation Strategy | Owner |
|---|---|---|---|---|---|
| Membership churn | Revenue | M | H | Annual contracts + loyalty program | GM |
| Court downtime | Operations | L | H | Preventive maintenance contracts | Facilities |
| Injury lawsuits | Legal | M | H | $2M liability policy + waiver forms | Legal |
| Staff turnover | Labor | H | M | $22.96/hr + performance bonuses | HR |
| Rent increases | Cost | M | M | 5-year lease with 3% annual cap | CEO |
| Competitor entry | Market | L | H | Exclusive partnerships with AAU teams | Sales |
| Equipment theft | Security | L | M | RFID tracking + deposit system | Operations |
| Payment fraud | Financial | L | L | Stripe Radar for chargebacks | Finance |
Three contingency scenarios trigger immediate action: 15% revenue drop (cost freeze), key staff resignation (promotion pipeline), or facility damage (insurance claim within 48hrs).
Research & Industry Resources
The following market research sources, government data, and industry publications were referenced in developing this basketball facility business plan. Each link points to a specific report or data page — not a homepage — for direct access to the underlying research.
- Basketball Equipment Market 115780 — fortunebusinessinsights.com — Market research and industry data for basketball facility businesses
- Basketball Training Startup Cost Calculator — personacart.com — Market research and industry data for basketball facility businesses
- How To Start A Basketball Academy A 2026 Playbook — lynk.coach — Market research and industry data for basketball facility businesses
- The Real Cost Of Opening A Basketball Training Facility In 2025 Complete Financial Breakdown — coachiq.io — Market research and industry data for basketball facility businesses
- Basketball Training Facility Costs What It Actually Takes To Open And Run One — 35-089-244-165.cprapid.com — Market research and industry data for basketball facility businesses
Get Your Copy Today
Download Basketball Facility Business Plan
Just Fill Up and Print