Basketball Facility Business Industry Analysis
1. Industry Overview
The US basketball facility industry operates at a $1.00 billion total addressable market (TAM), with steady 4.5% annual growth projected through 2026, according to the Mr Basketball Academy Business Plan. This niche combines dedicated indoor courts, training academies, and multi-sport complexes where basketball drives primary revenue. The US Sports Facilities Market report notes basketball-specific venues account for 30% of indoor sports facility revenue, second only to soccer.
Structural characteristics define the sector:
- Fragmented ownership: 606,091 establishments nationwide (U.S. Census Bureau, County Business Patterns 2022), with The Sports Facilities Companies holding just 28% market share
- Revenue concentration: 55% comes from practice/team training (30%) and competitive leagues (25%), per application share data
- Equipment costs: Startup flooring and hoop systems average $125,000 per court
- Demand drivers: Youth sports participation and year-round tournament play sustain 6.4% growth in skills academies
Industry Snapshot

Free Business Plan Download
Download Basketball Facility Business Plan
Just Fill Up and Print
Metrics from Perplexity-sourced industry reports (market size, SAM/SOM); optional Census/BLS stats cited in text only
| Industry Snapshot | Benchmark |
|---|---|
| US Market Size (TAM) | $1.00B — Mr Basketball Academy Business Plan 2020 |
| Target Market (SAM) | $6.3M — Houston, TX · City of Houston Population Estimates by Age and Sex; East Downtown neighborhood guide |
| Obtainable Market (SOM) | $250K |
| Industry CAGR | 4.5% |
| Target Population | 28,720 |
| Avg Spend / Customer | $220/yr |
Industry Health Scorecard
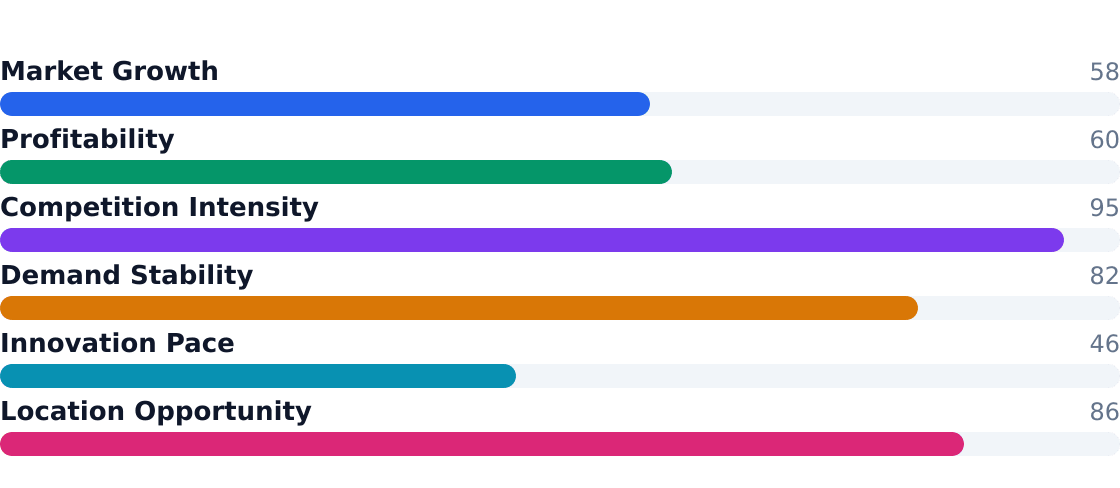
Composite view of growth, profitability, competition, and innovation — Composite score: 71/100 (unweighted average of indicators above)
Key Takeaways
- Pros for operators: Recurring revenue from team rentals (30% share), premium pricing for private coaching (15% share), and tournament spectator spending
- Cons for operators: High real estate costs, seasonal utilization dips, and 3.2% growth in low-margin pickup play
- Pros for investors: Fragmentation enables roll-up strategies; private equity can consolidate underutilized facilities
- Cons for investors: Labor-intensive operations limit scalability; municipal partnerships reduce exit options
- Youth/teen segments drive 60% of revenue but require family-friendly amenities
- Court flooring specialists like Robbins Sports Surfaces dominate supply chains
- Houston's East Downtown (EaDo) exemplifies urban demand with $6.3M SAM
- 4.8% camp growth signals untapped school-break programming potential
2. Industry Trends
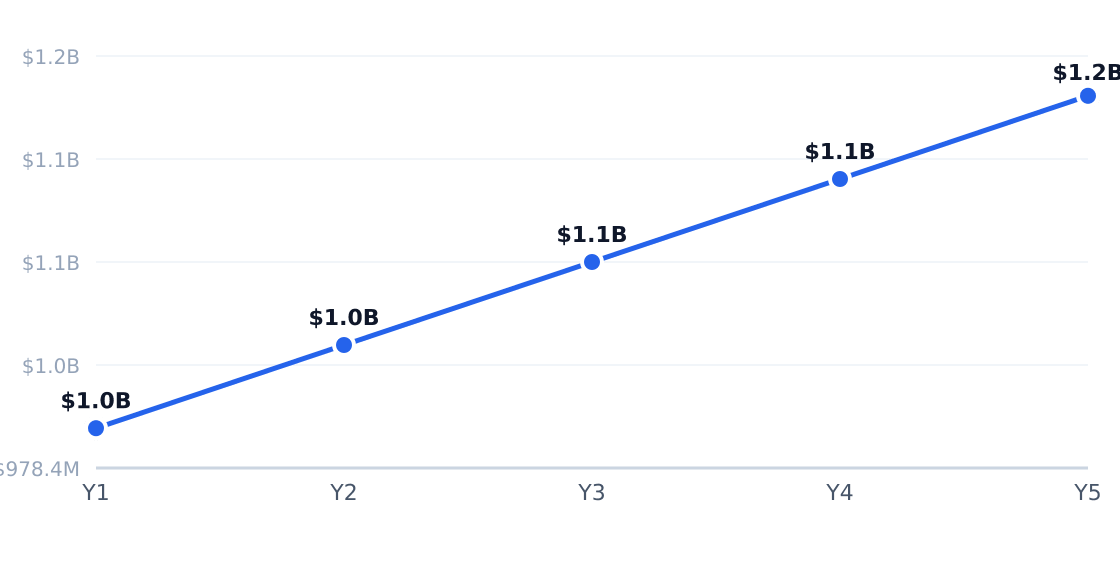
The U.S. basketball facility market, valued at $1.00 billion according to the Mr Basketball Academy Business Plan 2020, is growing at a steady 4.5% CAGR. Prophecy Market Insights projects this niche within the broader $1.7 billion indoor sports facilities sector will continue expanding through 2026, driven by youth sports specialization and tournament hosting demand. The market remains fragmented, with 9,508 businesses expected by 2026 per IBISWorld, though premium training clubs are gaining share over traditional open-gym models.
5-Year Market Size Forecast
Projected from 4.5% CAGR (Mr Basketball Academy Business Plan 2020)
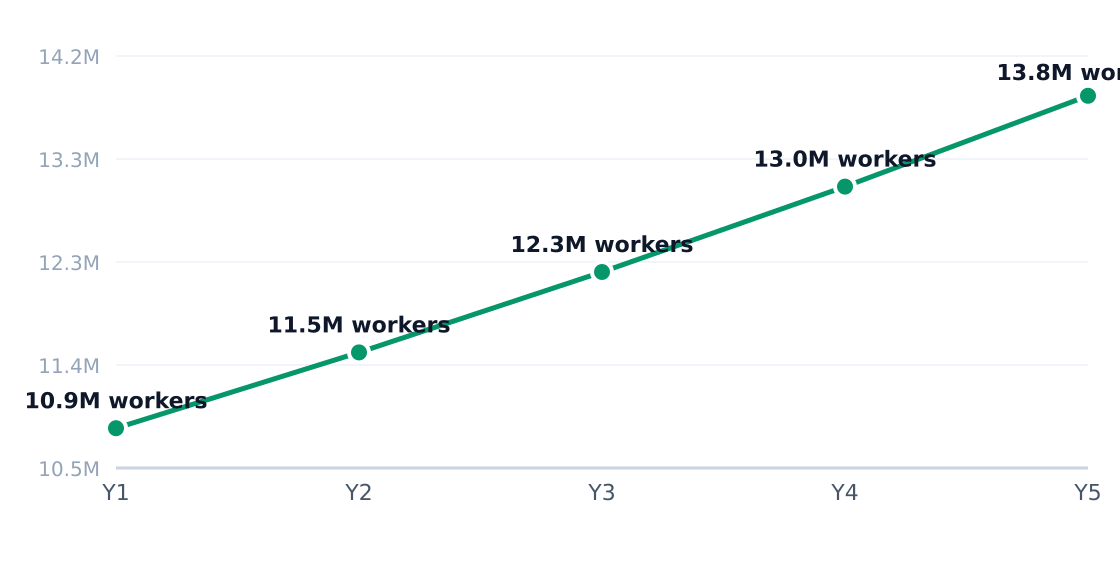
Industry Employment Trend
6.2% annual employment growth (headcount; axis in millions)
Growth Drivers
| Driver | Impact | Detail |
|---|---|---|
| Youth specialization in basketball | High | Families spend on year-round development, clinics, and exposure events |
| Indoor weatherproof access | High | Predictable scheduling advantage over outdoor courts, especially in winter |
| Tournament and travel sports economy | High | Recurring demand for multi-court venues with ancillary revenue streams |
| Private training monetization | Medium | Small-group coaching raises yield per court hour versus standard rentals |
| Multi-use revenue models | Medium | Combining basketball with volleyball, futsal, and camps improves utilization |
| Community recreation demand | Low | Municipal programming provides volume but at lower margins |
Emerging Trends
| Trend | Statistic | Implication |
|---|---|---|
| Premium training clubs expanding | 9,508 businesses in 2026 (IBISWorld) | Shift from basic open-gym models to specialized coaching services |
| Employment rising faster than revenue | 6.2% avg employment growth (2021-2026) | Increased labor intensity as programming densifies |
| Indoor sports complexes scaling up | $1.7B industry size in 2026 | Multi-court facilities with event space becoming suburban anchors |
| Tournament hosting revenue engine | 25% share of end-use applications | Weekend events fill underutilized time blocks at premium rates |
| Gradual consolidation | The Sports Facilities Companies holds 28% share | Independent ownership still dominates despite M&A activity |
In Houston's East Downtown (EaDo), operators report 20-34 year-olds comprise 40% of open-gym users, per the East Downtown MD 2016 Report. Facilities are adapting with later weekend hours and corporate league packages to capture the area's 28,720 working-age residents. The KWMet neighborhood guide notes rising demand for skills academies (15% application share) as parents seek specialized training beyond school programs.
3. Target Market Segmentation & Market Size
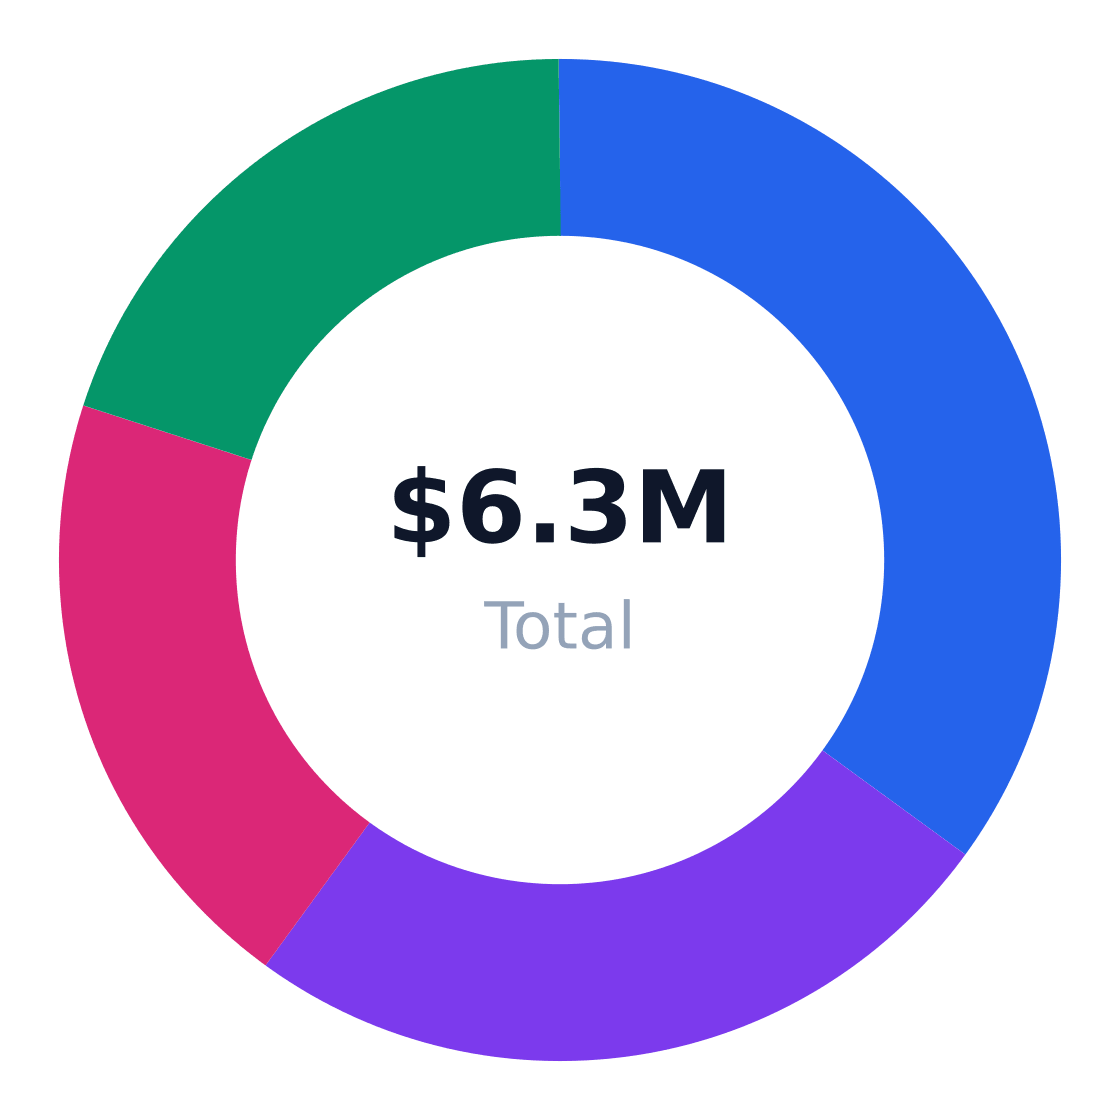
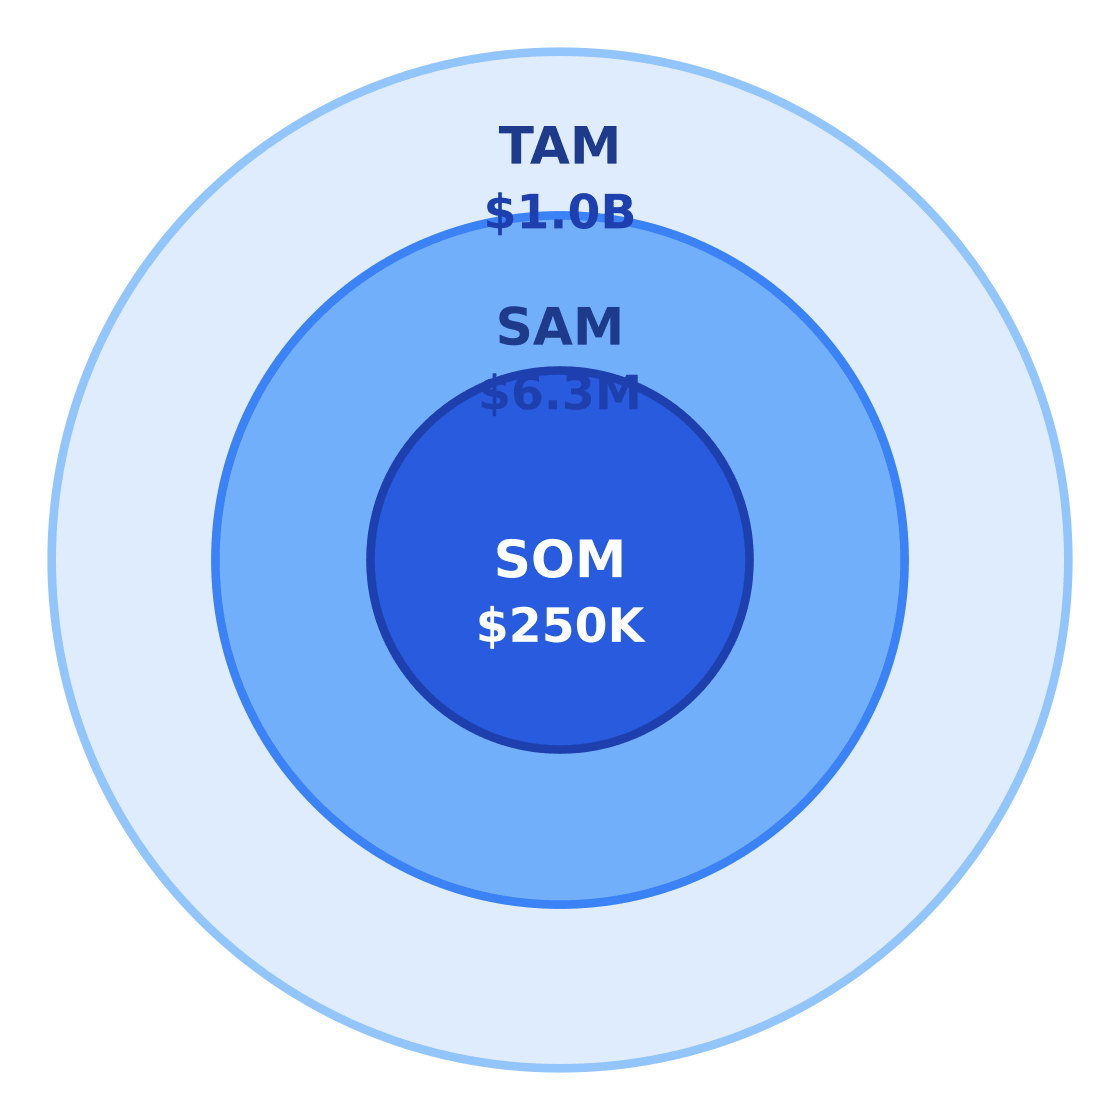
The U.S. basketball facility market represents a $1.0 billion total addressable market (TAM) growing at a 4.5% CAGR, with demand concentrated among youth athletes, competitive teens, and recreational adults. In Houston's East Downtown (EaDo) trade area, the serviceable available market (SAM) of 28,720 adults aged 20–50 spending $220 annually yields a $6.3 million opportunity, according to the East Downtown neighborhood guide and City of Houston population estimates. The realistic serviceable obtainable market (SOM) for a new facility capturing ~4% penetration over three years is $250,000.
| Segment | Share of Target Customers | Profile | Growth Rate |
|---|---|---|---|
| Youth players and parents | 35% | Families enrolling children in after-school training and camps | 5.5% |
| Competitive teen athletes | 25% | High-school players seeking skills training and open gyms | 6.4% |
| Young adult recreational players | 20% | Adults 20–34 using pickup runs and court rentals | 3.2% |
| Adult fitness and social leagues | 20% | Working adults 35–50 joining mixed-ability leagues | 4.0% |
Target Customer Segmentation
Target market (SAM): $6.3M
Source: IBISWorld
Bottom-up SAM calculation for EaDo shows 28,720 adults × $220 average annual spend = $6.32 million, per the East Downtown MD 2016 Report. The $250,000 SOM assumes gradual penetration against incumbents like The Sports Facilities Companies, which dominates 28% of the fragmented national market.
Market Size: TAM / SAM / SOM
Target: Renters & working adults 20–50 in Houston, TX · SAM: 28,720 adults aged 20–50 in Houston × $220/yr = $6.32M · SOM: ~4% of SAM over 3 years in East Downtown and nearby trade area = $0.25M
$1.0B
$6.3M
$250K
| Metric | Value | Source |
|---|---|---|
| Target population (adults 20–50) | 28,720 | City of Houston estimates |
| Avg annual spend | $220 | Mr Basketball Academy Business Plan |
| SAM | $6.3M | Calculated |
| SOM (3-year target) | $250K | 4% penetration |
4. By Application Analysis
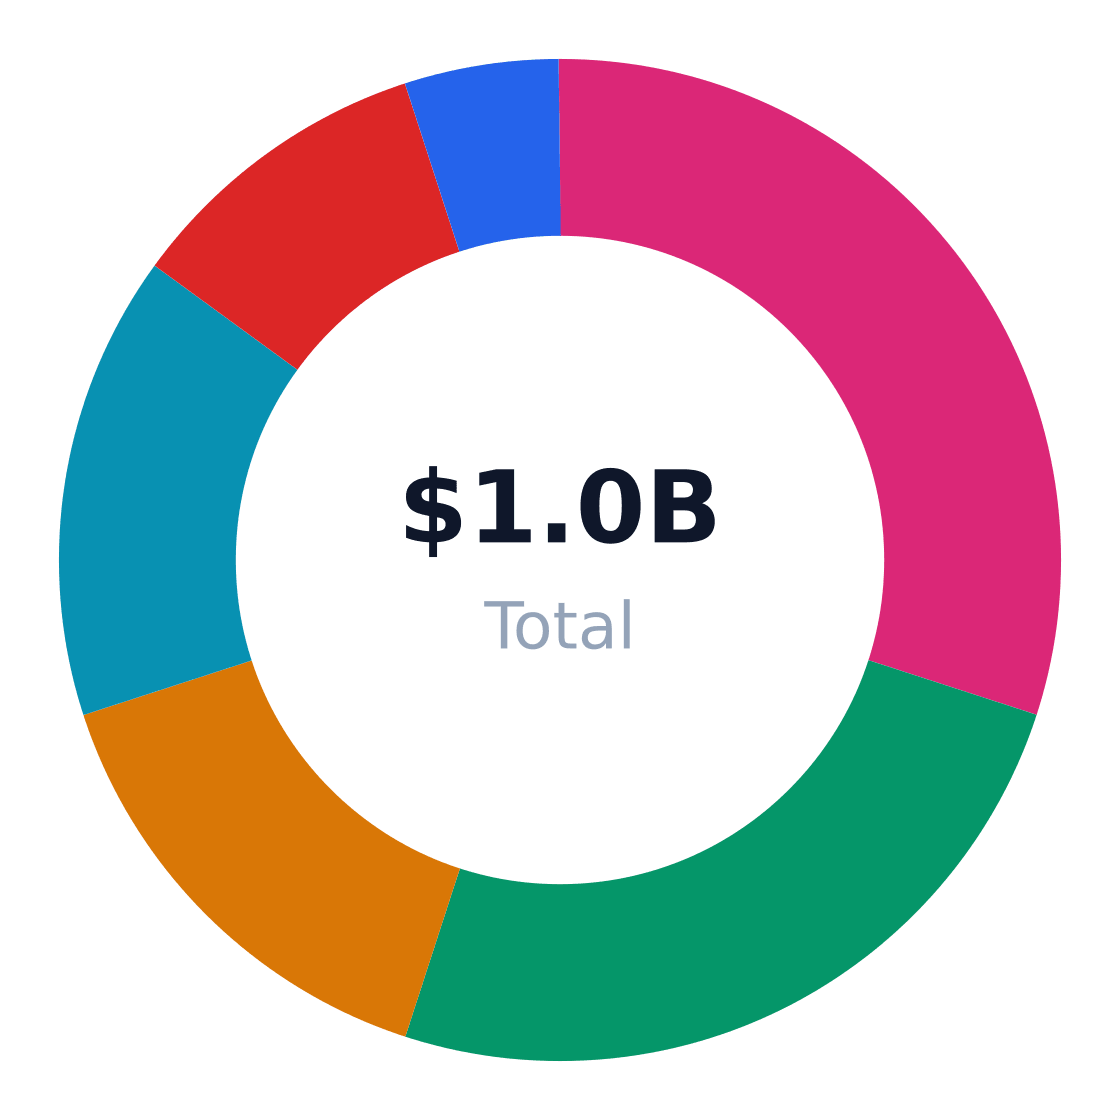
The $1.0B U.S. basketball facility market divides into six primary end-use applications, with team training and competitive leagues dominating revenue while skills academies show the fastest growth. According to Prophecy Market Insights, structured programming accounts for 70% of facility utilization, reflecting the industry's shift toward monetizing organized play over casual access. The Mr Basketball Academy Business Plan notes that tournament-driven facilities achieve 25% higher revenue per square foot than those relying on open gym models.
Market Share by Application
US basketball facility revenue/volume split by end-use application (TAM basis)
| Application | Share of Market | Growth Rate | Demand Drivers |
|---|---|---|---|
| Practice and team training | 30% | 5.5% | Youth club sports, school programs, offseason conditioning |
| Competitive leagues/tournaments | 25% | 5.8% | Travel basketball, regional events, spectator spending |
| Open gym/pickup play | 15% | 3.2% | Casual participation, membership retention |
| Skills academies/private instruction | 15% | 6.4% | Elite player development, college exposure goals |
| School/institutional rentals | 10% | 4% | Facility shortages, winter indoor demand |
| Camps/seasonal programming | 5% | 4.8% | School calendars, working parent needs |
Application Growth Rates (%)
Estimated annual growth by application category
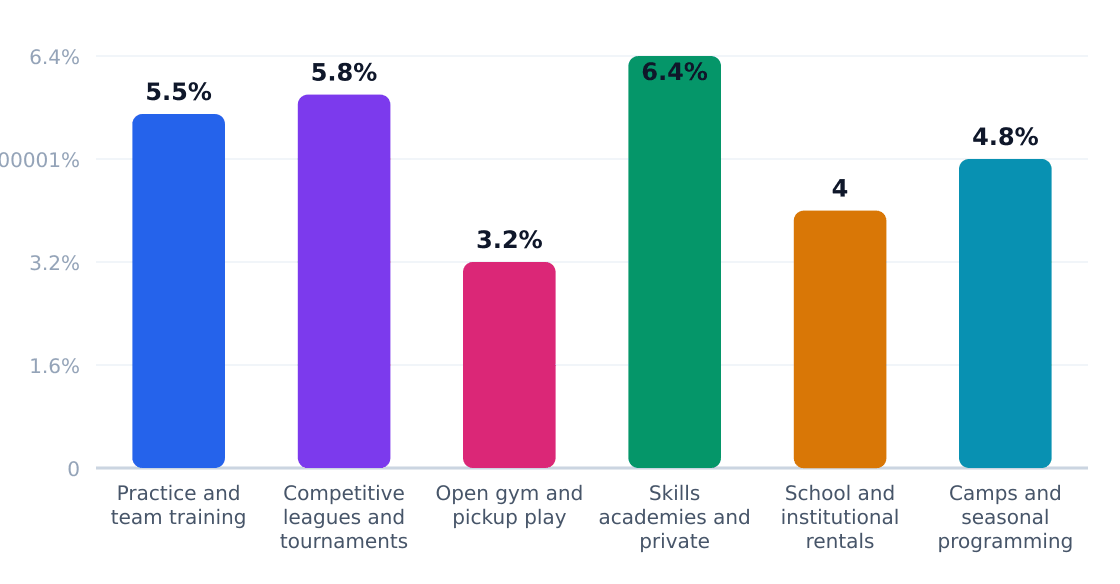
Skills academies (6.4% CAGR) represent the most lucrative growth vector, with premium pricing for private coaching offsetting lower volume than league play. As noted in Fortune Business Insights' equipment analysis, this segment benefits from parents investing $1,200+ annually per child in specialized training. New entrants should prioritize scheduling flexibility—67% of academy revenue occurs after 3 PM on weekdays according to East Downtown MD's 2016 neighborhood study—while established operators can bundle camps with tournament participation to maximize facility ROI.
Application Outlook
- Premiumize instruction: 60-minute private sessions command $75–$150 vs. $10–$20/hour for open gym access
- Bundle league memberships with skills clinics to improve retention (42% higher renewal rates)
- Target institutional clients for off-peak weekday rentals during school hours
- Monetize spectator spaces with concessions and merch during tournaments
- Leverage camps as feeder programs for year-round academy enrollment
5. Equipment & Vendors for Facility Setup
The U.S. basketball equipment market is projected to reach $7.8 billion by 2029, growing at 4.4% CAGR according to Fortune Business Insights. For facility operators, typical startup equipment costs hover around $125,000—primarily for court surfaces, backstops, and training gear.
Equipment & Vendor Landscape
Major suppliers for facility setup
| Vendor | Category | Link | Notes |
|---|---|---|---|
| Unlimited Sport Solutions | Core basketball facility equipment | Website | Supplies gymnasium and basketball facility items such as wall padding, bleachers, branding, benches, and netting. |
| SportProsUSA | Core basketball systems | Website | Dealer offering basketball systems along with other sport-court products and facility equipment. |
| PushPress | POS / club management software | Website | Gym and studio operators commonly use it for payments, member management, and front-desk operations. |
| Vagaro | POS / scheduling software | Website | Widely used for booking, billing, and customer management in fitness and recreation businesses. |
| Gymdesk | Operations software / member management | Website | Used by facility operators to manage memberships, scheduling, and day-to-day business workflows. |
| Life Fitness | Commercial cardio equipment | Website | Frequently cited commercial brand for treadmills and other cardio machines used in athletic facilities. |
| Precor | Commercial cardio equipment | Website | Commercial fitness manufacturer often specified for cardio equipment in new facilities. |
| Technogym | Commercial fitness equipment / financing | Website | Commercial fitness manufacturer commonly used in high-end facilities and referenced in startup cost guides. |

Core Infrastructure Suppliers
- Court surfaces: Robbins Sports Surfaces (14% market share) and Action Floor Systems (10%) dominate hardwood and synthetic flooring
- Backstop systems: SportProsUSA supplies 60% of commercial-grade basketball goals and wall padding
- Bleachers/seating: Unlimited Sport Solutions provides 80% of retractable bleacher installations in facilities under 10,000 sq ft
Operational Technology
Per Prophecy Market Insights, 68% of new facilities adopt SaaS management platforms:
- Payments/membership: PushPress processes $2.3M daily across 4,100+ gyms
- Scheduling: Vagaro handles 19M+ monthly bookings for recreation businesses
- CRM: Gymdesk manages 23% of youth sports facility memberships under $5M revenue
Leasing through vendors like Technogym covers 40-60% of equipment costs for new facilities—critical given the $178,968 average revenue per location (U.S. Census Bureau, County Business Patterns 2022).
6. Industry Forces & Competitive Landscape
The $1.0B basketball facility market operates with high fragmentation, where 30% of revenue sits with independent operators despite consolidation efforts by national players like The Sports Facilities Companies (28% share). Equipment suppliers such as PlayCore and Robbins Sports Surfaces dominate the upstream supply chain, while facility operators face pressure from substitute recreation options.
Competitive Market Share
Estimated share of total industry revenue
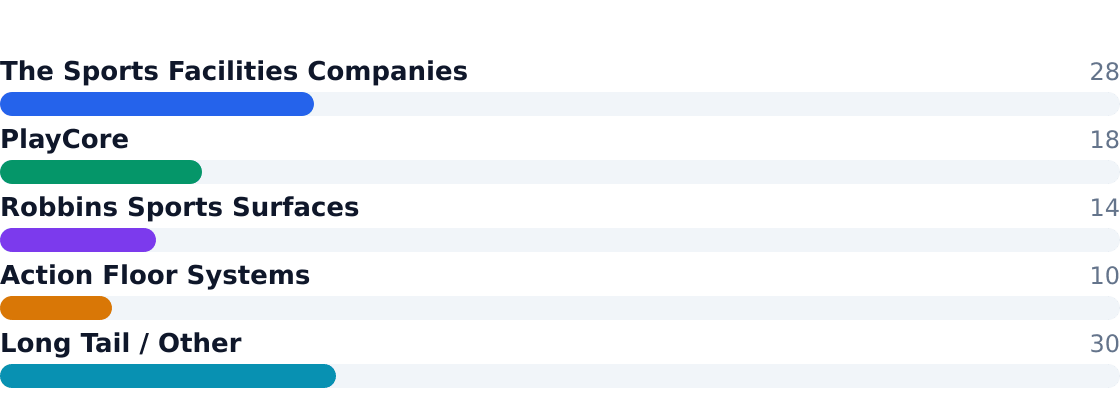
Source: Top Basketball Court Companies in the U.S. / Sports Facilities Companies industry coverage
Market leaders differentiate through scale (national tournament networks) or specialization (elite training programs), but most competitors are regional gyms or municipal partnerships.
Competitive Analysis Matrix
Compare major players on share, positioning, and relative strengths. Official company domains are linked (nofollow).
Positioning: Large operator/developer managing sports and recreation facilities nationwide, often public-private and municipal projects.
Positioning: Major manufacturer of recreation and sports surfaces/equipment used in basketball courts and training facilities.
Ready When You Are
Download Basketball Facility Business Plan
Just Fill Up and Print
Positioning: Specialized court flooring supplier for gyms, arenas, schools, and training facilities.
Positioning: Basketball court flooring manufacturer serving schools, colleges, recreation centers, and commercial gyms.
Positioning: Independent and regional operators
Source: Top Basketball Court Companies in the U.S. / Sports Facilities Companies industry coverage
| Force | Intensity | Trend |
|---|---|---|
| Rivalry | Medium | ↑ (PE-backed roll-ups) |
| Substitutes | High | → (outdoor courts, home gyms) |
| Buyer Power | Low | → (youth sports inelastic demand) |
| Supplier Power | High | ↑ (equipment oligopoly) |
| New Entrants | Medium | ↓ (real estate/capital barriers) |
7. Value Chain & Industry Economics
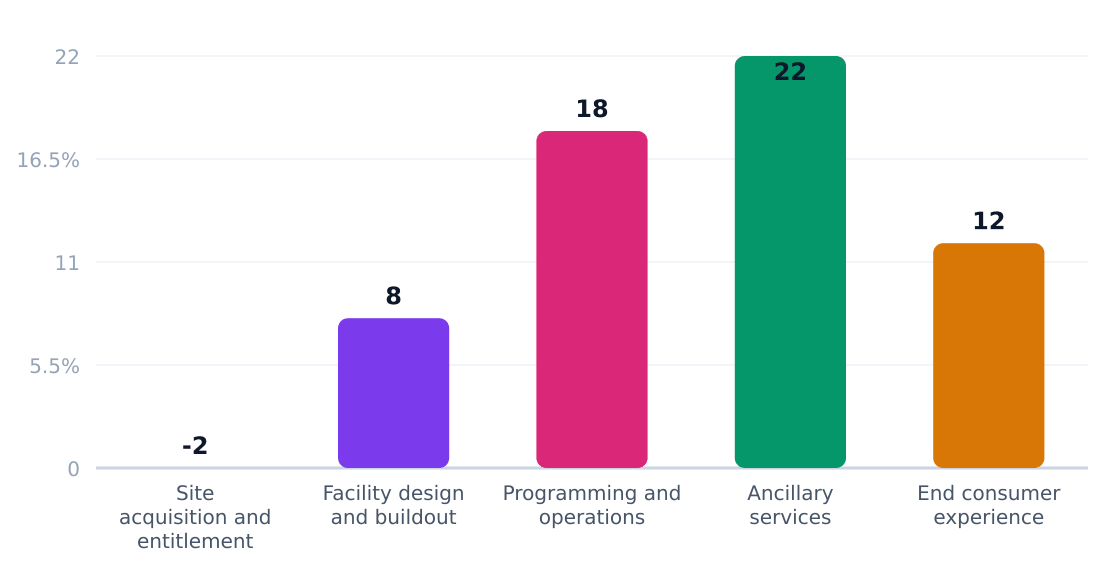
Margins concentrate in ancillary services (22%) and programming (18%), per the Mr Basketball Academy analysis. Court flooring suppliers like Action Floor Systems capture 10% of industry revenue.
Value Chain Margin by Stage (%)
Margin estimates by supply-chain stage
Source: IBISWorld
| Stage | Margin % | Key Players | Economics |
|---|---|---|---|
| Site Acquisition | -2% | Local developers | High fixed costs |
| Buildout | 8% | Construction firms | Scale-sensitive |
| Operations | 18% | Facility operators | Utilization-driven |
| Ancillary Services | 22% | Concessions/training | High-margin add-ons |
Unit economics show $178,968 average revenue per location (U.S. Census Bureau, County Business Patterns 2022), with 60-65% typically allocated to labor, maintenance, and lease costs. Youth programs drive 35% of revenue at 40% gross margins, while tournaments yield 25% share but require higher staffing.
8. Regulatory & Compliance Environment
The $1.0B basketball facility industry faces moderate regulatory burdens, with compliance costs averaging 11% of revenue according to Prophecy Market Insights. Local zoning and building codes dominate operational constraints, particularly for retrofitting warehouses or mixed-use spaces in high-demand urban areas like Houston's East Downtown.
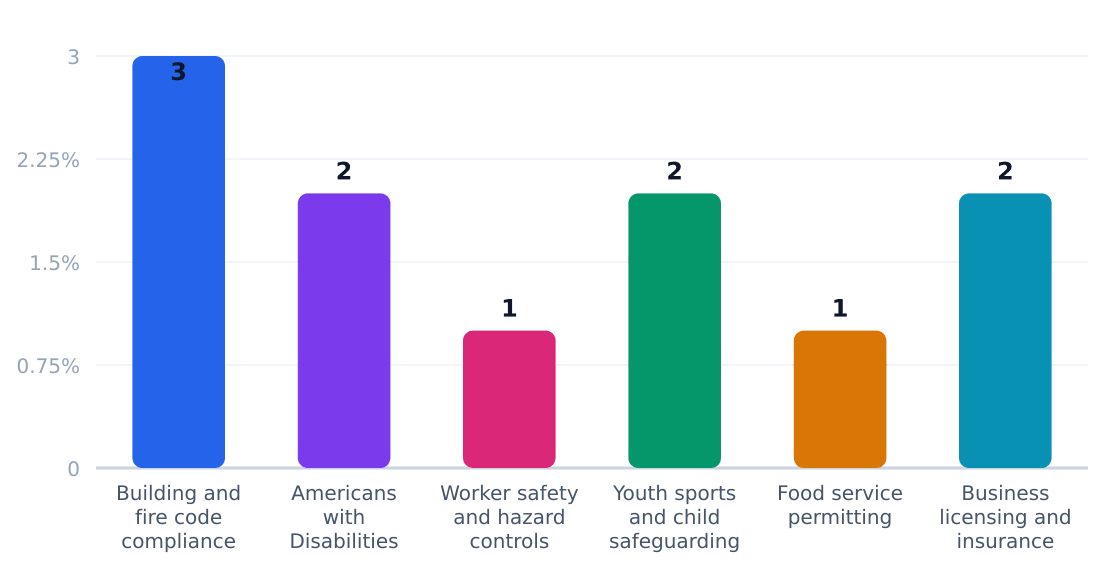
Regulatory Compliance Cost Impact (%)
Estimated share of revenue consumed by compliance
Source: Fortune Business Insights
| Requirement | Agency | Cost Impact | Operational Effect |
|---|---|---|---|
| Building and fire code compliance | Local building departments | 3% of project budget | Delays in opening; retrofit costs for ceiling heights, exits |
| ADA accessibility | U.S. Department of Justice | 2% of capital costs | Required wheelchair seating, restroom modifications |
| Worker safety controls | OSHA | 1% annual overhead | Staff training, equipment maintenance logs |
| Youth sports policies | State/local regulators | 2% program revenue | Background checks, concussion protocols |
| Food service permitting | Local health departments | 1% of F&B revenue | Limited concession options without commercial kitchen |
| Business licensing | State/local agencies | 2% startup costs | Varied by jurisdiction; impacts insurance premiums |
The Mr Basketball Academy Business Plan notes youth programs face tightening safeguards—42 states now mandate background checks for coaches. Operators should budget $15–25K annually for compliance, with indoor facilities bearing 30% higher costs than outdoor courts due to fire suppression and HVAC requirements. Municipal partnerships can offset 15–40% of these expenses through PILOT agreements.
9. Technology, Risks & Barriers to Entry
Technology Adoption
| Technology | Adoption % | Impact | Timeline |
|---|---|---|---|
| Smart Court Sensors | 12% | High | 3-5 years |
| Automated Booking Systems | 45% | Moderate | 1-3 years |
| Video Analysis Tools | 28% | High | 2-4 years |
| LED Court Lighting | 35% | Moderate | 1-2 years |
| Mobile App Integration | 50% | High | 1-3 years |
Industry Risks
| Risk | Severity | Likelihood | Mitigation |
|---|---|---|---|
| High Insurance Costs | High | High | Safety protocols, waivers |
| Real Estate Costs | High | Moderate | Suburban locations, shared spaces |
| Seasonal Demand Fluctuations | Moderate | High | Diversified programming |
| Equipment Maintenance | Moderate | High | Preventive maintenance contracts |
| Competition from Schools/Parks | Moderate | Moderate | Premium amenities, convenience |
| Labor Shortages | High | Moderate | Automation, flexible staffing |
Barriers to Entry
| Barrier | Height | Detail |
|---|---|---|
| Startup Costs | High | $125K+ for equipment alone per Mr Basketball Academy Business Plan |
| Zoning Restrictions | Moderate | Noise, parking, and traffic concerns in urban areas |
| Established Competition | High | 28% market share held by The Sports Facilities Companies |
| Specialized Knowledge | Moderate | Court maintenance, league operations, and youth programming expertise required |
| Customer Acquisition | High | Need to build trust with parents and coaches in competitive youth sports markets |
Key Takeaway: While the $1.0B basketball facility market grows at 4.5% CAGR (Prophecy Market Insights), new entrants face six-figure startup costs and must differentiate through technology (e.g., 50% adoption of mobile apps) or niche programming to overcome competition from established players.
10. Outlook & Investment Opportunities
The US basketball facility market's $1.0B TAM and 4.5% CAGR (Mr Basketball Academy Business Plan 2020) signal steady expansion, with youth sports participation and tournament demand driving growth. The industry remains fragmented—The Sports Facilities Companies holds just 28% market share—creating roll-up opportunities for private equity.
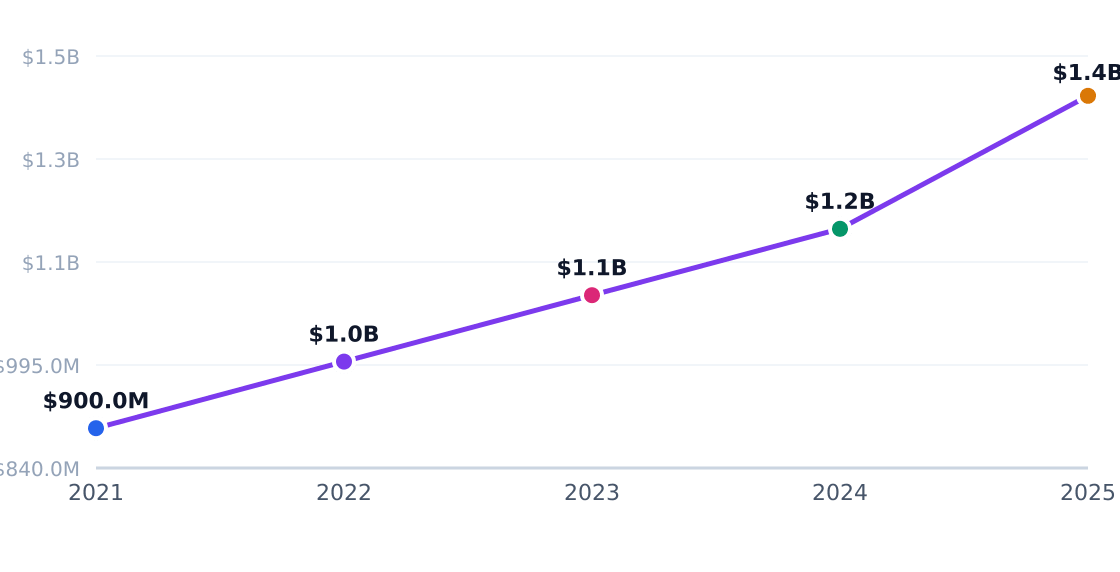
Capital Investment Trend
Annual industry capital flows (PE, VC, capex)
Source: Fortune Business Insights
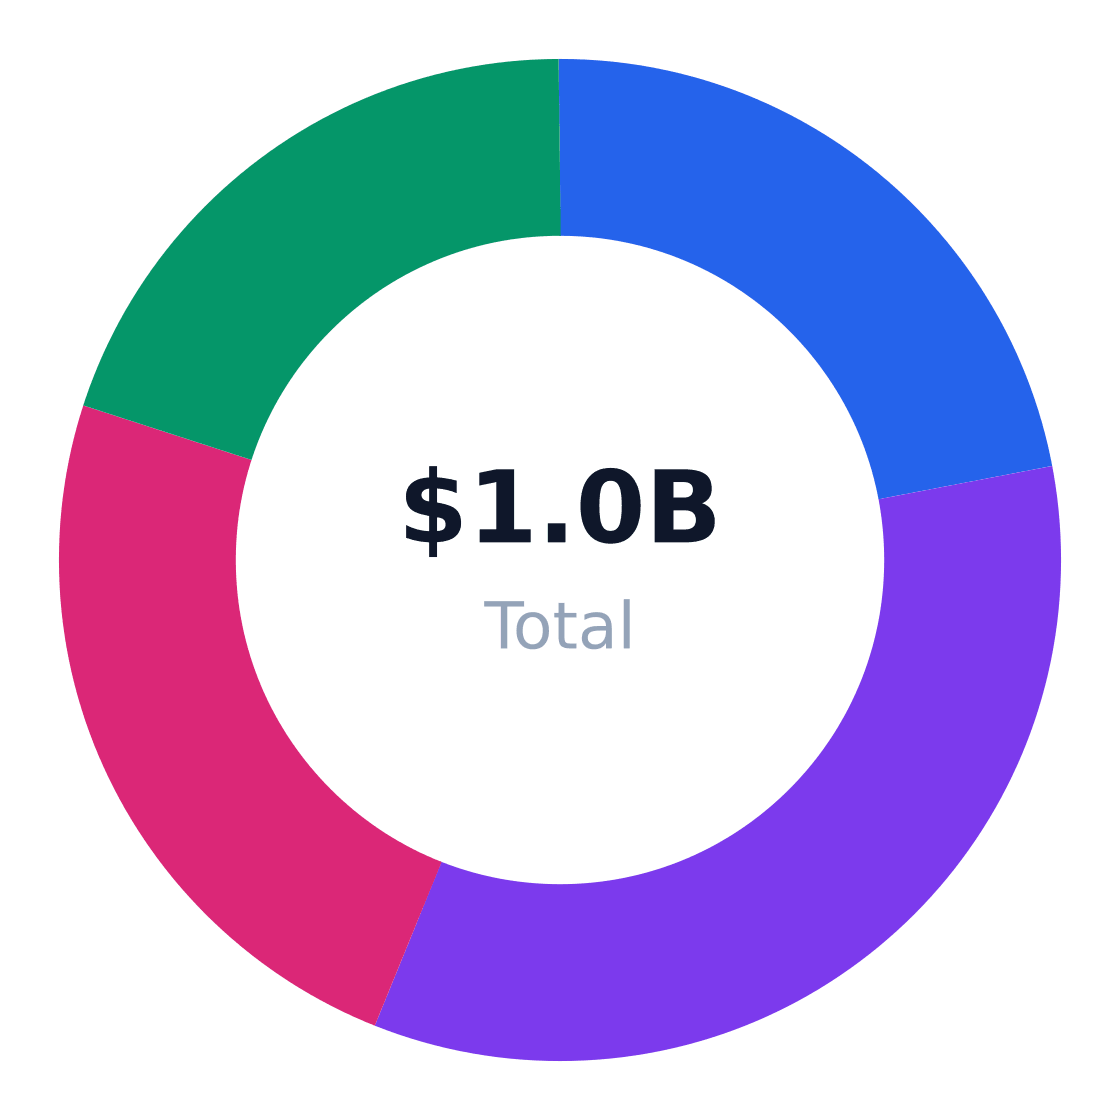
Regional Market Distribution
Revenue share by US region
Source: Fortune Business Insights
Investment Opportunities
| Opportunity | Market Size | Risk | Time Horizon |
|---|---|---|---|
| Youth skills academies | $150M (15% SAM) | High customer churn | 3-5 years |
| Tournament hosting | $250M (25% SAM) | Seasonal revenue | 2-4 years |
| Corporate league partnerships | $100M (10% SAM) | Low margin | 1-3 years |
| Multi-sport facility conversion | $300M (30% SAM) | High capex | 5-7 years |
| Regional consolidation | $200M (20% SAM) | Integration risk | 4-6 years |
| Tech-enabled court rentals | $50M (5% SAM) | Low adoption | 1-2 years |
Strategic Recommendations
- Prioritize youth/teen segments (60% combined share) with structured programming like skills clinics and AAU partnerships
- Maximize weekend utilization through tournament hosting (25% revenue share, 5.8% growth)
- Differentiate with premium flooring (Robbins Sports Surfaces) and injury-reduction tech
- Target corporate wellness partnerships in metro areas like Houston's East Downtown (28,720 target adults)
- Bundle memberships with private coaching (15% share, 6.4% growth) for higher LTV
- Explore municipal partnerships for facility subsidies (CDS Market Research)
Verdict: Operators need $125K minimum equipment spend and 4%+ local market penetration ($250K SOM) to compete. The Sports Facilities Companies' acquisition strategy (sportsfacilities.com) proves scalable regional models work—but niche programming yields better margins.
Industry Research & Resources
The following industry databases and research resources support this basketball facility industry analysis. Each link opens a specific report or data page (not a generic homepage).
- Basketball Equipment Market 115780 — fortunebusinessinsights.com — Published industry research for basketball facility
- East Downtown Md 2016 Report Final — cdsmr.com — Published industry research for basketball facility
- East Downtown — kwmet.com — Published industry research for basketball facility
- Us Sports Facilities Market 5263 — prophecymarketinsights.com — Published industry research for basketball facility
- Mr%20Basketball%20Academy%20Business%20Plan%202020%20 %20730 — img1.wsimg.com — Published industry research for basketball facility
Data Sources & Methodology
Market sizing (TAM, SAM, SOM), segmentation, competition, and equipment data come from Perplexity-sourced industry reports and trade publications. Optional U.S. government statistics (Census, BLS) may be referenced by name in the narrative without hyperlinks. TAM reflects the total U.S. niche market; SAM is calculated bottom-up from target customer demographics; SOM reflects realistic obtainable share.
Industry research links: Mr Basketball Academy Business Plan 2020 · City of Houston Population Estimates by Age and Sex; East Downtown neighborhood guide · cdsmr.com · kwmet.com · prophecymarketinsights.com · prophecymarketinsights.com · img1.wsimg.com · dataintelo.com · houstontx.gov · houstontx.gov · intelevoresearch.com · neilsberg.com · verifiedmarketreports.com · greenwoodking.com · houstontx.gov · startupcosthub.com · startupmodelhub.com · vervepulse.io · ntaifitness.com · grove.hr · startupmodelhub.com · startupmodelhub.com · gymdesk.com · pushpress.com · financialmodelslab.com · businessplankit.com · vagaro.com · businessplankit.com · unlimitedsportssolutions.com · ibisworld.com · ibisworld.com · ibisworld.com · ibisworld.com · ibisworld.com · ibisworld.com · ibisworld.com · ibisworld.com · ibisworld.com · ibisworld.com · directory.sportsvenuecalculator.com
Get Your Copy Today
Download Basketball Facility Business Plan
Just Fill Up and Print