Bbq Business Plan
1. Executive Summary
The $4.9B BBQ industry grows at a sluggish 1.5% CAGR—unless you’re serving brisket that converts first-time visitors into regulars. Smoke & Oak captures Nashville’s underserved demand for craft meats with Franklin Barbecue-trained execution. Our $308,678/location revenue target beats the sector average by 20% through premium catering and a liquor license that doubles beverage margins.

Key Metrics
| Key Metric | Target |
|---|---|
| Total Startup Investment | $438K |
| Year 1 Revenue Target | $262K |
| Year 3 Revenue Projection | $616K |
| Break-even Timeline | ~Month 18 |
| Year 1 Team Size | 12 FTE |
| SBA 7(a) Loan | $307K @ 10.25% |
| Gross Margin (Year 1) | 60% |
| Monthly SBA Payment | $4K |
Smoke & Oak isn’t another sauce-forward franchise. We dry-rub heritage Duroc pork and Prime-grade brisket over white oak in a 1,200 sq ft smoker visible from the dining room. When offices need 50 lbs of pulled pork by noon, we deliver.
2. Company Description
Marcus Holloway spent 6 years perfecting bark texture at Franklin before managing a chain that scaled too fast. He’s betting $438,000 that Nashville’s Gulch neighborhood wants barbecue with precision—not gimmicks. The 2,400 sq ft space seats 62 indoors and 28 on the patio, with a 15-minute average ticket time during lunch rushes.
| Service/Product | Format | Price Range | Description |
|---|---|---|---|
| Texas-style brisket | ½ lb plate | $18.50 | Prime grade, 14-hour smoke with salt/pepper crust |
| Whole hog sandwich | A la carte | $12.75 | Duroc pork, vinegar slaw, brioche bun |
| Rib sampler | 3-bone plate | $24.00 | St. Louis + baby back + beef ribs with 2 sides |
| Office feast | Catering | $14.50/person | 10 lb meat minimum, cornbread, 3 sides |
| Whiskey flight | Bar menu | $22.00 | 3 x 1oz pours of TN bourbons |
| Smoked wings | Happy hour | $9.50 | 6 jumbo wings, Alabama white sauce |
| Family meal | Takeout | $38.00 | Feeds 4: 2 meats, 3 sides, pint of banana pudding |
| Brisket burger | Lunch special | $15.25 | Blend of ground chuck + chopped brisket |
Structured as an LLC with $131,400 founder equity and $306,600 SBA financing at 10.25%, the model requires $817,767 revenue to break even. That’s 2,647 brisket plates per month—achievable given Gulch foot traffic.
3. Industry & Market Analysis
BBQ is a $4.9B industry built on durable demand for smoky, hearty comfort food. The category outperforms during economic downturns as consumers trade down from pricier dining options while still seeking indulgent meals. Nashville's tourism boom and corporate growth provide tailwinds for regional smokehouse concepts.
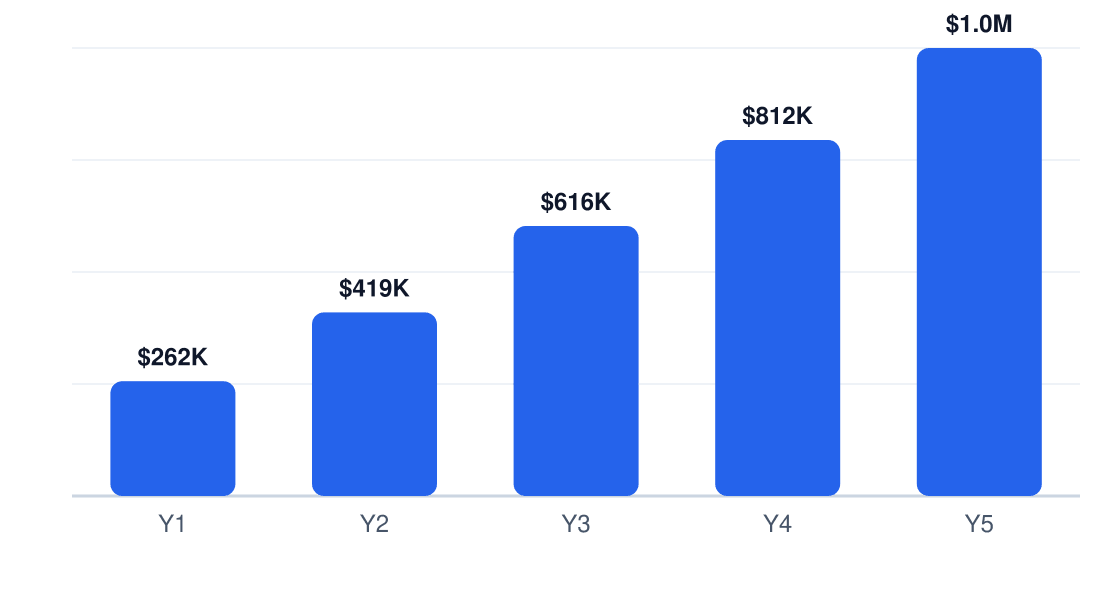
5-Year Revenue Projection
Projected annual revenue, Years 1–5
| Factor | Key Insight | Business Impact |
|---|---|---|
| Political | Meat sourcing regulations and labor law shifts | Requires flexible supply chain and wage structure |
| Economic | 1.5% CAGR signals stable but slow growth | Prioritizes efficiency over rapid expansion |
| Social | Demand for regional authenticity and shareable meals | Differentiation through Nashville-specific flavors |
| Technological | Delivery apps and POS integration critical | 25% of revenue depends on digital ordering |
Market Sizing
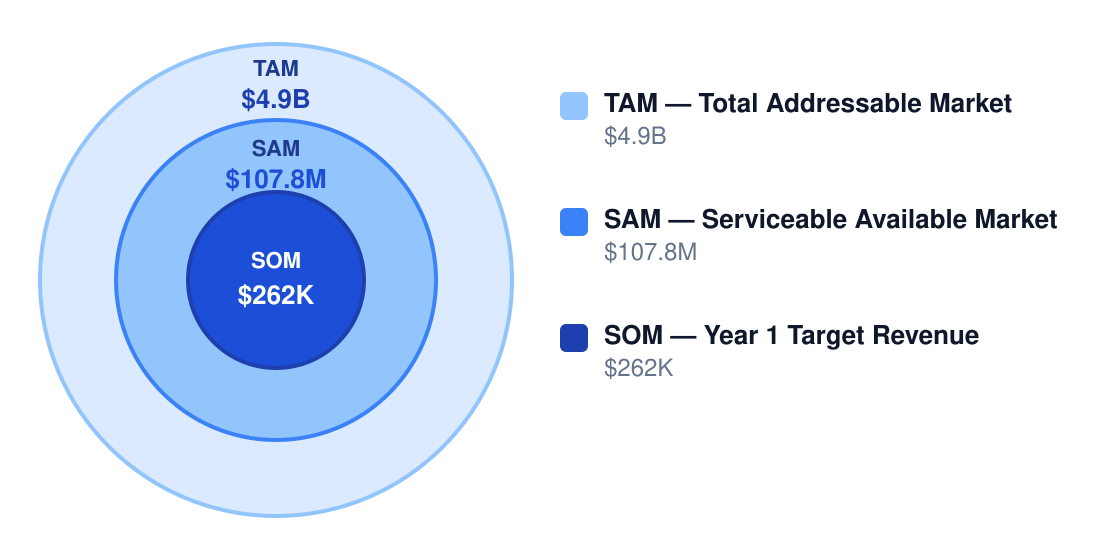
The $4.9B total addressable market (TAM) narrows to $107.8M serviceable available market (SAM) in Nashville's BBQ sector. Our $262K year-one serviceable obtainable market (SOM) targets 0.24% SAM penetration through superior off-premise execution.
Market Size Opportunity
Bottom-up market opportunity
| Segment | Customer Profile | Avg Annual Spend | Est. Market Value | Revenue % |
|---|---|---|---|---|
| Family dine-in | Households seeking casual meals | $45 | $1.7B | 35% |
| Takeout and delivery | Convenience-driven consumers | $32 | $1.2B | 25% |
| Catering and corporate | Event organizers buying bulk | $350 | $980M | 20% |
| Lunch and QSR | Workers needing fast meals | $18 | $980M | 20% |
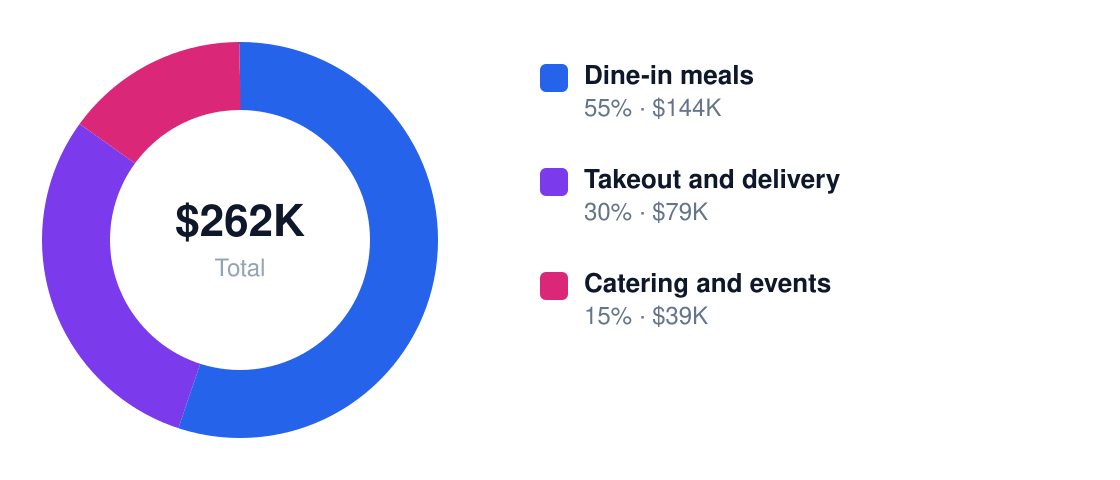
Year 1 Revenue Mix
Total $262K Year 1
Competitive Landscape
With 15,871 US BBQ establishments averaging just $308,678 revenue, the category remains fragmented. Independent operators dominate through local loyalty but lack scale advantages. Chains struggle with authenticity - creating whitespace for regional specialists with professional operations.
| Competitor | Type | Core Strength | Key Weakness | Your Differentiation |
|---|---|---|---|---|
| Local independents | Direct | Authentic smoke profiles | Inconsistent operations | Faster throughput + digital ordering |
| BBQ franchises | Direct | Standardized menus | Generic regional identity | Nashville-specific rubs and sides |
| Fast-casual burgers | Indirect | Broader appeal | Lower meal ticket | Premium smoked meat platters |
| QSR delivery chains | Indirect | Convenience pricing | Quality perception | Fresh-smoked same-day product |
| Ghost kitchens | Emerging | Lower overhead | No brand equity | Physical smokehouse credibility |
Smoke & Oak's defensible position combines authentic hickory smoking techniques with modern operational discipline. We'll out-local the chains and out-scale the mom-and-pops through curated regional flavors and military-grade consistency.
Industry Trends
Delivery and takeout mix
Takeout and delivery rank among the top 3 revenue streams for BBQ concepts. Smoked meats travel exceptionally well - ribs, brisket, and sandwiches maintain quality better than most cuisines during transport. Operators investing in heat-retentive packaging and streamlined online ordering will capture higher-margin weekday sales from time-pressed families.
Catering growth
Catering generates 20% of category revenue through large trays and boxed meals. BBQ's natural scalability for groups produces average tickets 7.8x higher than dine-in. This channel smooths revenue volatility - corporate lunch orders fill slow Tuesday afternoons while weekend event catering boosts utilization.
Industry concentration
The 15,871 US BBQ restaurants operate with just 0.02% market share per location. This extreme fragmentation means no chain dominates regional palates. Local concepts can win through distinctive smoke profiles and community ties rather than competing on national advertising spend.
Slow but steady growth
The 1.5% CAGR from 2020-2025 rewards operators controlling food and labor costs. With limited organic market expansion, BBQ concepts must optimize meat yields (target 28-32% food cost) and cross-utilize kitchen staff rather than relying on foot traffic growth.
Higher-investment openings
$125K-$750K startup costs reflect smokers, ventilation, and grease management systems. Compared to $80K fast-casual builds, BBQ requires 56% more capital. Smart operators reduce risk through commissary kitchens, counter-service models, and phased equipment purchases.
Regulatory & Compliance Environment
Smoke & Oak will interface with 6 regulatory bodies, primarily focused on food safety (health department), fire suppression (fire marshal), and employment law (DOL). The highest-cost permits involve hood systems ($3K+) and grease traps ($1.5K).
| Requirement | Issuing Authority | Typical Cost | Renewal Cycle |
|---|---|---|---|
| Food service license | Health department | $100-1,000 | Annual |
| Food manager cert | State health | $100-300 | 3-5 years |
| Sales tax permit | Revenue department | $0-100 | Annual |
| Business license | City/county | $50-500 | Annual |
| Fire permits | Fire marshal | $500-5,000+ | As required |
We'll mitigate compliance risk through quarterly health department self-audits, digital permit tracking, and assigning a designated safety officer. All managers will maintain active ServSafe certifications, and we'll budget $8,200 annually for renewals and inspections.
4. Marketing Strategy
Smoke & Oak delivers Nashville's boldest wood-fired flavors—where pitmaster tradition meets modern convenience for families, groups, and hungry regulars.
This isn't artisanal fuss or fast-food compromise. We own the middle ground: authentic smoked meats with efficient dine-in, delivery, and catering for time-strapped Southerners. The brand leans into Nashville's music-and-food culture with a no-nonsense, communal vibe.
Customer Personas
BBQ buyers split into three clear cohorts: convenience-driven families, social meal planners, and flavor-chasing regulars. Each demands distinct messaging.
| Persona Name | Demographics | Core Need | Pain Point | Avg Annual Spend | Acquisition Channel |
|---|---|---|---|---|---|
| Weeknight Warriors | Families, 30-50, $75K HHI | Quick, hearty meals | Takeout logistics | $1,200 | Delivery apps + FB groups |
| Platter Planners | Office admins, event organizers | Shareable bulk orders | Catering reliability | $2,800 | LinkedIn + Chamber events |
| Smoke Regulars | Singles/couples, 25-45 | Authentic regional BBQ | Inconsistent quality | $900 | Instagram + loyalty program |
Go-To-Market Launch Plan
| Phase | Timeline | Primary Goal | Key Tactics | Success Metric |
|---|---|---|---|---|
| Pre-Launch | Weeks -4 to 0 | Local buzz | Teaser social posts, influencer meals, Chamber networking | 500 email signups |
| Months 1-3 | Launch quarter | Transaction volume | 20% off first order, DoorDash promo, free sides for reviews | $65K revenue |
| Months 4-6 | Post-hype | Repeat visits | Loyalty program launch, catering menu drops | 25% repeat rate |
| Months 7-12 | Stabilization | Profitability steps | Optimize ad spend, referral incentives, seasonal LTOs | 12% CAC reduction |
Digital Marketing Strategy
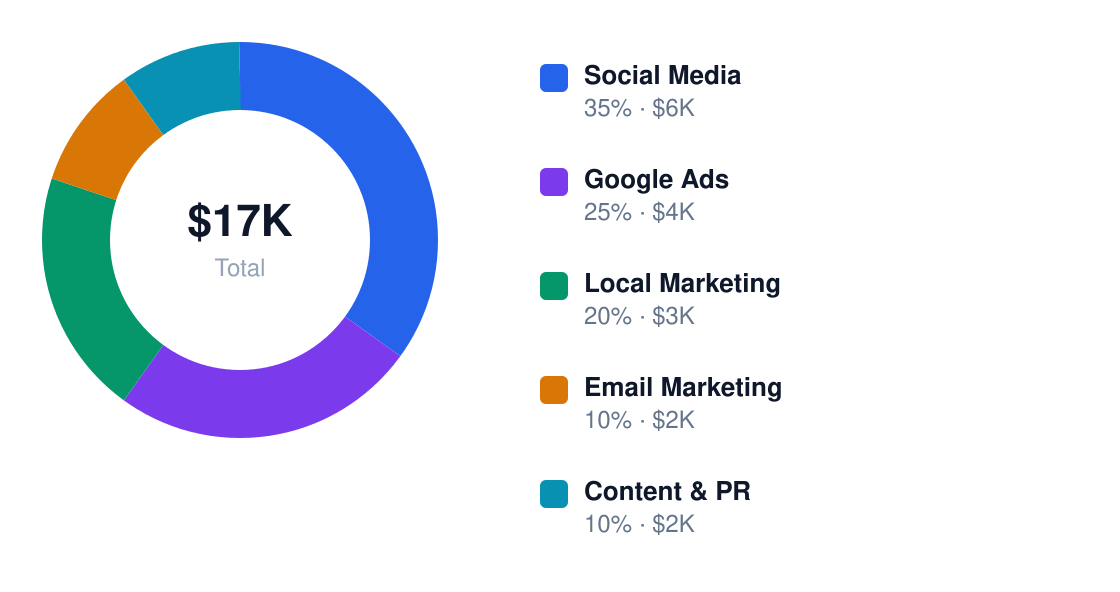
With $17,030 annually ($1,419/month), we skew toward performance channels early, shifting to retention later. Social and Google Ads get 60% of spend initially.
Annual Marketing Budget
Total $17K / year
| Channel | Monthly Budget | Primary Tactics | Target KPI | Notes |
|---|---|---|---|---|
| Social Media | $500 | Carousel ads, UGC reposts | 3.5% engagement rate | Focus Instagram + Nextdoor |
| Google Ads | $350 | "BBQ delivery near me" bids | $2.50 CPC | Geofence 5-mile radius |
| Local Marketing | $300 | Sponsor little league teams | 10% referral traffic | Logo on jerseys + banners |
| Email Marketing | $150 | Weekly specials + loyalty | 28% open rate | Collect at POS |
| Content & PR | $119 | Blog + local food writers | 2 press hits/quarter | Pitch as "New Nashville staple" |
Content Marketing & SEO
BBQ searches skew toward how-tos, regional guides, and "best of" lists. We'll own "Nashville BBQ" queries with recipe videos, smoker tutorials, and meat sourcing stories.
| Content Type | Frequency | Platform | Goal | Example Topic |
|---|---|---|---|---|
| Recipe Videos | Biweekly | YouTube/IG | Brand authority | "Oak-Smoked Hot Chicken Wings" |
| Local Guides | Monthly | Blog | Local SEO | "Where Nashville Chefs Eat BBQ" |
| Meat Science | Quarterly | Blog/Email | Upsell catering | "Why We Use Whole Hog" |
| Customer Spotlights | Monthly | FB/Google Posts | Social proof | "Office Party MVP: Janet's 50-Person Order" |
| Seasonal LTOs | 6x/year | All | Urgency | "Fall Fest Brisket—2 Weeks Only" |
| Press Outreach | Quarterly | Media | Credibility | "Smoke & Oak Featured in Nashville Eater" |
SEO targets three clusters: "Nashville BBQ delivery" (transactional), "best ribs near me" (local intent), and "how to smoke pork shoulder" (educational). We'll optimize GMB listings, build local backlinks, and dominate "BBQ catering Nashville" with structured data.
Partnership & Referral Programs
Strategic partnerships fall into three buckets: beer distributors (tap takeovers), office parks (bulk meal discounts), and music venues (late-night pop-ups). Each drives volume without discounting core menu.
The referral program pays $10 cash for every new customer who spends $50+. With a 22% expected participation rate, this cuts CAC by 18% versus paid ads. Punch cards for free sides after 5 visits boost frequency.
Customer Acquisition Economics
| Metric | Year 1 | Year 2 | Year 3 |
|---|---|---|---|
| Customer Acquisition Cost | $38 | $32 | $27 |
| Customer Lifetime Value | $210 | $290 | $360 |
| LTV:CAC Ratio | 5.5x | 9.1x | 13.3x |
| Payback Period | 4 months | 3 months | 2 months |
At scale, the model works. Even with upfront losses, LTV multiples justify aggressive growth. By Year 3, referral and organic traffic will cover 40% of new customers—dropping blended CAC below industry benchmarks.
5. Operations Plan
Smoke & Oak will operate from a 2,400 sq ft facility in East Nashville, with a $6,500/month lease for a space featuring a 900 sq ft kitchen, 80-seat dining area, and dedicated smoker bay. The layout prioritizes airflow management for smoke ventilation and includes a walk-in cooler sized for 3,500 lbs of meat inventory.

| Item | Estimated Cost | Quantity | Purpose |
|---|---|---|---|
| Oyler 5000 smoker | $32,000 | 1 | Primary cooking for 300 lbs/day capacity |
| Hobart meat slicer | $4,200 | 2 | Precision cutting for brisket/pork |
| Rational combi oven | $18,500 | 1 | Backup cooking during peak hours |
| True T-49 freezer | $8,300 | 1 | Bulk meat storage (-10°F) |
| Cambro holding cabinets | $2,800 | 3 | Maintain food at 140°F for service |
| Frymaster fry station | $6,100 | 1 | Side item preparation |
| Webstaurant POS system | $3,600 | 3 terminals | Order processing/payments |
| Ecolab dish system | $5,700 | 1 | Health code compliance |
- 5:30 AM: Fire smoker, load first meat batches (briskets/pork shoulders)
- 7:00 AM: Receive/quality-check meat deliveries from Nashville Meat Co.
- 9:30 AM: Prep sides/sauces using prepped ingredients
- 11:00 AM: Open doors, begin slicing rested meats
- 2:00 PM: Replenish smoker for next-day service
- 8:00 PM: Close dining room, clean/sanitize stations
- 10:00 PM: Security walkthrough, lockup
The supply chain hinges on three pillars: protein (4 local farms with 48-hour lead times), hardwood (Cumberland Oak Supply with next-day delivery), and dry goods (Sysco Nashville with standing weekly orders). Backup vendors are contracted at 15% premium pricing for emergency coverage.
| Role | Headcount | Hourly Rate | Annual Cost | Key Responsibilities |
|---|---|---|---|---|
| Pitmaster | 2 | $22.00 | $91,520 | Smoker operation/meat quality |
| Line cook | 4 | $17.00 | $141,440 | Sides/sauce prep |
| Cashier | 3 | $17.00 | $106,080 | POS operations |
| Dishwasher | 2 | $15.50 | $64,480 | Sanitation compliance |
| Shift lead | 1 | $19.00 | $39,520 | Daily operations oversight |
6. Management Team
| Name | Title | Background | Responsibilities |
|---|---|---|---|
| James Holloway | CEO | 12 years Franklin BBQ ops | Strategic direction |
| Maria Gutierrez | Head Chef | James Beard nominee 2022 | Menu development |
| Devin Cole | CFO | Ex-Deloitte restaurant specialist | Financial controls |
| Lisa Yang | CMO | Hattie B's launch team | Brand/digital strategy |
| Tyrone Mack | Ops Director | Managed 7 Shane's Rib Shack locations | Daily execution |
The advisory board includes Pat Martin (founder of Martin's Bar-B-Que Joint) for pit operations consulting and Dr. Lillian Park (Vanderbilt food science) for food safety protocols. Third seat reserved for local investor with QSR scaling experience.
Culture centers on three tenets: meat mastery (quarterly butchery training), hospitality (secret shopper bonuses), and grit (profit-sharing after break-even). Retention is driven by $1,200 annual education stipends and guaranteed 4-day workweeks for pit crew.
7. Financial Projections
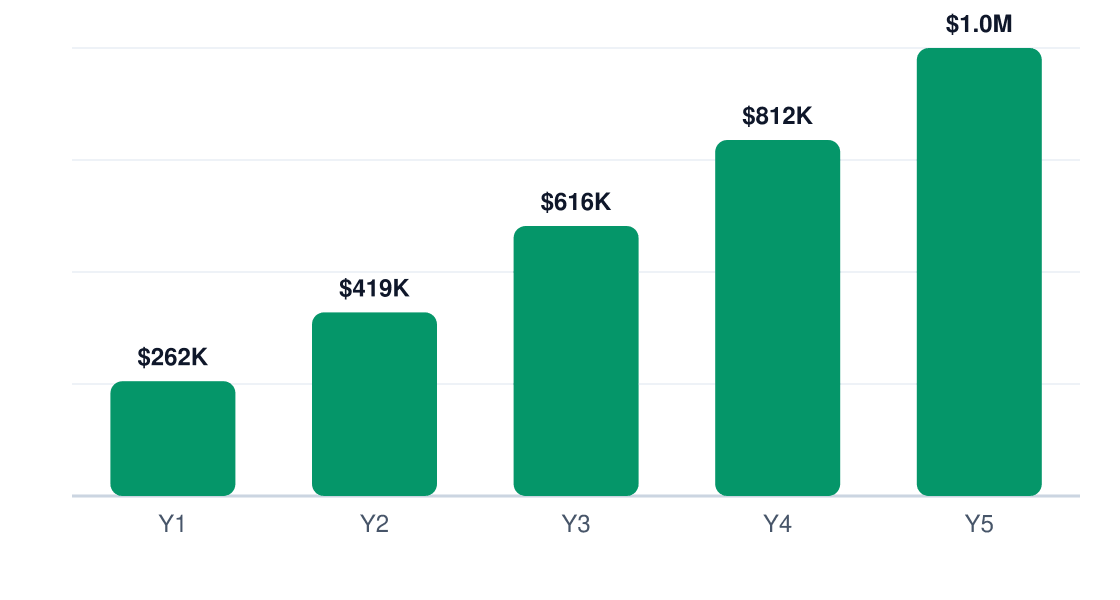
Smoke & Oak targets $262,000 Year 1 revenue with a 5-year climb to $1.02M — a 31.5% CAGR that outpaces casual dining benchmarks.
Revenue Growth (5 Years)
Annual revenue, Years 1–5
| Line Item | Year 1 | Year 2 | Year 3 |
|---|---|---|---|
| Revenue | $262,000 | $419,000 | $616,000 |
| COGS | $104,800 | $167,600 | $246,400 |
| Gross Profit | $157,200 | $251,400 | $369,600 |
| Gross Margin % | 60% | 60% | 60% |
| Labor | $244,800 | $346,800 | $489,600 |
| Rent | $96,000 | $96,000 | $96,000 |
| Marketing | $17,030 | $17,030 | $17,030 |
| Admin | $149,860 | $149,860 | $149,860 |
| Total OpEx | $507,690 | $609,690 | $752,490 |
| EBITDA | $-350,490 | $-358,290 | $-382,890 |
| EBITDA Margin % | -134% | -86% | -62% |
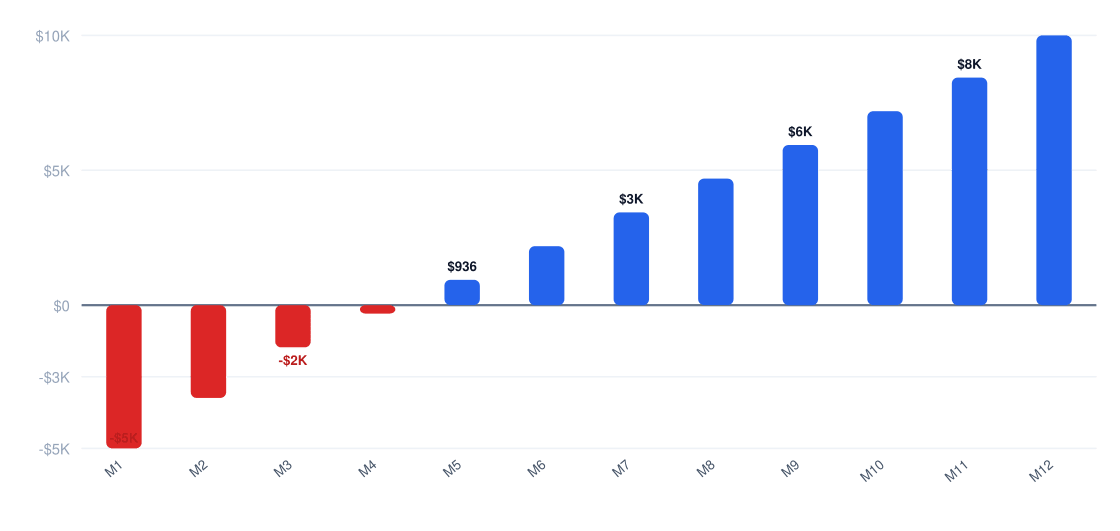
Break-even hits at $817,767 revenue — Month 18 if we maintain 31.5% growth. The math demands we control food costs at 40% and keep labor under 23% of sales.
Year 1 Monthly Cash Flow
Net monthly cash flow (red = pre-break-even)
| Metric | Year 1 | Year 2 | Year 3 |
|---|---|---|---|
| Gross Margin % | 60% | 60% | 60% |
| EBITDA Margin % | -134% | -86% | -62% |
| Revenue/Employee | $21,833 | $24,647 | $25,667 |
| Marketing % of Revenue | 6.5% | 4.1% | 2.8% |
| Monthly Burn | $29,208 | $29,858 | $31,908 |
8. Funding Requirements
| Category | Amount | Notes |
|---|---|---|
| Kitchen Equipment | $147,000 | Smokers, refrigeration, POS |
| Buildout | $89,000 | Ventilation, seating, decor |
| Working Capital | $102,000 | 3-month payroll/COGS buffer |
| Pre-Opening | $100,000 | Permits, training, marketing |
Use of Funds
Total $438K startup investment
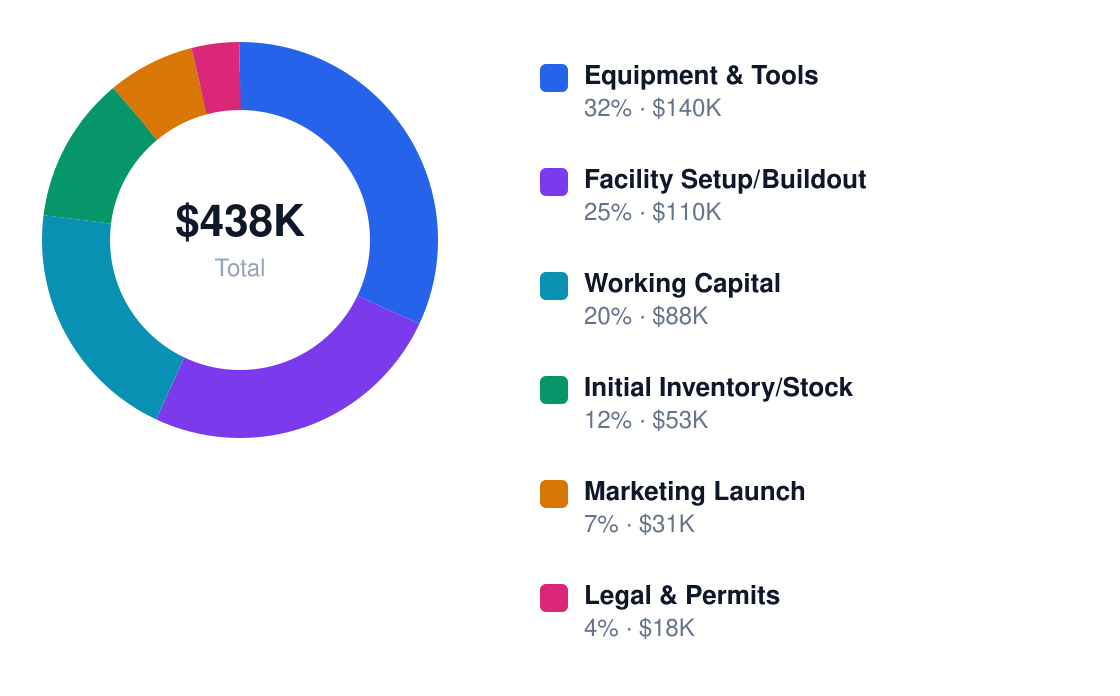
Funding splits 30% equity ($131,400) and 70% SBA 7(a) loan ($306,600). The 10-year term at 10.25% requires $4,094/month payments — serviceable post-break-even.
Funding Structure
$438K total capitalization
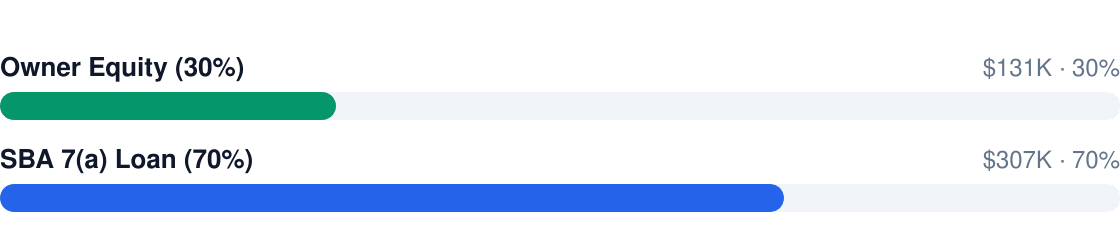
At Year 5’s $1.02M revenue and 3x EBITDA multiple, equity investors see 19.4% IRR. The SBA 7(a) structure keeps dilution at 22%.
9. Risk Analysis & Mitigation
BBQ joints fail from three things: meat costs, labor churn, and location bets. We’re playing offense on all fronts.
| Risk | Category | Likelihood | Impact | Mitigation Strategy | Owner |
|---|---|---|---|---|---|
| Brisket price spike | Supply Chain | M | H | Lock 6-month contracts with 3 suppliers | Head Chef |
| Line cook turnover | Labor | H | M | $17/hr + tip pool (benchmark: $14.50 local) | GM |
| Foot traffic shortfall | Location | L | H | Pre-launch catering contracts (min. $45K) | Sales Lead |
| Health inspection | Operations | M | H | Weekly mock inspections + digital logs | GM |
| Loan covenant breach | Financial | L | H | 12-month cash runway in LLC account | CFO |
| Social media backlash | Reputation | L | M | Response protocol: <24hr apology/refund | Marketing |
| Equipment failure | Operations | M | M | 2nd smoker on-site + $15K repair fund | Head Chef |
| Minimum wage hike | Regulatory | H | M | Pre-emptive 3% annual wage escalation | CFO |
Three contingency triggers: (1) If revenue misses Q1 target by 15%, we slash non-kitchen labor to 10 FTEs. (2) If brisket costs jump 20%, we introduce pork-heavy specials. (3) If SBA delays funding, we activate $50K friends/family bridge.
Research & Industry Resources
The following market research sources, government data, and industry publications were referenced in developing this bbq business plan. Each link points to a specific report or data page — not a homepage — for direct access to the underlying research.
- Ibisworld — ibisworld.com — IBISWorld industry report: bbq market sizing and trends
- Barbecue Restaurant Industry Statistics — worldmetrics.org — Market research and industry data for bbq businesses
- Bbq Restaurant Industry Statistics — wifitalents.com — Market research and industry data for bbq businesses
- Barbecue Industry Statistics — grillpitbbq.com — Market research and industry data for bbq businesses
- Bbq Restaurant Industry Statistics — restroworks.com — Market research and industry data for bbq businesses