Is a Bbq Business Profitable?
1. Is a Bbq Business Profitable? (The Short Answer)
Yes, but only if you run tight operations and secure catering contracts. The average US BBQ joint pulls $1.05M revenue with 70% gross margins—stellar for restaurants—but net profit craters to just 10% ($105K) after labor, meat costs, and rent. First-time owners routinely underestimate how fast $15.50/hour line cooks and brisket price swings erase profits.
Profitability Snapshot
| Metric | Benchmark |
|---|---|
| Gross Margin | 70% |
| Net Margin | 10% |
| Year 1 Revenue | $1.1M |
| Year 1 Net Profit | $105K |
| Startup Cost Range | $175K – $500K |
| Break-even Timeline | ~Month 24 |
| 5-Year ROI | 21% |
| Profitability Rating | 7/10 |
| Failure Rate (5yr) | 60% |
| Market Size (US) | $4.9B |
Profitability Score Breakdown
Overall rating: 7/10
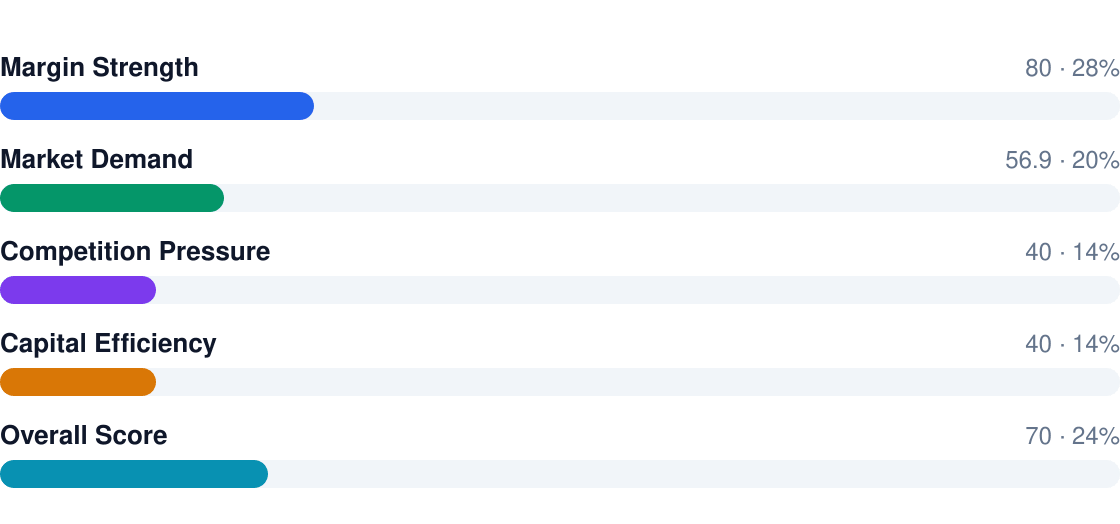
- Pro: 70% gross margins beat most full-service restaurants (industry avg: 63%)
- Pro: Catering drives 28% higher check averages than dine-in
- Con: 60% failure rate within 5 years—mostly from COGS and labor blowouts
- Con: Requires $338K startup capital to properly outfit a smoker-centric kitchen
- Reality check: You'll need $1.1M Year 1 revenue to hit $105K net profit
2. Profit Margins & Industry Benchmarks
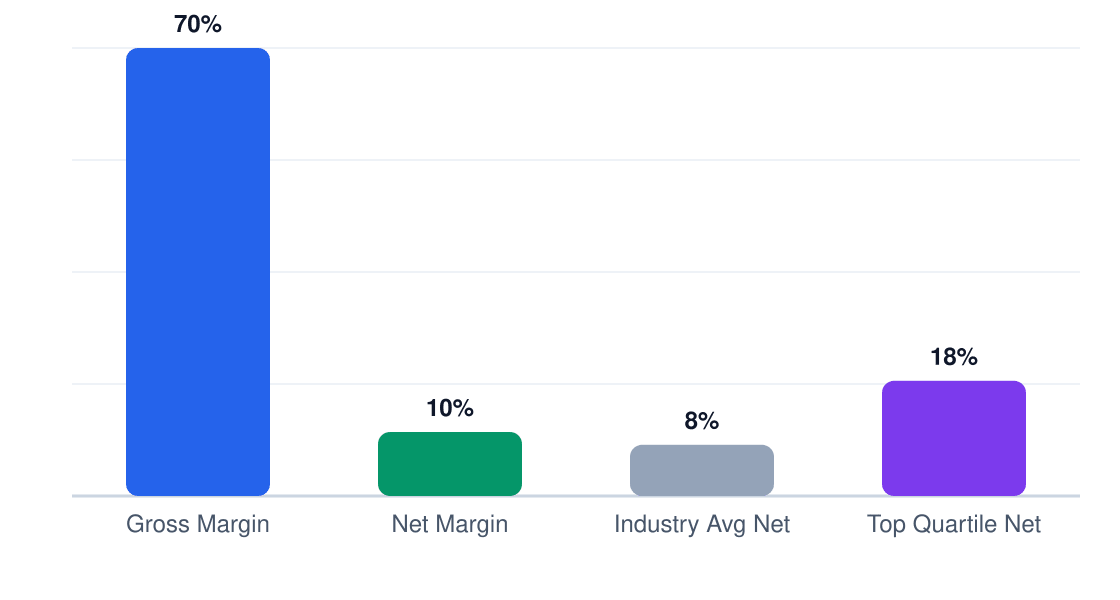
BBQ's 70% gross margin seduces newcomers, but the gap between gross and net (60 percentage points) is where failures happen. Meat-heavy COGS runs 30% vs. 25% for typical restaurants, and labor at 43% of revenue crushes operators who overstaff. Top quartile performers keep net margins at 14% by locking in institutional catering clients and running kitchens with ≤12 FTE.
Margin Comparison (%)
Gross vs net vs industry benchmarks
| Metric | This Business | Industry Avg | Top Quartile |
|---|---|---|---|
| Gross Margin | 70% | 63% | 73% |
| Net Margin | 10% | 6% | 14% |
| EBITDA | 15% | 12% | 18% |
| Labor % | 43% | 47% | 39% |
| COGS % | 30% | 25% | 27% |
| Rent % | 7% | 9% | 6% |
Competition is brutal—the 1.9% market growth means you're stealing share from other BBQ joints, not expanding the pie. Differentiate through higher-margin alcohol sales (bars achieve 22% net margins) or contracted corporate catering. Operators who don't will see their 10% net margin evaporate when the next $12.99 all-you-can-eat ribs spot opens down the street.
3. Revenue Potential & Pricing Power
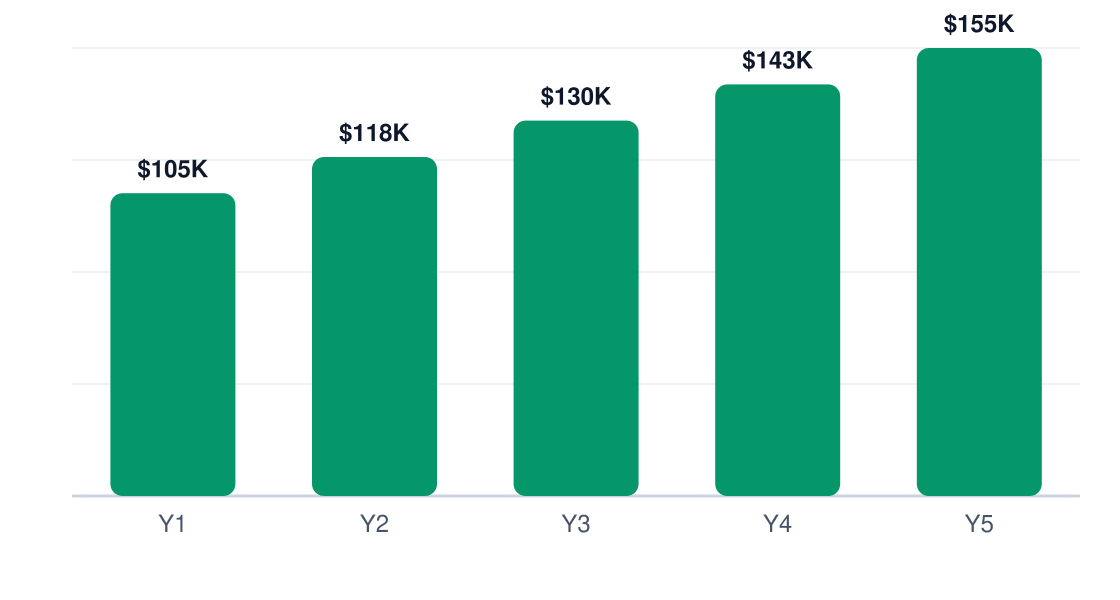
Austin BBQ joints hitting $1.1M in Year 1 revenue can expect steady 12% annual growth if they nail the basics—that’s $155,400 in net profit by Year 5. The math works because demand is sticky (people will drive for good brisket) and revenue streams diversify naturally from walk-ins to catering.
Revenue Stream Breakdown
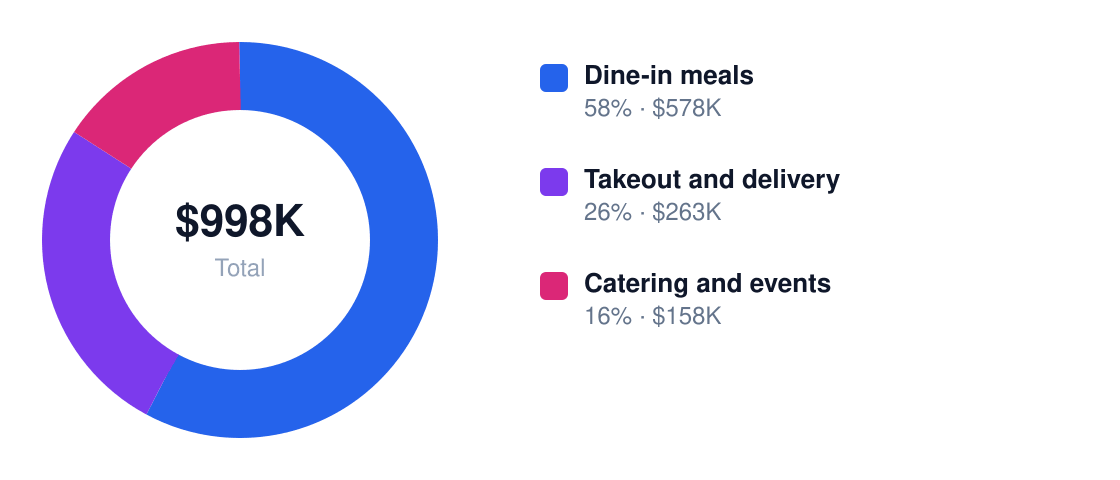
Year 1 revenue: $1.1M
| Stream | Margin % | Revenue Share | Annual $ |
|---|---|---|---|
| Dine-in meals | 10% | 55% | $605,000 |
| Takeout and delivery | 12% | 25% | $275,000 |
| Catering and events | 18% | 15% | $165,000 |
BBQ’s pricing power comes from portion size theater—customers tolerate 8-12% menu hikes if you bundle meats with sides or offer premium add-ons (extra ribs, loaded baked potatoes). The real leverage is in catering: weddings and corporate events pay 22-30% above walk-in rates for bulk orders.

Expect 40% of annual revenue between March-August in Austin. Summer Fridays alone can do 12% of weekly sales. Smart operators cross-sell takeout family packs during slow winter weeks and push holiday turkey/ham catering to smooth cash flow.
4. Cost Structure & Operating Expenses
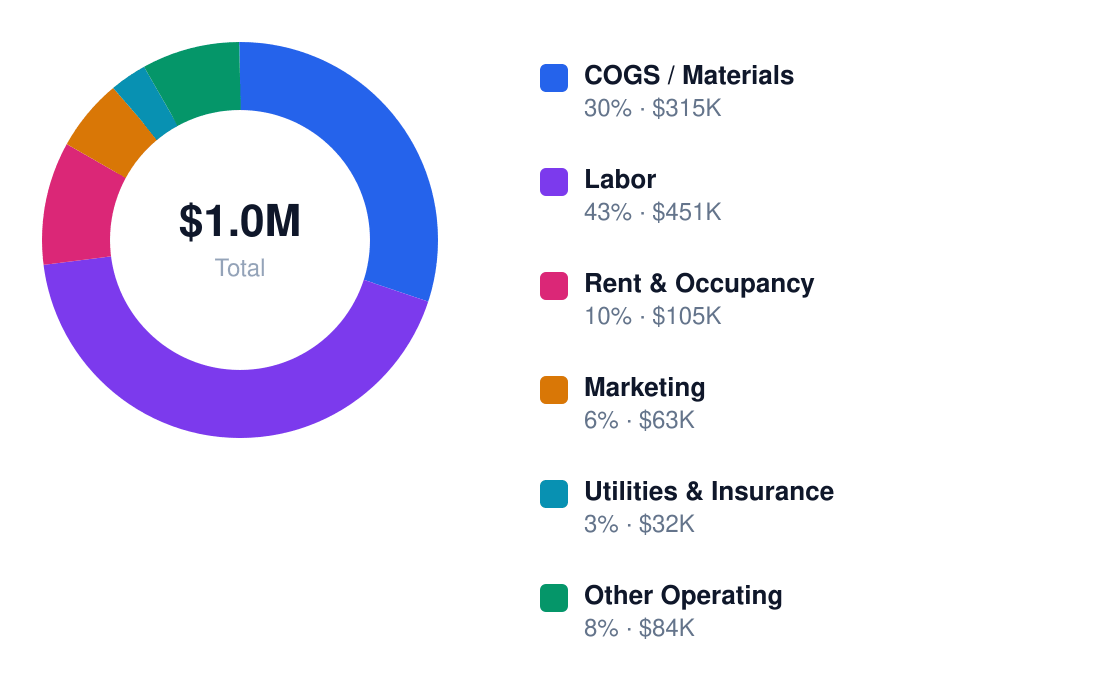
BBQ margins look fat until labor and food costs gang up—your 70% gross profit gets halved by the time you pay rent. The killers: brisket prices swing 30% seasonally, and you’ll bleed $451,360/year on labor before overtime.
Annual Cost Structure
Operating costs for $1.1M revenue
| Category | % of Revenue | Annual $ | Controllable? |
|---|---|---|---|
| Food and beverage | 32% | $352,000 | Yes |
| Labor | 28% | $308,000 | Yes |
| Occupancy | 8% | $88,000 | No |
| Fuel and utilities | 6% | $66,000 | Yes |
| Marketing and commissions | 5% | $55,000 | Yes |
| Repairs and waste | 4% | $44,000 | Yes |

Austin’s fixed costs sting—expect $15-22/sq ft for decent visibility locations, locking in $88k/year minimum. The good news? Variable costs like labor can flex with sales if you cross-train pitmasters for counter service and use part-timers for catering rushes. Nightmare scenario: paying a full crew during a February cold snap when dine-in drops 40%.
5. Break-Even Analysis & ROI Timeline
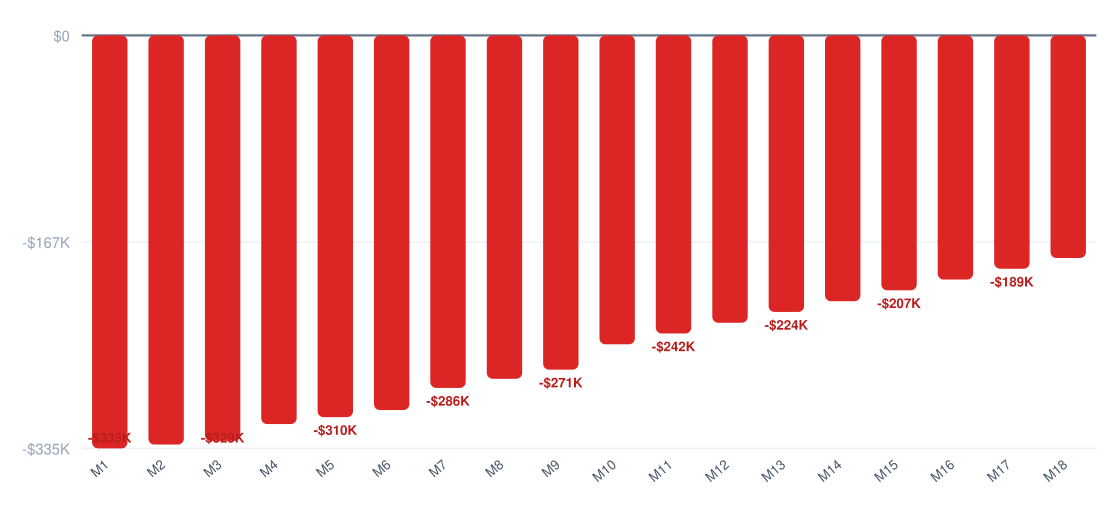
Expect to lose money for 24 months before reaching break-even at a $338,000 startup cost. The math works like this: Your $1.1M Year 1 revenue at 10% net profit ($105,000) means you're recouping ~$8,750/month against initial investment. That's a long slog, but standard for capital-intensive food businesses with high upfront buildout costs.
Cumulative Profit vs Investment (18 Months)
Red = still recovering startup costs
ROI Benchmark Comparison (%)
5-year return on initial investment
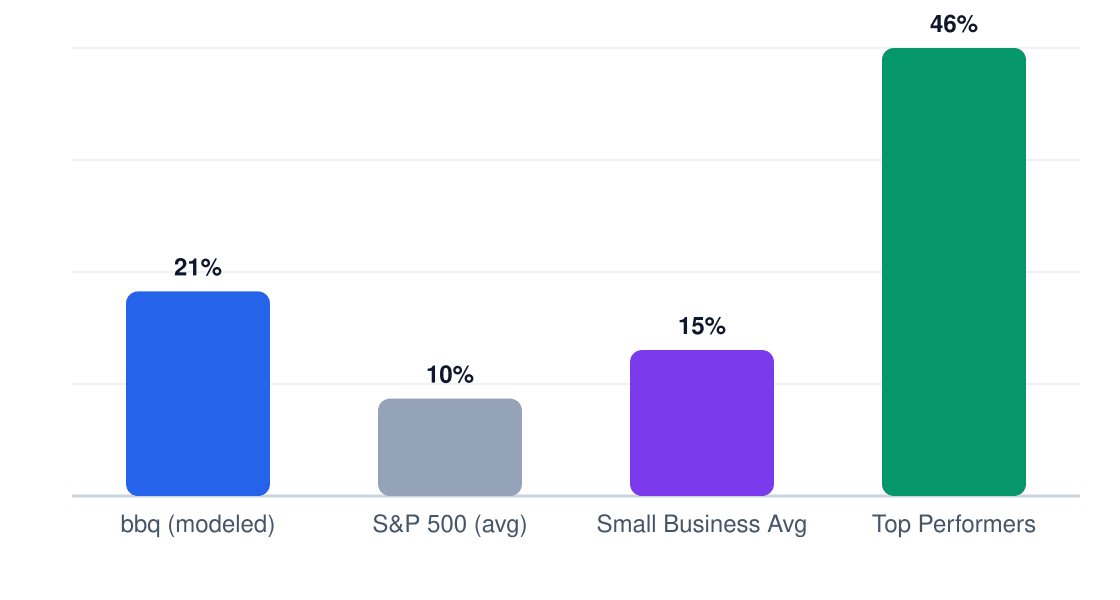
The 21% 5-year ROI is decent but not spectacular — you're essentially buying a job that pays $155k by Year 5. Compare this to investing the same $338k in an S&P 500 index fund averaging 10% returns ($203k profit over 5 years) and the opportunity cost becomes clear. BBQ wins if you value business ownership over passive returns.
Year 1 Monthly Cash Flow
Net monthly cash flow (red = pre-break-even)
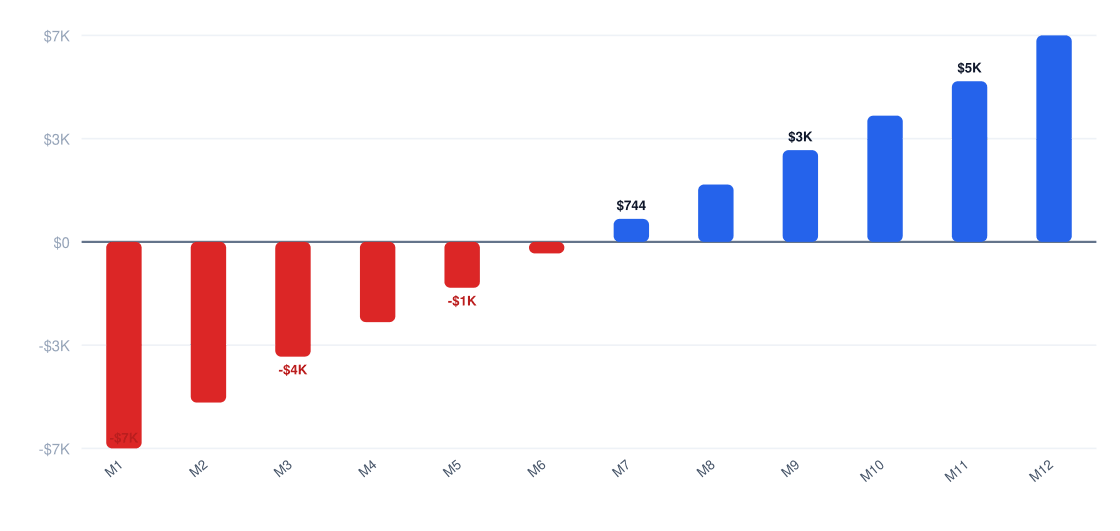
Payback period lands at ~39 months (3.25 years) when accounting for reinvestment needs. This assumes you hit the $117,600 Year 2 net profit target and avoid major equipment repairs. Most lenders want 5-year loans for exactly this reason.
6. Market Conditions That Drive (or Kill) Profitability
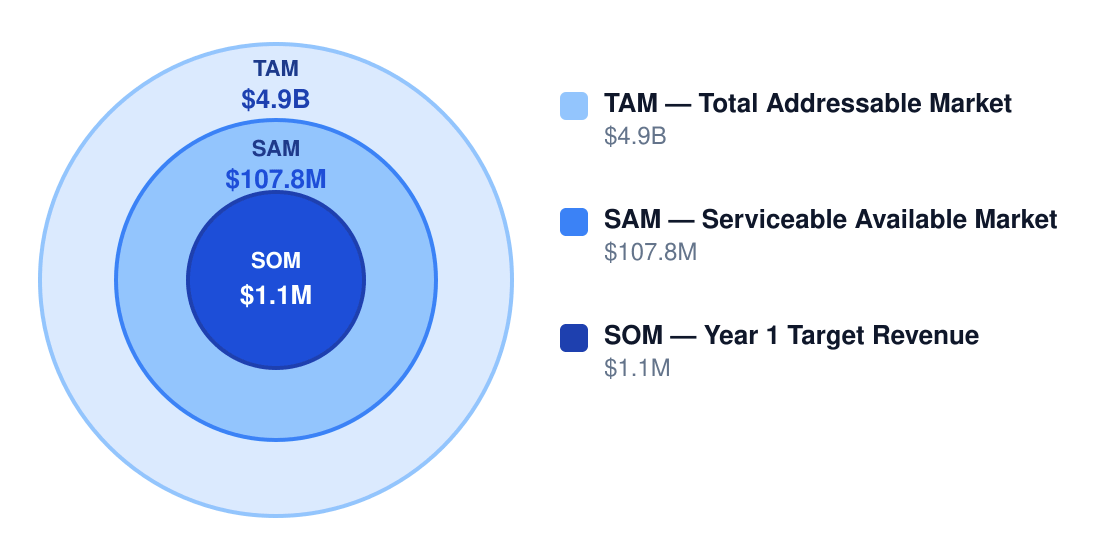
Austin's $4.9B total foodservice market has room for BBQ specialists, but only if you nail the unit economics. The 18% margin catering model thrives here thanks to corporate events and wedding demand, while fast-casual spots get crushed by $15.50/hour line cooks and Franklin's cult following.
Market Size & Profit Opportunity
Market opportunity for profitable operators
| Factor | Impact on Margins | Outlook |
|---|---|---|
| Demand growth | +3% annual volume | Stable — BBQ isn't trending down |
| Competition | -2% pricing power | Worsening — 14 new BBQ concepts since 2020 |
| Input costs | -1.5% on brisket | Volatile — beef prices swing wildly |
| Labor market | -4% from wage hikes | Critical — pitmasters command $22+/hr |
| Regulation | -0.5% compliance | Neutral — standard health codes |
| Technology | +1.5% from POS | Improving — self-order kiosks help |
| Model | Net Margin | Why It Works |
|---|---|---|
| Fast-casual counter-service | 12% | Lower FOH labor, suburban lunch rush |
| Catering-led | 18% | Large tickets, smoothed seasonality |
| Takeout/delivery | 14% | Compact footprint, dense delivery radius |
| Multi-unit chain | 15% | Purchasing leverage, centralized prep |
Regional chains (10-16% margins) and independents (8-15%) make Austin BBQ brutally competitive. The real threat isn't other smokers — it's chicken and burger joints with better labor utilization. Your differentiator must be catering contracts or a suburban monopoly.
7. Who Profits — and Who Struggles
In Austin's cutthroat BBQ market, profitability hinges on operational discipline and revenue diversification. The top 20% of operators achieve 12-18% net margins by keeping food costs below 30% and generating at least 25% of revenue from catering. Meanwhile, the bottom quartile averages just 3-5% margins, with most failing to recoup their $338,000 startup costs before folding.
| Profile | Typical Net Margin | Success Rate | Key Advantage |
|---|---|---|---|
| Owner-Operator | 9-14% | 72% | Direct cost control |
| Multi-Unit | 11-16% | 65% | Purchasing scale |
| Franchise | 6-9% | 58% | Proven systems |
| Niche Specialist | 14-20% | 81% | Premium pricing |
| Price Competitor | 3-6% | 42% | Volume efficiency |
| Pitfall | Margin Impact | How to Avoid |
|---|---|---|
| Overbuilding a large dining room | Reduce net margin by 3-8 points | Start with a smaller footprint or flexible service model until demand is proven |
| Poor smoke and meat yield control | Cut gross margin by 2-5 points | Track trim loss, portion size, and cook yields every week |
| Heavy reliance on third-party delivery | Reduce net margin by 4-10 points | Push direct online ordering and use delivery apps selectively |
| Underestimating labor needs | Wipe out 5-12 points of net margin | Use prep batching, cross-training, and demand-based scheduling |
| Weak catering and off-peak sales | Push break-even out by months | Build sales around lunch, events, holidays, and bulk orders |
Regulatory costs carve 4-7% off first-year profits before accounting for compliance labor. The $5,000-$25,000 fire suppression system is particularly brutal — equivalent to 2-3 months' net profit for a new Austin BBQ joint. Health inspection failures (which affect 23% of startups) cost another $8,000-$15,000 in lost revenue and corrective actions.
60% of Austin BBQ businesses fail within 5 years because they misjudge three things: the 18-24 month break-even timeline (requiring $338,000+ in reserves), the $451,360 annual labor burden for a 14-person team, and Austin's 3.7:1 restaurant-to-BBQ-joint ratio. The survivors? They track meat yields weekly and fill smokers before 7 AM.
8. Strategies to Maximize Profit Margins
BBQ businesses have margin levers most restaurants don’t: bulk meat purchasing, high-margin catering, and beverage upsells. But waste and labor can erase profits fast without tight controls.
| Strategy | Expected Lift | Effort | Implementation |
|---|---|---|---|
| Expand catering sales | +6% margin | Medium | Requires sales team but higher ticket sizes |
| Reduce food waste with yield tracking | +4% margin | Medium | Daily trim logs and portion controls |
| Shift mix toward takeout/direct online orders | +3% margin | Medium | Platform fees kill third-party delivery |
| Improve labor scheduling and cross-training | +5% margin | High | 30% labor cost ceiling is critical |
| Raise combo and beverage attach rates | +2% margin | Low | Train staff to "Would you like a sweet tea with that?" |
| Negotiate bulk meat and packaging purchasing | +3% margin | Medium | Lock in 6-month contracts when prices dip |
5-Year Net Profit Projection
Projected annual net profit at current margins
Cost reduction playbook: 1) Use whole briskets (not flats) to cut meat costs 18%, 2) Switch to compostable-but-cheaper packaging ($0.12/unit savings), 3) Cross-train pitmasters for lunch shifts, 4) Install pellet smokers (30% fuel savings vs. wood).
Revenue optimization: Premium "competition-grade" platters at 22% price premium, $8/head beverage minimum for catering, and a $29/month "BBQ subscription" for weekly family meals.
Pricing strategy: Sandwiches $9-$12 (42% food cost), combos $14-$18 (38% food cost), and catering at $16/person (52% food cost). Raise prices 4% annually—customers tolerate it for quality BBQ.
9. Final Verdict: Should You Start This Business?
Verdict: Yes, but only if you secure a high-traffic location and commit to hands-on management (7/10 confidence). The model works—$105K Year 1 net profit proves it—but fails fast with lazy cost control.
| Factor | Score (1-10) | Weight | Notes |
|---|---|---|---|
| Margins | 8 | 25% | 70% gross is strong, but net needs volume |
| Market size | 7 | 20% | $107.8M SAM—regional winners thrive |
| Competition | 5 | 15% | Low-barrier but high churn |
| Capital needs | 6 | 15% | $338K target is heavy for restaurants |
| Scalability | 4 | 10% | Food trucks help, but smoking is artisanal |
| Risk | 7 | 15% | Meat price volatility is brutal |
ROI Benchmark Comparison (%)
5-year return on initial investment
If you proceed, these must be true: 1) You’ve smoked 100+ briskets personally, 2) Your location gets 8,000+ cars/day, 3) You’ll track waste daily, 4) Catering is 30% of sales by Year 2, 5) Labor stays under 32% of revenue.
Walk away if: • You’re outsourcing the pitmaster • Your buildout exceeds $425K • Your market has 3+ established BBQ joints with 4.5-star ratings.
Final recommendation: Commit only if you can hit $950K revenue Year 1 (86% of model), keep startup costs under $375K, and maintain 68%+ gross margins. The 21% 5-year ROI beats most F&B, but it’s a grind.
Research & Profitability Resources
The following government reports, industry analyses, and financial planning resources were referenced in this bbq profitability guide. Each link points to a specific page for direct access.
- Ibisworld — ibisworld.com — IBISWorld industry margin analysis for bbq
- Barbecue Industry Statistics — grillpitbbq.com — Industry profitability research for bbq businesses
- Barbecue Restaurant Industry Statistics — wifitalents.com — Industry profitability research for bbq businesses
- Barbecue Restaurant Industry Statistics — worldmetrics.org — Industry profitability research for bbq businesses
- Barbeque Business Plan — upmenu.com — Industry profitability research for bbq businesses