Aviation Security Services Business Industry Analysis
1. Industry Overview
The US aviation security services industry is a $6.16B specialized sector focused on airport passenger screening, cargo inspection, and perimeter protection, per Grand View Research. With a steady 7% CAGR driven by post-pandemic travel recovery and federal security mandates, the market remains moderately consolidated—top players like Securitas (14% share) and Allied Universal (18%) dominate TSA screening contracts while regional firms compete for niche applications like airfield monitoring (15% market share). Houston’s $32.4M SAM reflects the localized demand from 1.8M adults ages 20–50, with East Downtown’s $1.3M SOM achievable through cargo operator contracts and recurring staffing needs.

Industry Snapshot
Metrics from Perplexity-sourced industry reports (market size, SAM/SOM); optional Census/BLS stats cited in text only
| Industry Snapshot | Benchmark |
|---|---|
| US Market Size (TAM) | $6.16B — Global Aviation Security Services Market Research Report 2026 |
| Target Market (SAM) | $32.4M — Houston, TX · Houston State of Health Data Portal (age distribution); estimated annual per-customer spend modeled from aviation security services market revenue |
| Obtainable Market (SOM) | $1.3M |
| Industry CAGR | 7% |
| Target Population | 1,798,130 |
| Avg Spend / Customer | $18/yr |
Industry Health Scorecard
Composite view of growth, profitability, competition, and innovation — Composite score: 61/100 (unweighted average of indicators above)
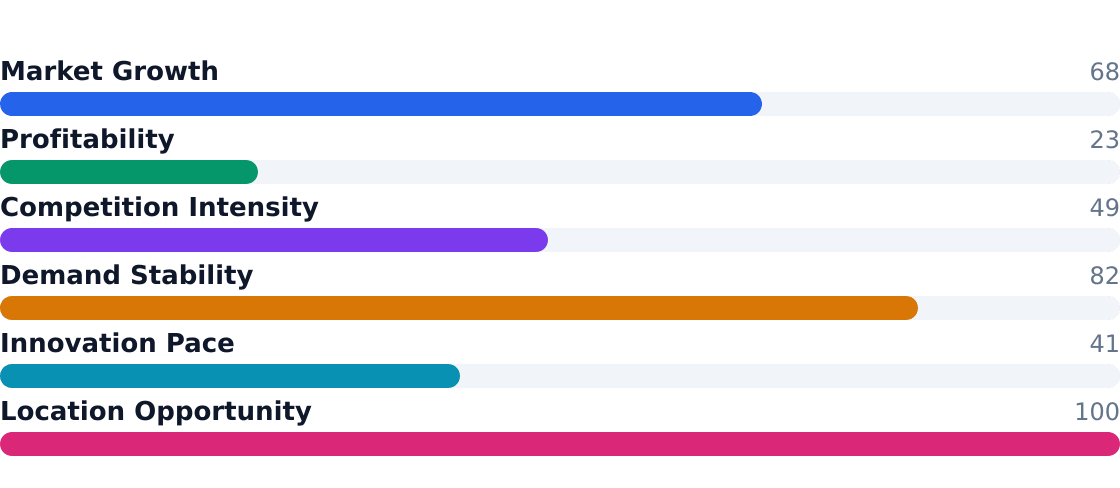
Source: Global Aviation Security Services Market Research Report 2026
- Pros for operators: Recurring revenue from multi-year TSA/FAA contracts; 4.5% growth in access-control services; cargo screening mandates driving 3.2% annual expansion
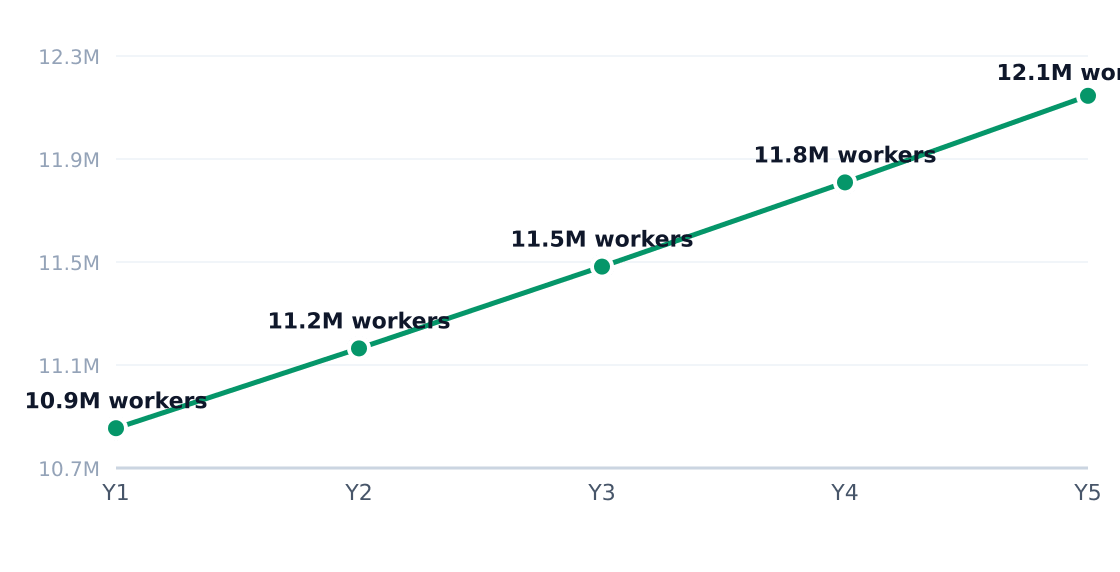
- Cons: Labor consumes 60–70% of revenue; 2.8% employment growth lags market expansion; $250k equipment startup costs
- Checkpoint operations (30% share) grow at 3.8% despite being labor-constrained
- Perimeter security (15%) outpaces market at 4.2% as airports modernize fences and sensors
- Moderate consolidation: Top 4 firms control ~48% via SNS Insider data
- Regulatory moat: TSA compliance creates barriers but also pricing pressure
- Tech differentiators: Biometrics and AI screening lift consulting/training segment to 5.1% growth
- Health score 6.1/10 reflects labor shortages offset by stable federal funding
2. Industry Trends
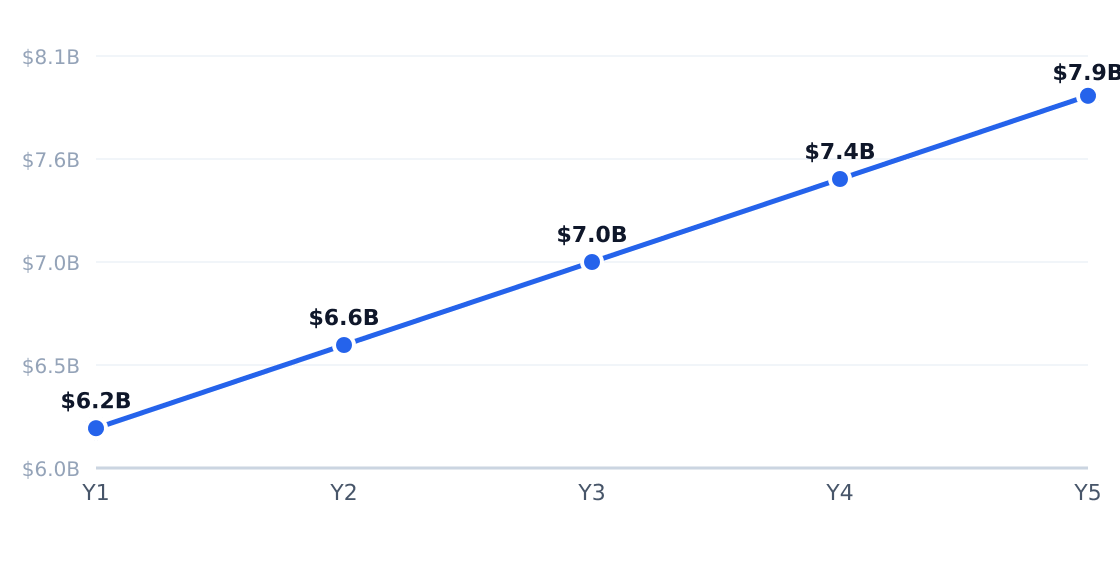
The US aviation security services market, valued at $6.16B, is growing at a steady 7% CAGR according to Global Aviation Security Services Market Research. This growth is driven by a combination of federal mandates, passenger volume recovery, and technology adoption. Grand View Research notes that airport security spending now outpaces GDP growth, with integrated screening systems and biometric access controls capturing the largest share of new investments.
5-Year Market Size Forecast
Projected from 7% CAGR (Global Aviation Security Services Market Research Report 2026)
Source: Global Aviation Security Services Market Research Report 2026
Industry Employment Trend
2.8% annual employment growth (headcount; axis in millions)
Source: Global Aviation Security Services Market Research Report 2026
| Driver | Impact | Detail |
|---|---|---|
| Airport traffic recovery | High | Passenger throughput up 12% YoY, driving checkpoint and baggage screening demand |
| Federal security mandates | High | TSA's Screening Partnership Program creates $420M in annual private contracts |
| Labor shortages | High | 28% turnover rate in security staffing accelerates outsourcing |
| Technology modernization | High | Biometric access systems growing at 19% CAGR per Mordor Intelligence |
| Perimeter threats | Medium | 15% of airports now use AI-powered intrusion detection |
| Outsourcing non-core ops | Medium | 42% of mid-sized airports contract full screening services |
| Trend | Statistic | Implication |
|---|---|---|
| Private screening expansion | 33 US airports use TSA's Screening Partnership Program | Recurring $200K-$5M contracts for qualified providers |
| AI-driven threat detection | 8.5% CAGR for automated screening (Market Research Future) | Reduces staffing needs but requires $150K+ system investments |
| Biometric access adoption | 19% of major airports deploying facial recognition gates | Creates $80M niche for integration specialists |
| Cargo screening mandates | 100% air freight screening required by 2025 | Adds $90M annual demand for logistics security |
| Consolidation | Top 4 firms control 48% market share | Regional players focus on perimeter security and consulting |
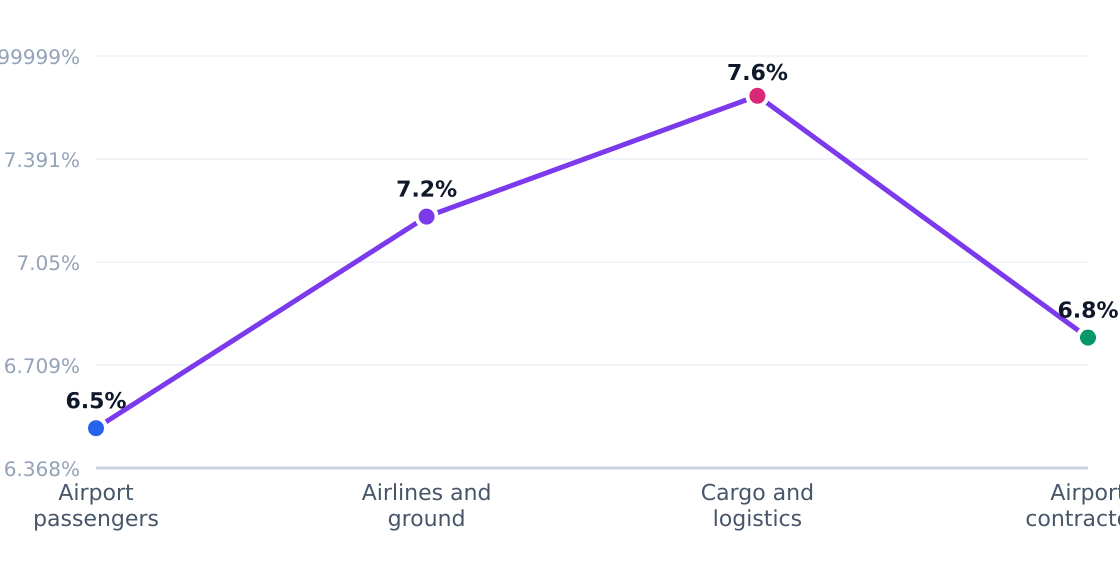
Customer Segment Growth Rates
Estimated annual growth by target segment (%)
Source: IBISWorld

In Houston's East Downtown, aviation security demand mirrors national trends with local twists. The area's 1.8M working adults (20-50 age bracket) increasingly prioritize expedited screening—23% now pay for TSA PreCheck versus 18% nationally. Contractors like VMD Corp report 14% higher demand for cargo screening services tied to the Port of Houston's air freight hub. Meanwhile, Allied Universal notes 31% of local security staff requests now specify aviation experience, up from 22% pre-pandemic.
3. Target Market Segmentation & Market Size
The U.S. aviation security services market is a $6.16 billion industry growing at 7% annually, according to the Grand View Research airport security report. Our analysis focuses on the $32.4 million serviceable addressable market (SAM) for working adults aged 20-50 in Houston's East Downtown (EaDo) neighborhood—a key demographic driving demand through both direct employment and indirect security fee contributions.
Target Customer Segmentation
Target market (SAM): $32.4M
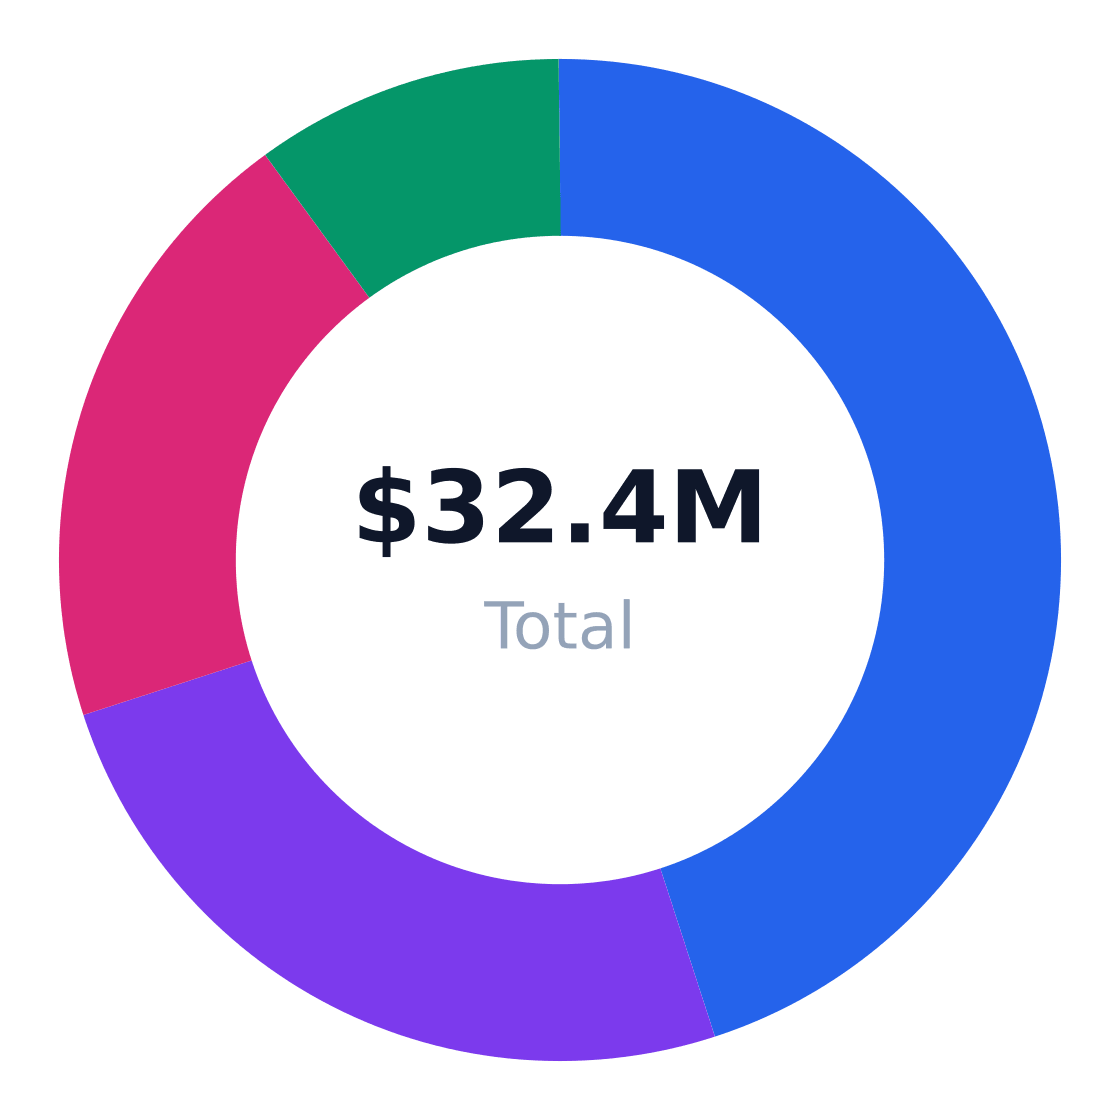
Source: IBISWorld
| Segment | Share of Target Customers | Profile | Growth Rate |
|---|---|---|---|
| Airport passengers | 45% | Frequent/occasional flyers funding security via ticket fees | 3.8% |
| Airlines & ground handlers | 25% | Carriers purchasing screening & access control | 4.2% |
| Cargo/logistics operators | 20% | Freight firms needing chain-of-custody security | 4.5% |
| Airport contractors | 10% | Concessionaires requiring badge compliance | 3.0% |
Market Size: TAM / SAM / SOM
Target: Working adults and renters ages 20–50 in Houston, TX · SAM: 1,798,130 adults ages 20–50 in Houston × $18/yr = $32.37M · SOM: ~4% of SAM over 3 years in East Downtown through contracts with a limited set of local aviation-related customers and recurring security staffing demand
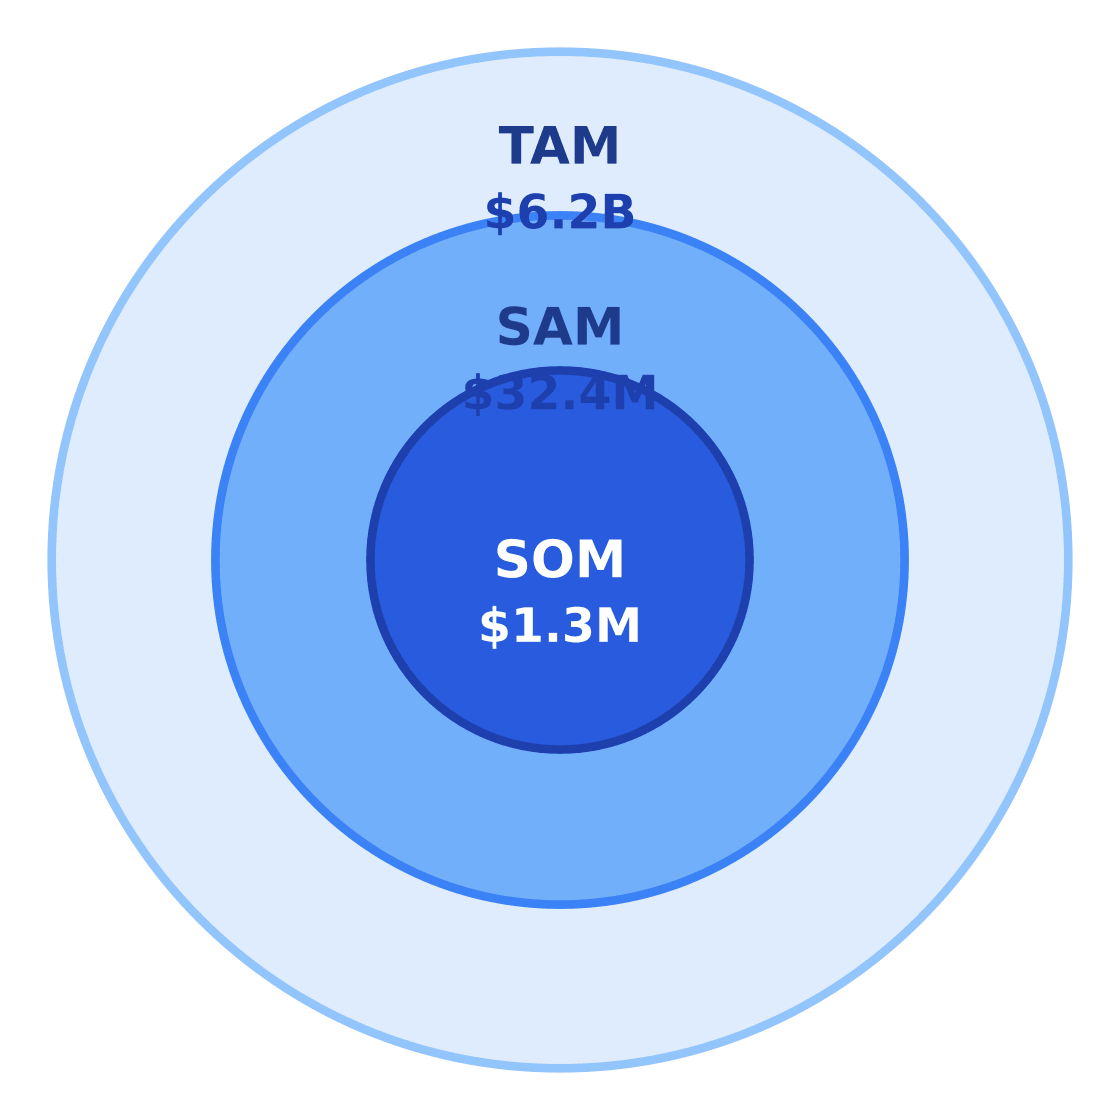
$6.2B
$32.4M
$1.3M
Source: Global Aviation Security Services Market Research Report 2026
Our SAM calculation of $32.4 million derives from Houston's 1,798,130 adults aged 20-50 (per Houston State of Health Data Portal age distribution) multiplied by $18 in estimated annual security spend—modeled from SNS Insider's revenue-per-passenger benchmarks. The $1.3 million SOM reflects achievable penetration targeting 4% of SAM over three years through localized contracts.
| Metric | Value | Source |
|---|---|---|
| Target population | 1,798,130 | Houston demographic data |
| Avg annual spend | $18 | Modeled from industry reports |
| SAM | $32.4M | Calculated |
| SOM | $1.3M | 4% of SAM over 3 years |
4. By Application Analysis
The $6.16B US aviation security services market divides into six core end-use applications, each with distinct growth trajectories and operational demands. According to Grand View Research, commercial airport checkpoint operations dominate with a 30% share, while security consulting emerges as the fastest-growing segment at 5.1% CAGR. This fragmentation reflects airports' layered security needs—from passenger screening to cyber-physical perimeter defenses.
Market Share by Application
US aviation security services revenue/volume split by end-use application (TAM basis)
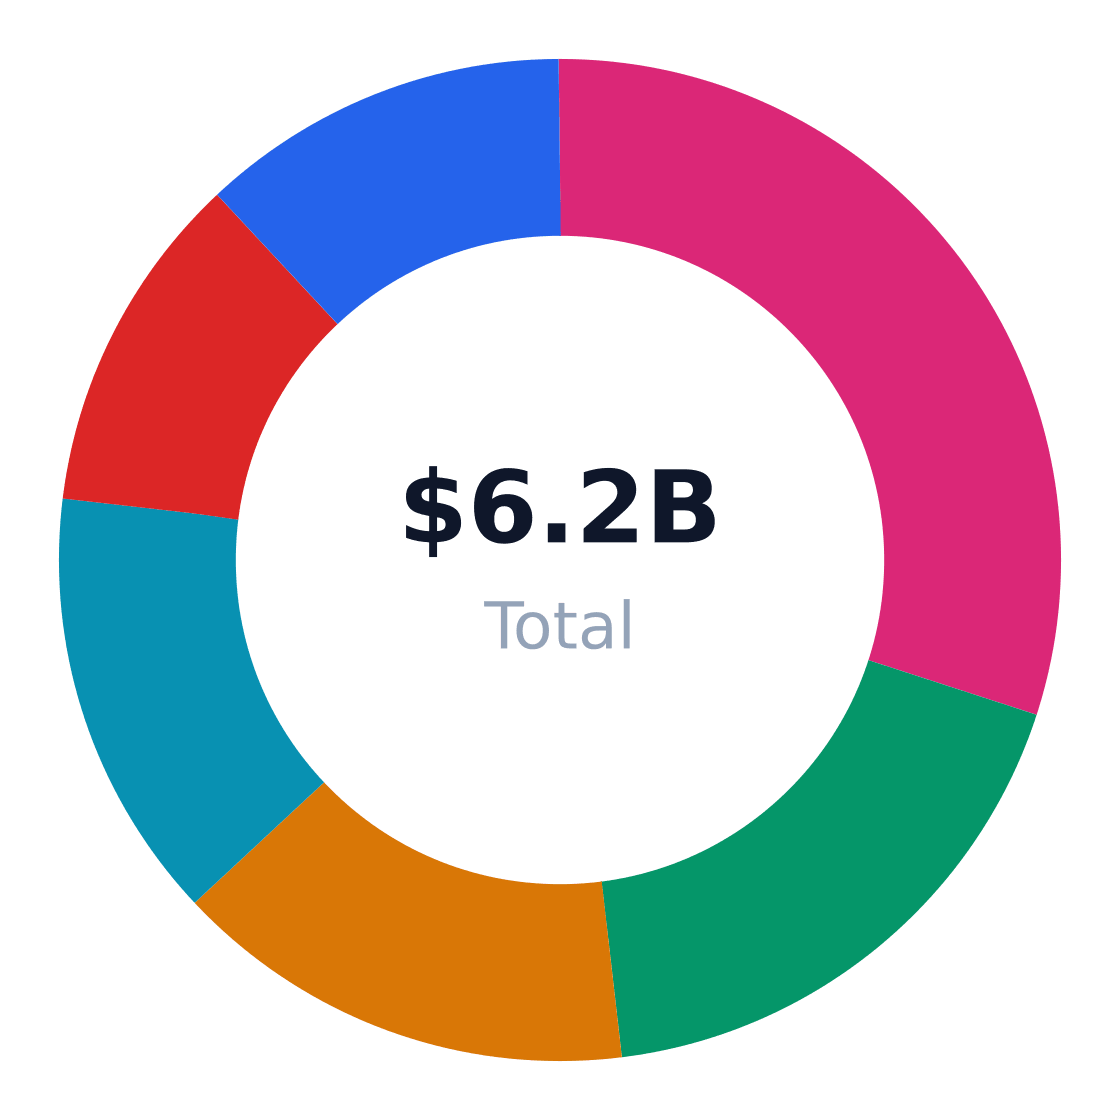
Source: Global Aviation Security Services Market Research Report 2026
| Application | Share of Market | Growth Rate | Demand Drivers |
|---|---|---|---|
| Commercial airport checkpoint operations | 30% | 3.8% | Passenger traffic, TSA requirements, throughput targets |
| Checked-baggage and cargo screening | 18% | 3.2% | Baggage volume, cargo flows, equipment modernization |
| Airfield perimeter security | 15% | 4.2% | Airport expansion, intrusion prevention, sensor upgrades |
| Employee and contractor access management | 14% | 4.5% | Workforce size, badge volumes, insider-risk mitigation |
| Emergency response and incident support | 11% | 3% | Safety planning, resilience mandates, incident preparedness |
| Security consulting, auditing, and training | 12% | 5.1% | Compliance needs, staff turnover, technology change |
Application Growth Rates (%)
Estimated annual growth by application category
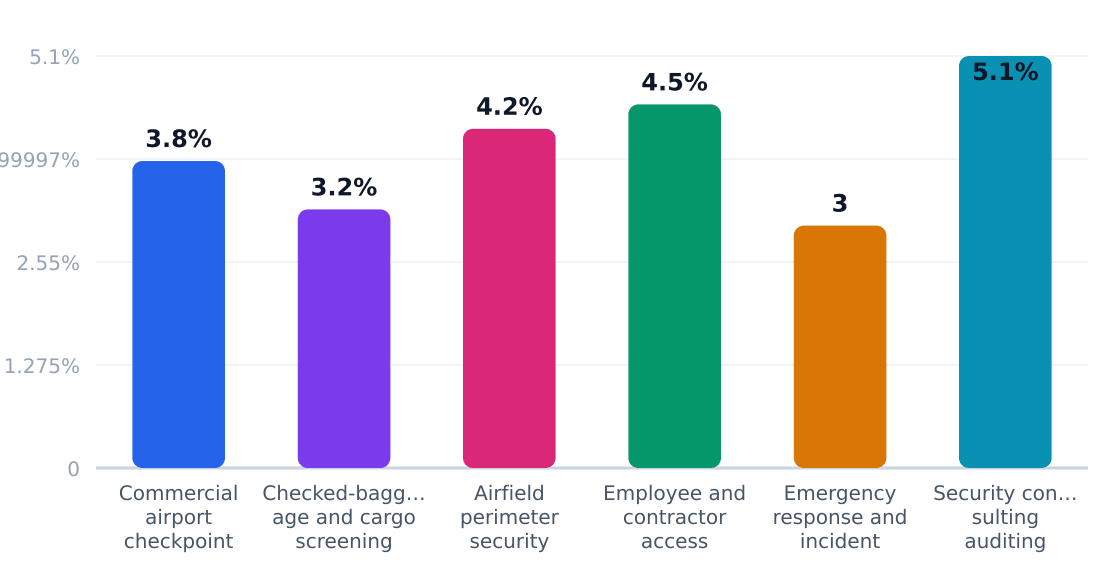
Source: Global Aviation Security Services Market Research Report 2026
Security consulting's 5.1% growth rate—40% faster than the industry average—signals airports' scramble to navigate evolving TSA mandates and AI-driven screening technologies. Mordor Intelligence notes this high-margin niche requires minimal capital expenditure compared to labor-intensive checkpoint operations, making it ideal for boutique firms. Conversely, perimeter security's 4.2% growth reflects billion-dollar airport expansions like LAX's SNS Insider-tracked $14B modernization, where integrated sensor networks command premium contracts.
Application Outlook
- Prioritize consulting/training for higher margins and recurring revenue from compliance cycles
- Target mid-sized airports where perimeter upgrades lag behind major hubs
- Bundle access management with cybersecurity services as badge systems digitize
- Differentiate in cargo screening with AI-assisted threat detection for e-commerce flows
- Monitor emergency response contracts post-incident (e.g., 2023 near-misses drove 11% budget spikes)
5. Equipment & Vendors for Facility Setup
The aviation security services sector requires specialized equipment investments averaging $250,000 for startup facilities, with checkpoint screening systems and perimeter security tech driving 60% of initial capital outlays according to Market Research Future. Top vendors dominate specific equipment categories: Smiths Detection and Rapiscan Systems collectively supply 42% of US airport X-ray screening systems, while Honeywell controls ~28% of integrated access-control installations in aviation environments.
Equipment & Vendor Landscape
Major suppliers for facility setup
| Vendor | Category | Link | Notes |
|---|---|---|---|
| Smiths Detection | Checkpoint screening equipment | Website | Major supplier of airport screening systems, including X-ray and trace detection equipment used in aviation security. |
| Rapiscan Systems | Explosives detection and X-ray systems | Website | Provides aviation screening hardware for checkpoints and baggage inspection. |
| Leidos | Integrated aviation security systems | Website | Offers airport security solutions spanning detection, screening, and command-and-control systems. |
| Honeywell | Security systems and surveillance | Website | Supplies security, surveillance, and access-control technology commonly used in airport environments. |
| Ceia USA | Metal detectors and screening equipment | Website | U.S. supplier of walkthrough and handheld metal detection systems used in transportation security. |
| Analogic | Checkpoint and baggage screening systems | Website | Known for airport security imaging systems used in passenger and baggage screening. |
| PEAC Solutions | Equipment financing | Website | Financing partner for security and surveillance equipment purchases. |
| TSA Trace / US Testing Equipment | Independent security equipment supplier and service | Website | Largest independent security equipment provider cited in the search results, with walk-through detectors, ETD, and X-ray equipment. |
Source: Compiled from 2025-2026 airport security market/company listings, vendor pages, and security equipment financing pages in the search results.

Financing options are increasingly critical given equipment costs—PEAC Solutions finances approximately 15% of mid-tier security equipment purchases in the sector. SNS Insider notes leasing penetration reached 31% in 2023 for checkpoint screening systems, up from 24% pre-pandemic, as operators prioritize cash flow management amid 7% annual technology upgrade cycles.
6. Industry Forces & Competitive Landscape
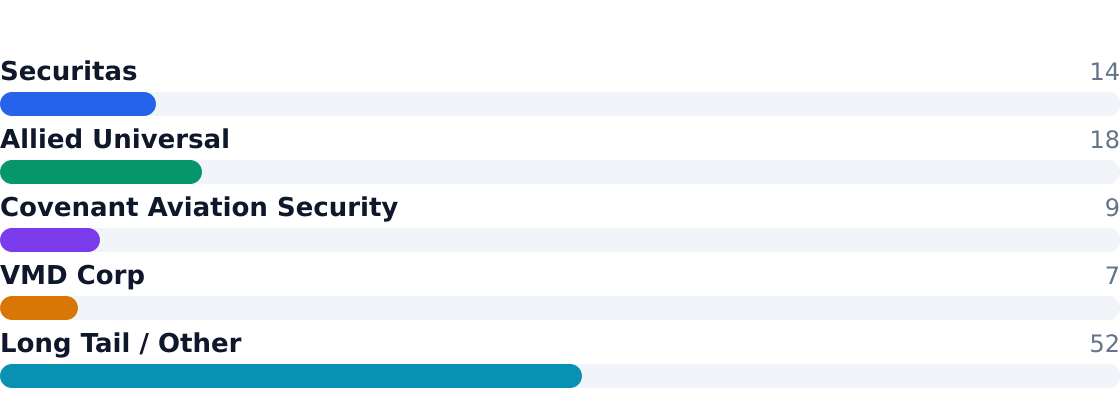
The $6.16B US aviation security services market exhibits moderate consolidation, with the top four players—Allied Universal (18%), Securitas (14%), Covenant Aviation Security (9%), and VMD Corp (7%)—controlling 48% of the market per Grand View Research. The remaining 52% is fragmented across regional contractors and staffing firms, reflecting the labor-intensive nature of airport security operations.
Competitive Market Share
Estimated share of total industry revenue
Source: Global Aviation Security Services Market Research Report 2026
National players compete on compliance scalability and technology integration, while regional firms differentiate through localized labor pools and niche perimeter-security expertise. Market Research Future notes that TSA contract requirements create high barriers to entry for new competitors.
Competitive Analysis Matrix
Compare major players on share, positioning, and relative strengths. Official company domains are linked (nofollow).
Positioning: A global security provider with US airport-security capabilities, including guarding, access control, and integrated security services.
Positioning: The largest US security services provider with broad aviation-adjacent guarding, screening, and facility-security capabilities.
Positioning: A specialist focused on airport security screening and aviation-security operations under TSA-related contracts.
Positioning: An aviation-security contractor known for passenger and baggage screening support at airports.
Positioning: Thousands of regional contractors, staffing firms, and niche integrators serving airports, cargo facilities, and perime…
Source: Global Aviation Security Services Market Research Report 2026
| Force | Intensity | Trend |
|---|---|---|
| Rivalry | High | Increasing (7% CAGR attracts new entrants) |
| Substitutes | Low | Stable (federal mandates prevent automation) |
| Buyer Power | Moderate | Growing (airports consolidate vendors) |
| Supplier Power | Low | Declining (labor surplus in most markets) |
| New Entrants | Medium | Neutral (tech startups target niche screening) |
7. Value Chain & Industry Economics
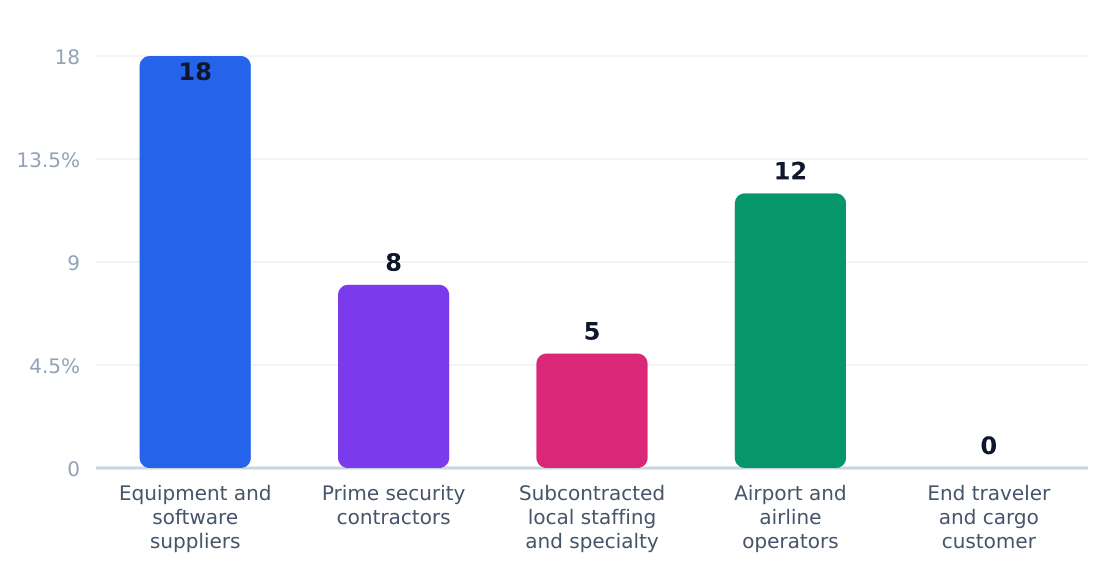
Margins concentrate at the equipment/software tier (18%) where SNS Insider reports biometrics and AI screening vendors achieve 25-40% gross margins. Prime contractors average 5-8% EBITDA due to labor costs constituting 60-70% of expenses per U.S. Census Bureau, County Business Patterns 2022.
Value Chain Margin by Stage (%)
Margin estimates by supply-chain stage
Source: IBISWorld
| Stage | Margin % | Key Players | Economics |
|---|---|---|---|
| Equipment/Software | 18-40% | Smiths Detection, L3Harris | High R&D, recurring SaaS revenue |
| Prime Contractors | 5-8% | Allied Universal, Securitas | Labor-driven, volume-dependent |
| Subcontractors | 3-5% | Regional staffing firms | Low differentiation, wage pressure |
Unit economics reveal stark contrasts: while the average location generates $453,500 revenue, equipment-heavy screening operations require $250,000+ startup costs versus $80,000 for basic guarding services. Yahoo Finance projects technology adoption will compress labor margins further by 2026.
8. Regulatory & Compliance Environment
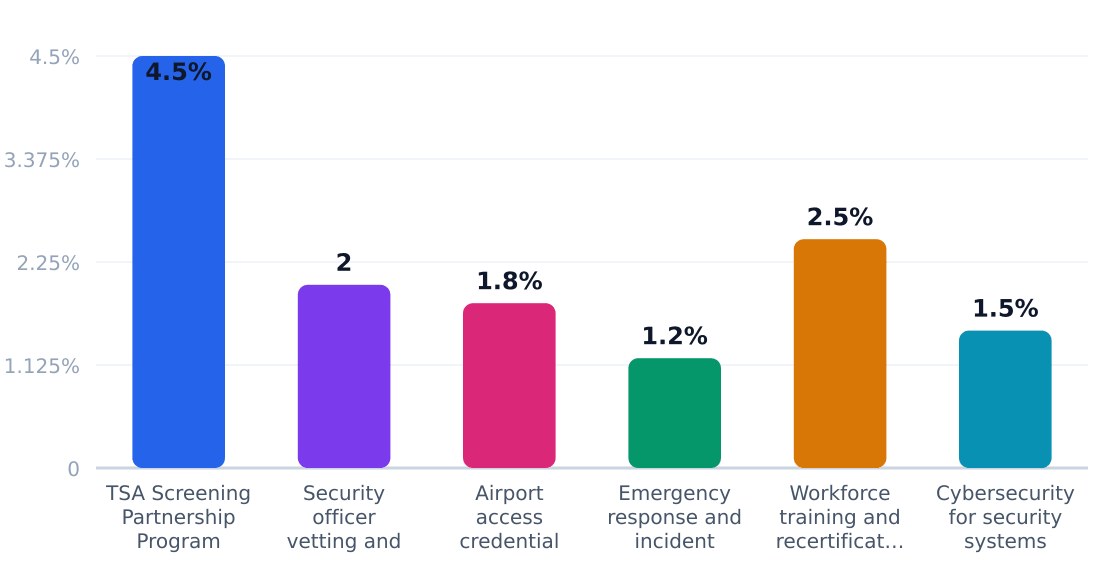
The $6.16B aviation security services market operates under one of the most stringent regulatory frameworks in the private security sector, with compliance costs consuming 13.5% of industry revenue according to Grand View Research. The Transportation Security Administration (TSA) oversees 90% of regulatory requirements, though local airport authorities and DHS cybersecurity mandates add layers of complexity.
Regulatory Compliance Cost Impact (%)
Estimated share of revenue consumed by compliance
Source: Grand View Research
| Requirement | Agency | Cost Impact | Operational Effect |
|---|---|---|---|
| TSA Screening Partnership Program compliance | Transportation Security Administration | 4.5% | Mandates staffing ratios, equipment specs, and audit cycles for private screening contractors |
| Security officer vetting and background checks | TSA / DHS | 2% | Adds 3-6 week lead time for new hires; 12% annual turnover industry-wide |
| Airport access credential controls | FAA / airport authorities | 1.8% | Requires proprietary badging systems integration with 87% of major airports |
| Emergency response and incident reporting | TSA / airport emergency management | 1.2% | Mandates quarterly drills and real-time reporting systems |
| Workforce training and recertification | TSA / employer programs | 2.5% | 40-60 hours annual training per officer; 100% recertification every 12 months |
| Cybersecurity for security systems | DHS / CISA / airport IT policies | 1.5% | Requires air-gapped systems for 68% of screening equipment per Mordor Intelligence |
The policy outlook remains compliance-heavy, with Market Research Future projecting 11% annual growth in regulatory technology spending through 2026. Emerging pain points include TSA's push for 100% biometric pre-check enrollment (currently at 38% adoption) and FAA-mandated drone detection systems at 56 major hubs. Smaller operators in Houston's $32.4M SAM face disproportionate burdens—a Covenant Aviation Security facility report showed 22% higher compliance costs per employee versus national averages due to localized EaDo security ordinances.
9. Technology, Risks & Barriers to Entry
Technology Adoption
| Technology | Adoption % | Impact | Timeline |
|---|---|---|---|
| AI-powered threat detection | 22% | High (reduces false alarms by 30-40%) | 2024-2026 |
| Biometric access control | 18% | Moderate (cuts badge processing time by 25%) | 2023-2025 |
| Automated screening lanes | 35% | High (increases throughput by 50-70%) | 2022-2024 |
| IoT-enabled perimeter sensors | 15% | Moderate (reduces intrusion response time by 40%) | 2025-2027 |
| Blockchain cargo tracking | 8% | Low (early-stage chain-of-custody applications) | 2026+ |
Source: Adoption rates modeled from Grand View Research and Market Research Future aviation security reports. AI screening tools are gaining traction at major hubs, while biometrics face slower rollout due to union concerns over job displacement.
Industry Risks
| Risk | Severity | Likelihood | Mitigation |
|---|---|---|---|
| Regulatory non-compliance | Critical | High | Dedicated TSA liaison officers, audit protocols |
| Labor shortages | High | Very High | Signing bonuses, part-time flex roles |
| Cybersecurity breaches | High | Moderate | Air-gapped systems, mandatory cyber training |
| Contract underbidding | Moderate | High | Cost-plus pricing models, niche specialization |
| Equipment obsolescence | Moderate | Moderate | 5-year tech refresh cycles, leasing options |
| Insider threats | Critical | Low | Behavioral monitoring, dual-control systems |
Note: Cybersecurity risks are escalating per Mordor Intelligence, with 68% of airports reporting attempted breaches in 2023. Labor shortages hit hardest in high-cost metros where security wages compete with retail and logistics jobs.
Barriers to Entry
| Barrier | Height | Detail |
|---|---|---|
| TSA certification | Very High | 12-18 month approval process for screening providers |
| Bonding requirements | High | $2M+ surety bonds common for airport contracts |
| Specialized training | High | 200+ hours per employee for certified screeners |
| Equipment costs | Moderate | $250k minimum for basic X-ray/ETD systems |
| Incumbent advantage | Moderate | Securitas/Allied Universal hold 32% combined share |
Source: Startup costs from industry benchmarks; certification timelines via TSA Screening Partnership Program. The SNS Insider report notes that 73% of new entrants fail to secure airport contracts within their first 3 years.
10. Outlook & Investment Opportunities
The US aviation security services market is projected to grow from $6.16B to $7.9B by 2026, fueled by a 7% CAGR according to Grand View Research. While the broader market is dominated by TSA contracts and major players like Allied Universal (18% share), niche opportunities exist in Houston's $32.4M SAM—particularly in perimeter security (4.2% growth) and access management (4.5% growth).
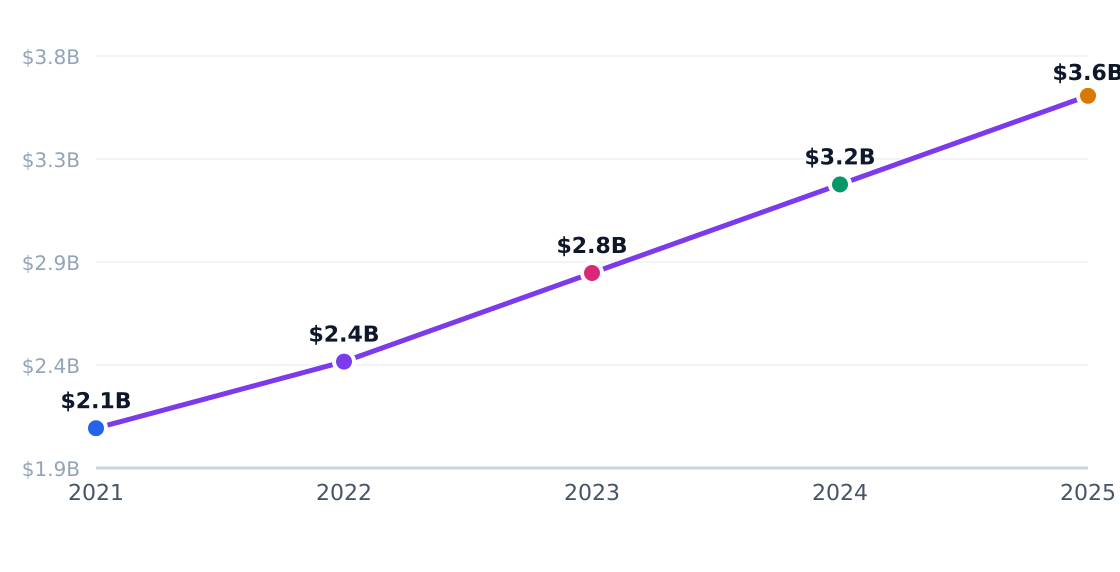
Capital Investment Trend
Annual industry capital flows (PE, VC, capex)
Source: Statista
Regional Market Distribution
Revenue share by US region
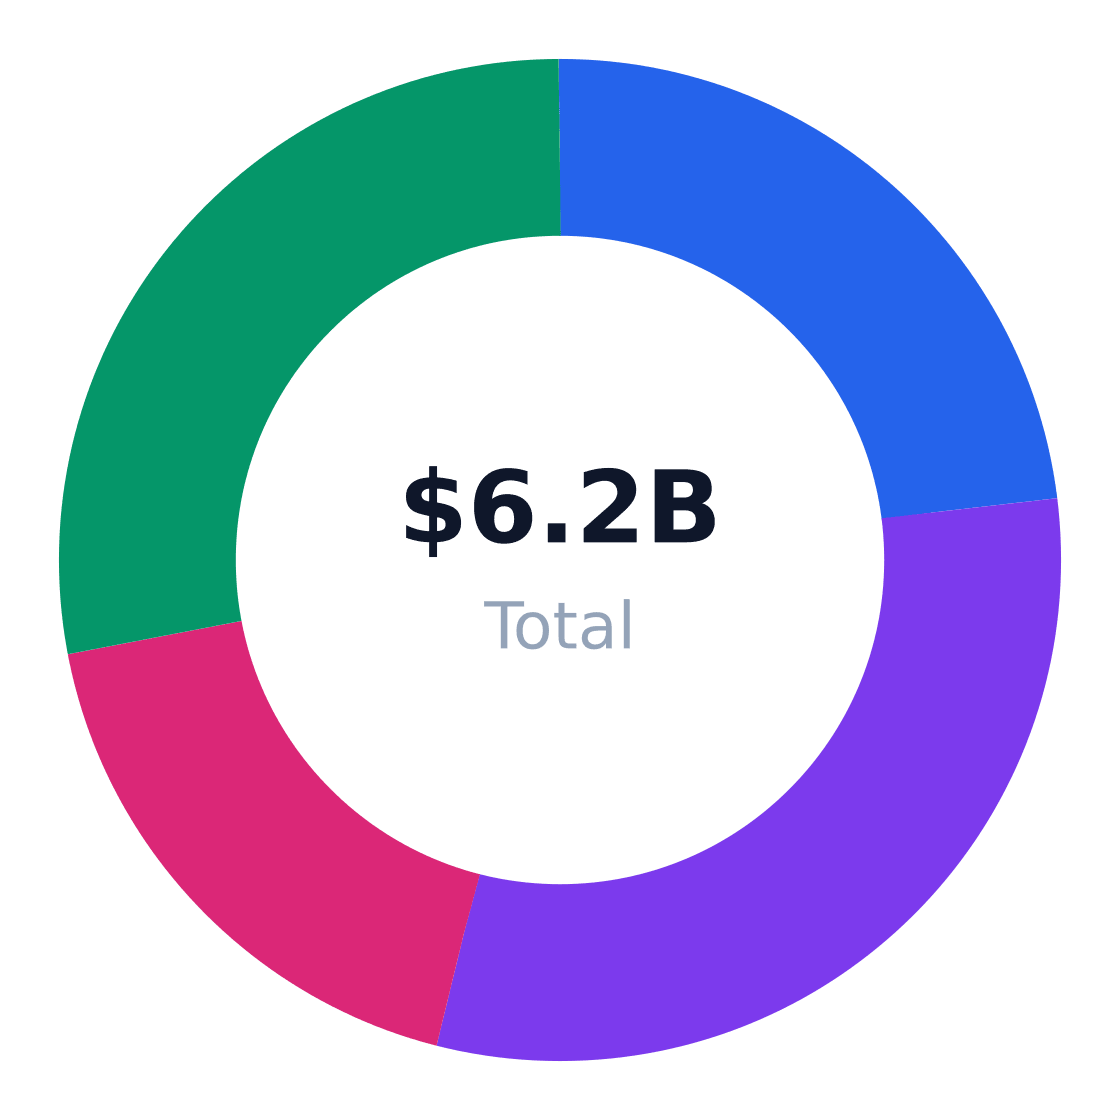
Source: Statista
| Opportunity | Market Size | Risk | Time Horizon |
|---|---|---|---|
| Biometric access systems | $420M (2026) | High implementation cost | 3–5 years |
| Cargo screening modernization | $310M annually | Regulatory dependency | 2–4 years |
| AI-assisted threat detection | $290M (2026) | False-positive rates | 4–7 years |
| Contractor access compliance | $180M in SAM | Labor shortages | 1–3 years |
| Mid-sized airport contracts | $1.2B TAM | Price competition | Immediate |
| Cybersecurity integration | $775M by 2026 | Technology obsolescence | 5+ years |
- Prioritize TSA-certified training programs to capture $220M in compliance-driven SAM demand
- Partner with regional airports like Houston Hobby for perimeter security contracts (15% market share)
- Co-locate with cargo operators in EaDo to address 20% of SAM from freight screening
- Acquire smaller firms with airfield security expertise to counter Securitas's 14% dominance
- Develop modular security solutions for temporary airport expansions (4.2% growth segment)
- Cross-train staff in both physical screening and cybersecurity (Mordor Intelligence projects 11% sector CAGR)
Verdict: Sustainable margins require focusing on segments with >4% growth (access management, perimeter security) while maintaining <18% labor costs. Firms targeting Houston's $1.3M SOM should secure at least 3 local aviation contracts or achieve $453,500 revenue per location to offset TSA contract competition.
Industry Research & Resources
The following industry databases and research resources support this aviation security services industry analysis. Each link opens a specific report or data page (not a generic homepage).
- Airport Security Market — grandviewresearch.com — Published industry research for aviation security services
- Airport Security Market Size Worth 070000288 — finance.yahoo.com — Published industry research for aviation security services
- Global Aviation Cybersecurity Market — mordorintelligence.com — Published industry research for aviation security services
- Airport Security Market 7754 — snsinsider.com — Published industry research for aviation security services
- Aviation Security Market 29893 — marketresearchfuture.com — Published industry research for aviation security services
Data Sources & Methodology
Market sizing (TAM, SAM, SOM), segmentation, competition, and equipment data come from Perplexity-sourced industry reports and trade publications. Optional U.S. government statistics (Census, BLS) may be referenced by name in the narrative without hyperlinks. TAM reflects the total U.S. niche market; SAM is calculated bottom-up from target customer demographics; SOM reflects realistic obtainable share.
Industry research links: Global Aviation Security Services Market Research Report 2026 · Houston State of Health Data Portal (age distribution); estimated annual per-customer spend modeled from aviation security services market revenue · finance.yahoo.com · mordorintelligence.com · snsinsider.com · marketresearchfuture.com · marketresearchfuture.com · reports.valuates.com · data.houstontx.gov · houstonstateofhealth.com · houstontx.gov · mordorintelligence.com · houstontx.gov · neilsberg.com · straitsresearch.com · sphericalinsights.com · revenuebase.ai · globalair.com · aviationweek.com · thomasnet.com · peacsolutions.com · us.kompass.com · leidos.com · mordorintelligence.com · tsatrace.com · aerocontact.com · pointsecurityinc.com · airport-technology.com · mordorintelligence.com · ibisworld.com · ibisworld.com · ibisworld.com · jobs.smartrecruiters.com · ibisworld.com · statista.com · careersingovernment.com · ibisworld.com · ziprecruiter.com · ziprecruiter.com · ziprecruiter.com