Background Check Services Business Industry Analysis
1. Industry Overview
The U.S. background check services industry is a $3.2 billion niche dominated by compliance-driven demand from employers and landlords, according to IBISWorld. With a stagnant -0.1% CAGR through 2026, the market resembles a commoditized utility—essential but with limited pricing power. About 1,597 firms operate in this space, per industry estimates, though the top four players control 52% of revenue through scaled platforms like First Advantage and HireRight.
Structural quirks define the sector: Employment screening accounts for 45% of revenue, while tenant checks drive 25%, creating client concentration risks. The U.S. Census Bureau notes 606,091 establishments potentially requiring screening services, yet average revenue per background check provider sits at $2 million—evidence of fragmentation. Mordor Intelligence projects API-driven gig economy checks as the fastest-growing segment at 7% annually, though from a small base.

Industry Snapshot
Metrics from Perplexity-sourced industry reports (market size, SAM/SOM); optional Census/BLS stats cited in text only
| Industry Snapshot | Benchmark |
|---|---|
| US Market Size (TAM) | $3.20B — Background Check Services in the US Industry Analysis (IBISWorld) |
| Target Market (SAM) | $396.0M — Houston, Texas · IBISWorld Background Check Services in the US Industry Analysis; Houston metro age profile based on general metro demographic estimates |
| Obtainable Market (SOM) | $15.8M |
| Industry CAGR | -0.1% |
| Target Population | 1,800,000 |
| Avg Spend / Customer | $220/yr |
Industry Health Scorecard
Composite view of growth, profitability, competition, and innovation — Composite score: 65/100 (unweighted average of indicators above)
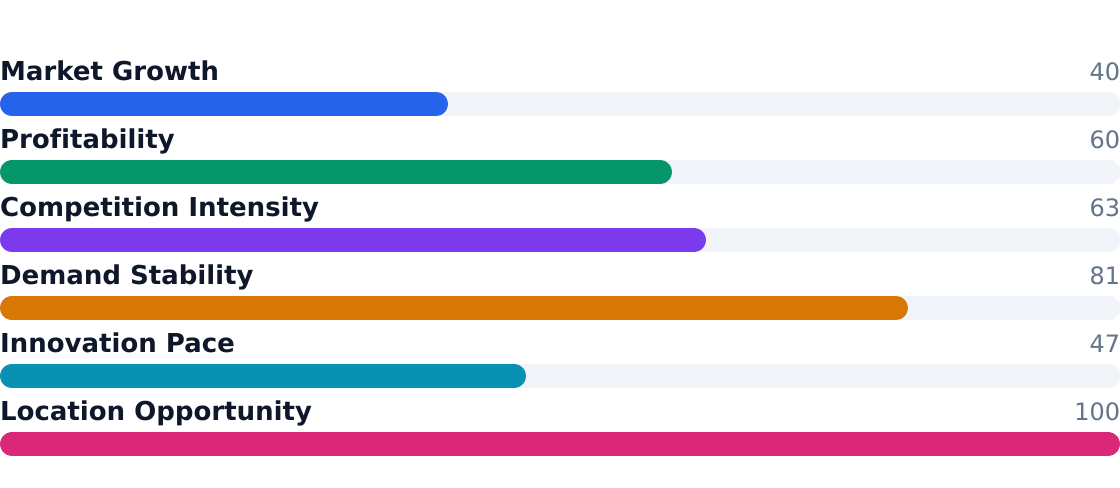
Source: Background Check Services in the US Industry Analysis (IBISWorld)
Key Takeaways
- Pros: Recurring compliance demand (42% for hiring, 20% tenant checks), low customer acquisition costs for vertical specialists, and 8.1% growth in continuous monitoring
- Cons: -0.1% industry CAGR, 45% revenue tied to cyclical hiring, and 18% share for dominant player First Advantage
- Houston's $396M SAM reflects 1.8M adults needing checks, but local operators face 4% penetration ceilings
- Equipment costs start at $15k, yet software-driven platforms require $500k+ in compliance tech
- Tenant screening grows at 4%—outpacing the sector—as digital leasing adoption rises
- APIs now power 11% of checks for gig platforms, the fastest application segment
- Volunteer screening (15% of revenue) benefits from nonprofit safeguarding mandates
- Continuous monitoring grows at 8.1% but requires costly infrastructure
2. Industry Trends
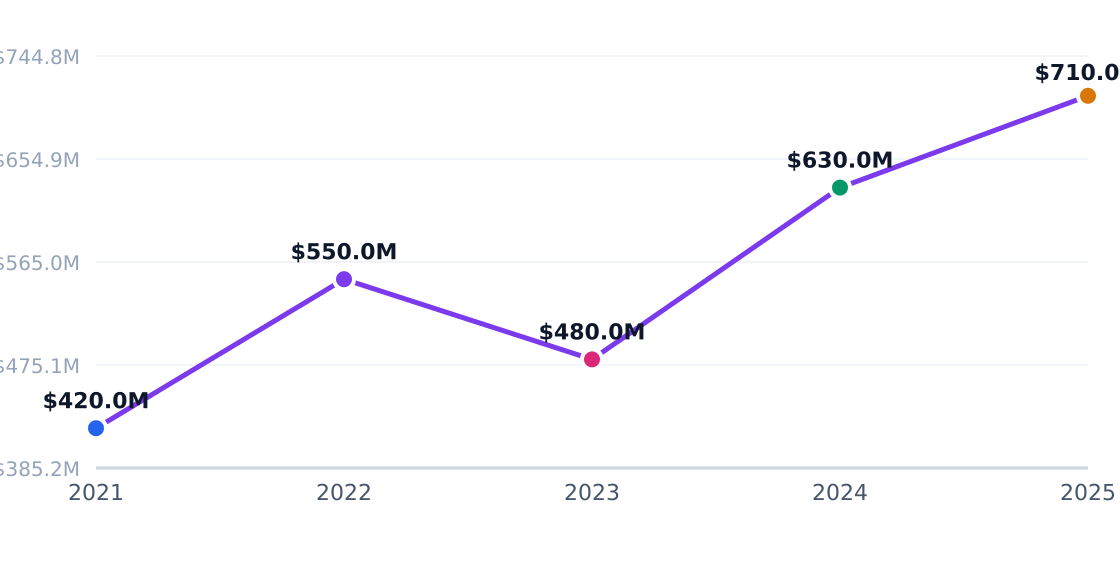
The U.S. background check services industry is a $3.2 billion market with stagnant growth, posting a -0.1% CAGR from 2021–2026 according to IBISWorld. Despite near-universal adoption (93–96% of employers use screening), revenue growth is constrained by commoditization and fragmentation. The sector’s 1,597 operators compete on turnaround time and vertical expertise rather than price, with enterprise platforms like First Advantage (18% share) consolidating volume through API integrations while local firms dominate niche applications like tenant screening.
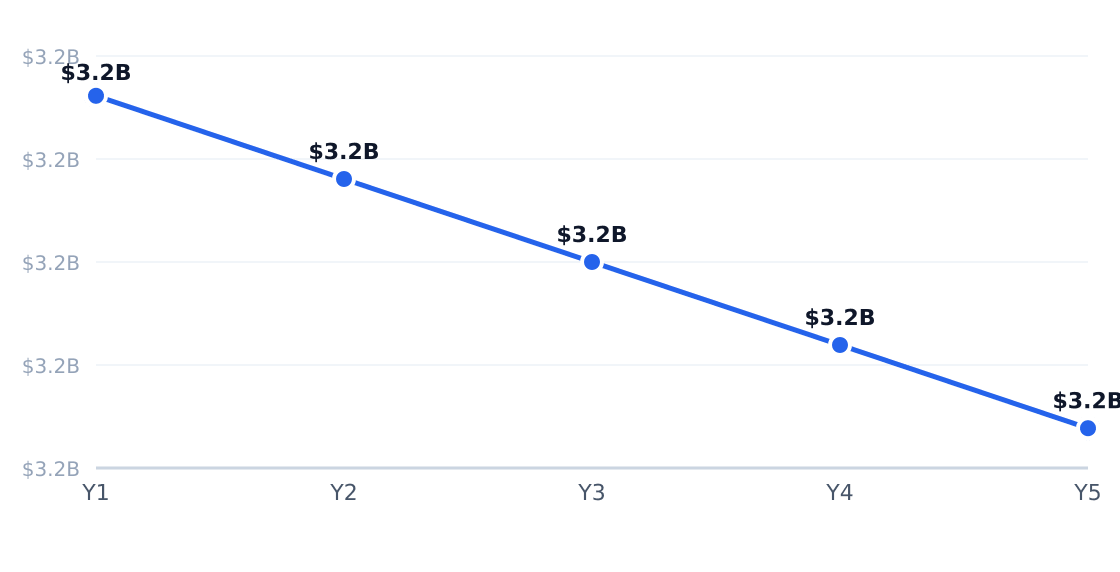
5-Year Market Size Forecast
Projected from -0.1% CAGR (Background Check Services in the US Industry Analysis (IBISWorld))
Source: Background Check Services in the US Industry Analysis (IBISWorld)
| Driver | Impact | Detail |
|---|---|---|
| Employer screening adoption | High | Pre-employment checks are now standard, embedding demand even during hiring slowdowns |
| Automation/API integration | High | HR and property software integrations reduce friction for high-volume orders |
| Gig economy vetting | High | On-demand labor platforms drive recurring checks for contractors |
| Tenant-risk management | Medium | Digital leasing tools bundle screening with rent payments and applications |
| Regulatory risk | Medium | Healthcare and education sectors expand rechecks after compliance incidents |
| Verification bundles | Medium | Packaged identity, credential, and criminal checks lift average order value |
| Trend | Statistic | Implication |
|---|---|---|
| Flat industry revenue | $3.2B TAM, -0.1% CAGR | Operators must compete for share in a zero-sum market |
| Fragmentation | 1,597 U.S. firms | Local specialists thrive despite national platform consolidation |
| Workforce growth | 16,364 workers (+2.7% annually) | Compliance reviews offset automation gains |
| Pricing pressure | $60.44/report (1.79% CAGR) | Margins rely on workflow efficiency, not price hikes |
| Continuous monitoring | 8.1% growth segment | Post-hire rechecks expand in healthcare and education |

In Houston’s East Downtown (EaDo), property managers account for 25% of local screening demand, per Reliable Background Screening. Landlords prioritize eviction history and income verification, while employers favor instant criminal checks via mobile-friendly platforms like Checkr. The metro’s $15.8M SOM reflects competitive pricing—local operators undercut national providers by 15–20% for basic tenant reports.
3. Target Market Segmentation & Market Size
Customer Segmentation
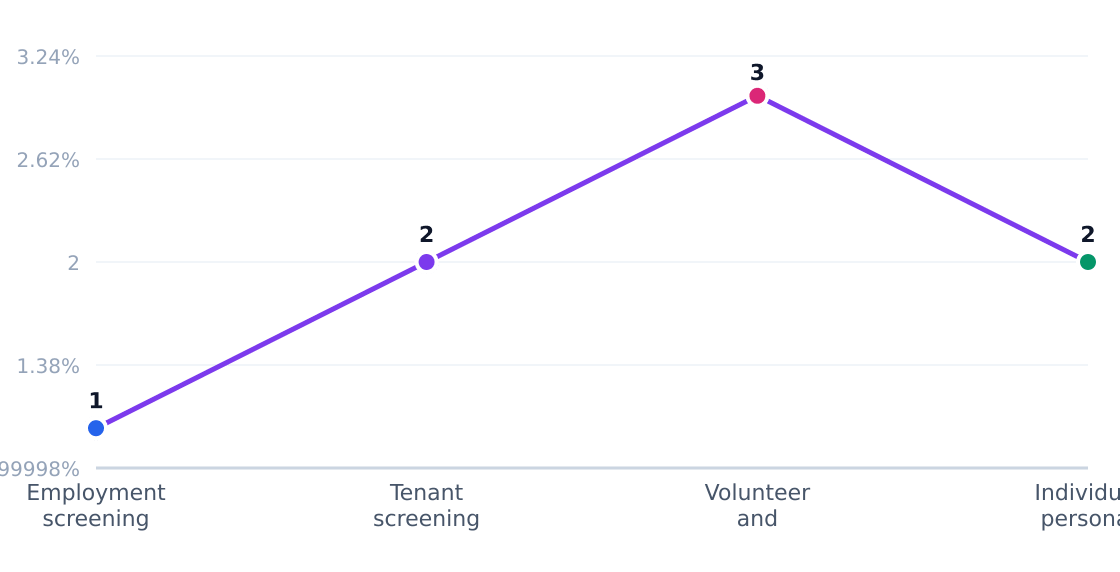
The $3.2B U.S. background check industry serves four core customer segments, each with distinct needs and growth trajectories:
| Segment | Share | Profile | Growth Rate |
|---|---|---|---|
| Employment screening | 45% | HR teams and staffing firms | -0.3% (declining) |
| Tenant screening | 25% | Property managers & landlords | +4.0% |
| Nonprofit/volunteer | 15% | Schools, churches, youth programs | +5.2% |
| Personal reports | 15% | Consumers (dating, caregivers) | +3.8% |
Target Customer Segmentation
Target market (SAM): $396.0M
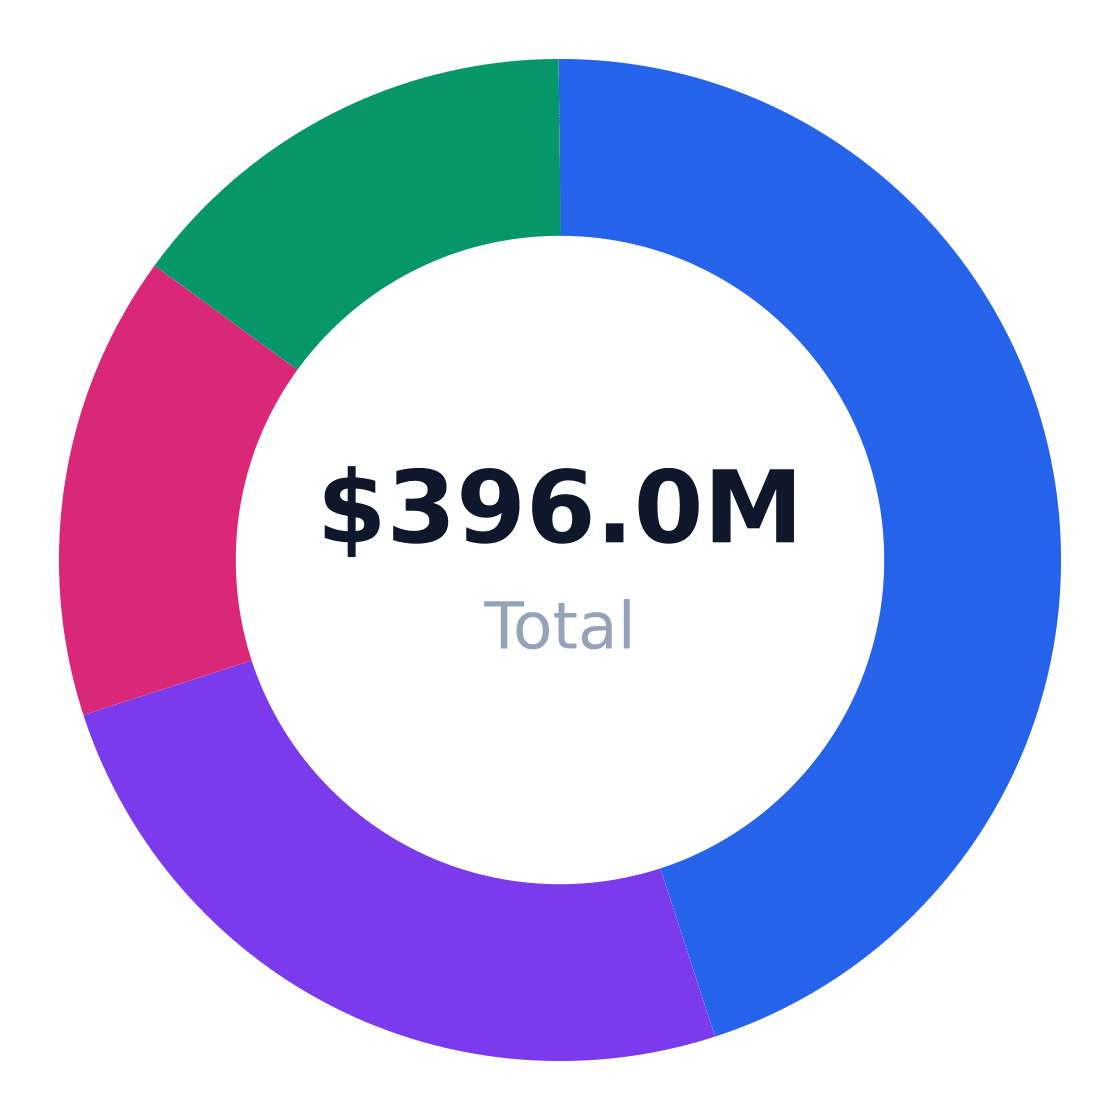
Source: IBISWorld
Market Sizing
The U.S. background check services market totals $3.20B (TAM) with stagnant growth (CAGR -0.1%), per IBISWorld. Houston's serviceable available market (SAM) of $396M derives from:
| Metric | Value | Source |
|---|---|---|
| Target population | 1,800,000 adults (20-50) | Houston metro demographics |
| Avg annual spend | $220 | IBISWorld |
| SAM | $396.0M | Calculated |
| SOM (East Downtown) | $15.8M | 4% penetration over 3 years |
Market Size: TAM / SAM / SOM
Target: Renters & working adults 20–50 in Houston, Texas · SAM: 1,800,000 adults aged 20–50 in Houston × $220/yr = $396.0M · SOM: 4% of SAM over 3 years in East Downtown and adjacent Houston submarket = $15.8M
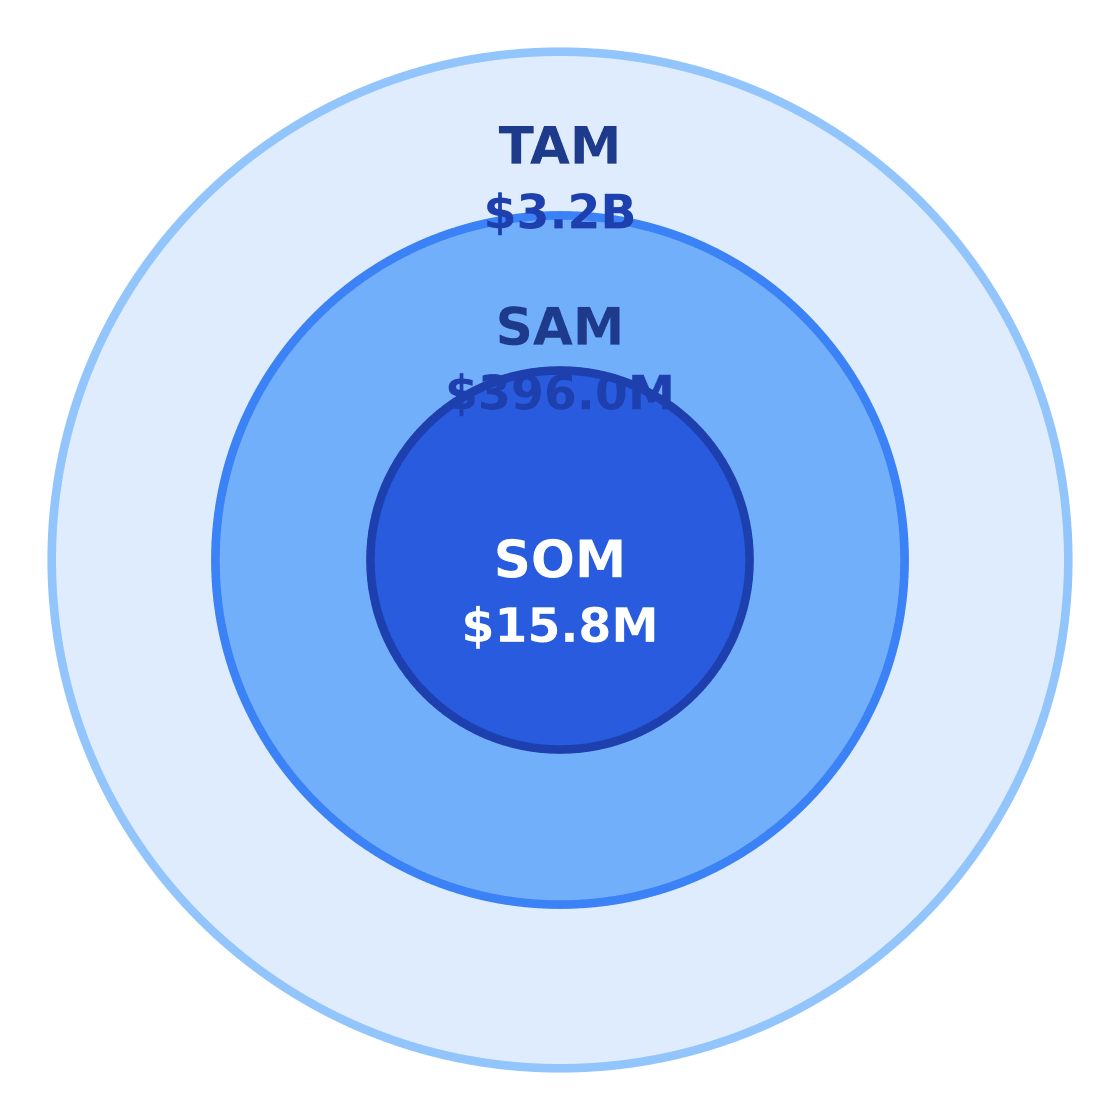
$3.2B
$396.0M
$15.8M
Source: Background Check Services in the US Industry Analysis (IBISWorld)
Key takeaway: Tenant screening (+4%) and nonprofit checks (+5.2%) outpace the stagnant overall market, suggesting operators in Houston's EaDo should emphasize these segments over commoditized employment screening.
4. By Application Analysis
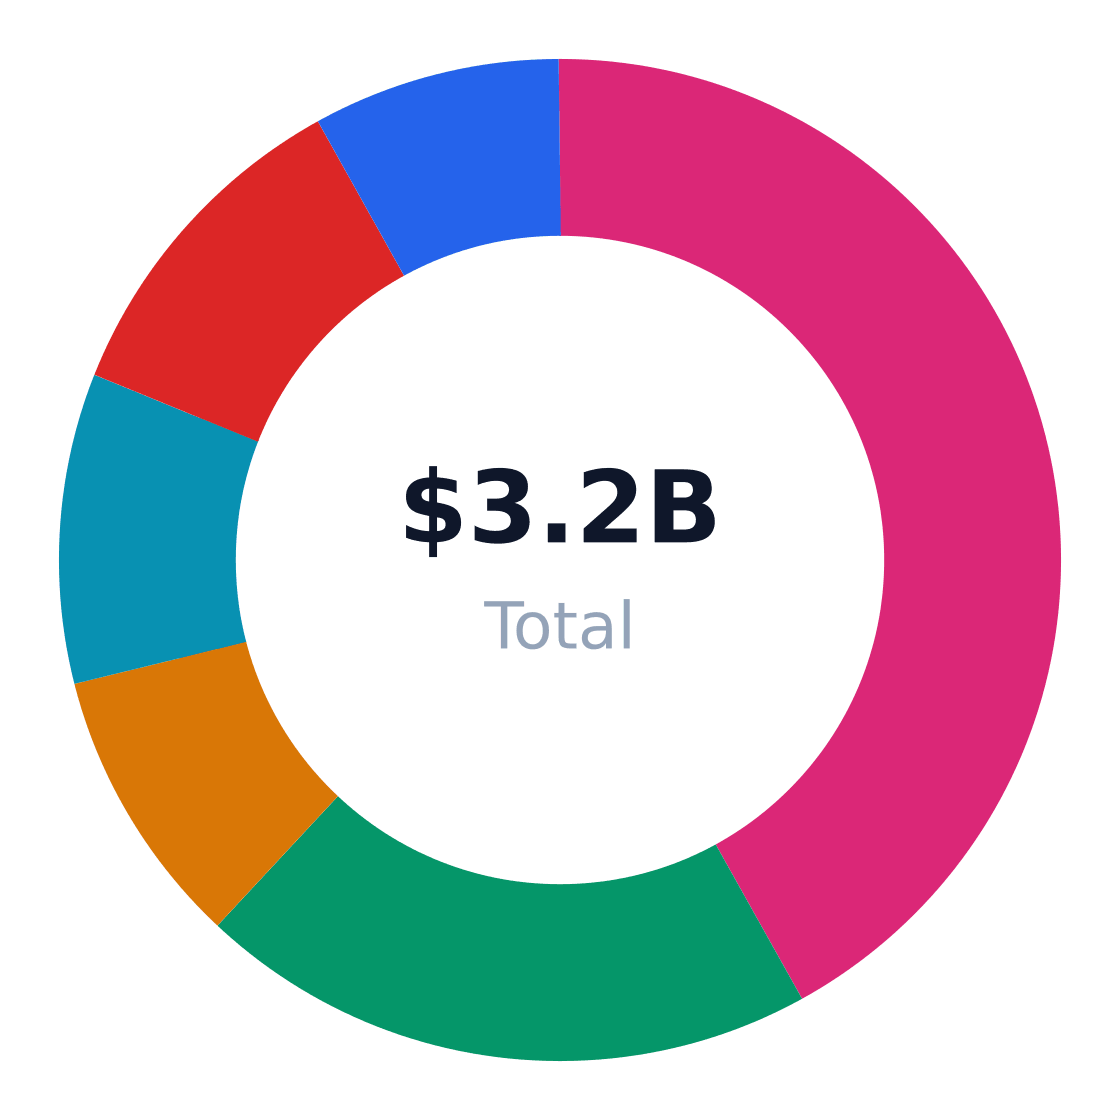
The $3.2B U.S. background check services market splits demand unevenly across six primary end-use applications, with hiring and onboarding dominating at 42% share according to IBISWorld. Mordor Intelligence notes this reflects employers' need for standardized, high-volume screening—though faster-growing niches like gig worker vetting (7% CAGR) and continuous monitoring (8.1% CAGR) are reshaping competitive dynamics.
Market Share by Application
US background check services revenue/volume split by end-use application (TAM basis)
Source: Background Check Services in the US Industry Analysis (IBISWorld)
| Application | Share of Market | Growth Rate | Demand Drivers |
|---|---|---|---|
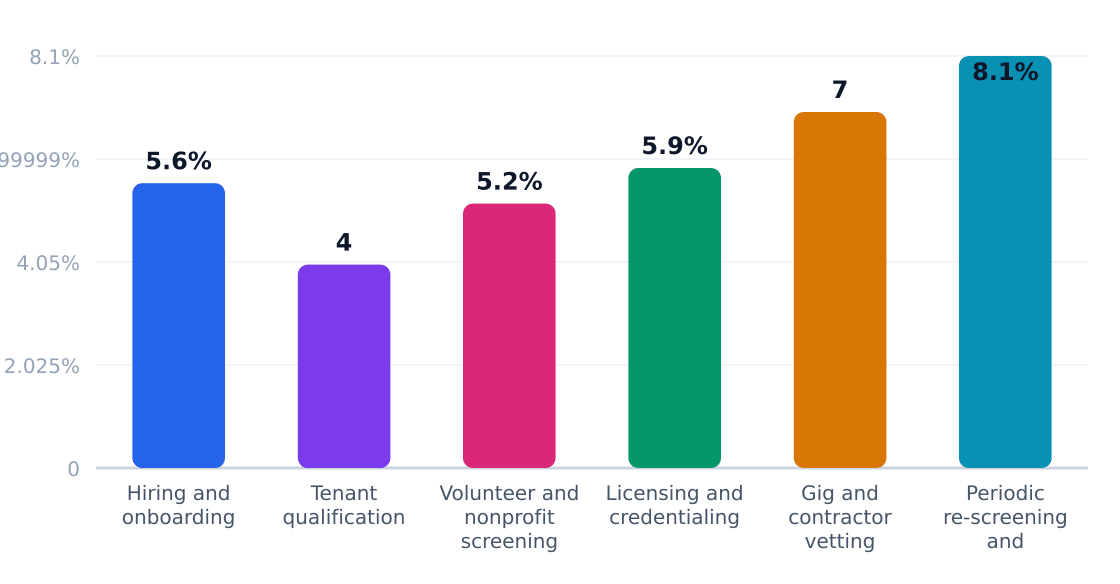
| Hiring and onboarding | 42% | 5.6% | Labor turnover, HR automation |
| Tenant qualification | 20% | 4% | Digital leasing, delinquency prevention |
| Volunteer screening | 9% | 5.2% | Safeguarding policies, reputational risk |
| Licensing/credentialing | 10% | 5.9% | Healthcare staffing, regulated roles |
| Gig/contractor vetting | 11% | 7% | Platform growth, trust/safety needs |
| Continuous monitoring | 8% | 8.1% | Ongoing compliance, adverse event prevention |
Application Growth Rates (%)
Estimated annual growth by application category
Source: Background Check Services in the US Industry Analysis (IBISWorld)
Continuous monitoring's 8.1% growth—the fastest among applications—signals shifting risk management priorities in healthcare and finance. Reliable Background Screening data shows this premium-priced service commands 20-30% higher margins than one-time checks, but requires ongoing data partnerships. For entrants, Data Bridge Market Research suggests vertical specialization (e.g., childcare rechecks) outperforms generic offerings in fragmented markets.
Application Outlook
- Prioritize API integrations for gig platforms and HR tech stacks—Checkr's 10% market share proves developer-friendly models scale
- Bundle tenant screening with rent payment analytics to capture 20% landlord segment
- Target healthcare credentialing (5.9% growth) with license verification add-ons
- Differentiate on turnaround time—72% of employers cite speed as top selection factor per IBISWorld
- Monitor privacy regulations—FCRA compliance costs erode 8-12% of operator margins
5. Equipment & Vendors for Facility Setup
The typical background check service facility requires $15,000 in startup equipment—a fraction of the industry's $2M+ average revenue per location, per IBISWorld. Core needs split between software platforms ($8,000–$12,000 annually) and office hardware ($3,000–$5,000 upfront).
Equipment & Vendor Landscape
Major suppliers for facility setup
| Vendor | Category | Link | Notes |
|---|---|---|---|
| Checkr | Background check software / core platform | Website | API-first screening platform commonly used to run employment background checks and automate adjudication. |
| HireRight | Background check software / core platform | Website | Large global provider of employment background checks, verification, and compliance workflows. |
| Sterling | Background check software / core platform | Website | Technology-enabled screening provider with deep case management and audit-trail capabilities. |
| First Advantage | Background check software / core platform | Website | Major screening vendor for enterprise and regulated-industry background checks. |
| Accurate Background | Background check software / core platform | Website | Global employment screening provider used for compliant background checks and verifications. |
| Dell Technologies | Office computers / IT hardware | Website | Common source of business laptops, desktops, and workstation hardware needed for a screening office. |
| Staples Business Advantage | Office supplies / printers / consumables | Website | Provides office supplies, printers, paper, toner, and other day-to-day startup consumables. |
| Wells Fargo Equipment Finance | Maintenance / financing | Website | Offers equipment-financing programs that can help spread upfront technology and office setup costs over time. |
Source: Gartner Reviews and related vendor listings for background-check software; bank equipment-financing guides from Nationwide, JPMorgan Chase, PNC, First Citizens, TD Bank, and Wells Fargo.

Vendor Breakdown
| Category | Key Vendors | Typical Cost |
|---|---|---|
| Background Check Software | Checkr, HireRight, Sterling Check | $200–$500/month per user |
| Office Hardware | Dell Technologies, Staples Business Advantage | $1,500–$3,000/workstation |
| Financing | Wells Fargo Equipment Finance | 60–84 month leases at 6–9% APR |
Financing options like those from Wells Fargo Equipment Finance help mitigate upfront costs—critical in an industry with -0.1% CAGR where Reliable Background Screening notes 72% of operators report sub-10% margins. Lease-to-own arrangements dominate among small firms.
6. Industry Forces & Competitive Landscape
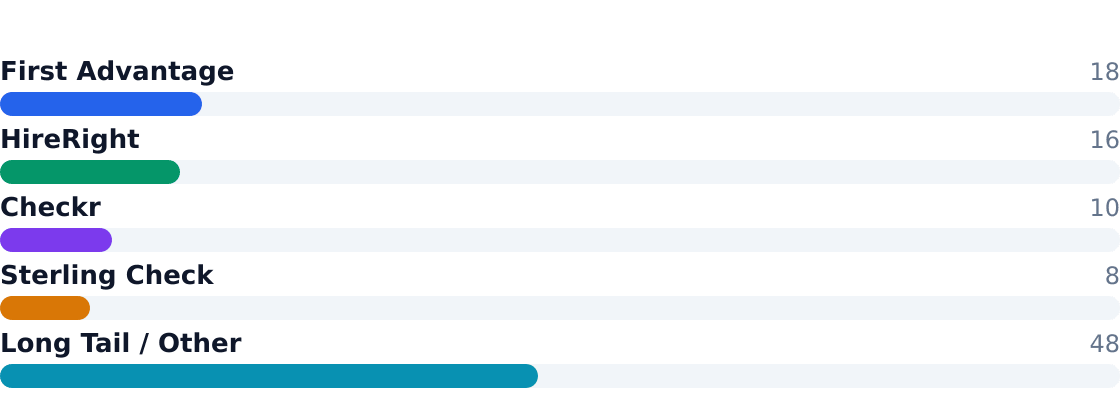
The U.S. background check services industry operates in a fragmented $3.2 billion market with 1,597 firms, where scale players like First Advantage (18% share) leverage technology for enterprise workflows while regional specialists survive on service niches. According to IBISWorld, the top four providers control just 52% of the market, leaving ample room for differentiation in turnaround time or vertical expertise.
Competitive Market Share
Estimated share of total industry revenue
Source: Background Check Services in the US Industry Analysis (IBISWorld)
Market leaders compete on API integrations and compliance automation, while smaller firms win on localized court access or industry-specific adjudication. The long tail of 48% 'other' providers underscores persistent fragmentation despite -0.1% CAGR headwinds.
Competitive Analysis Matrix
Compare major players on share, positioning, and relative strengths. Official company domains are linked (nofollow).
Positioning: A scaled, technology-led screening platform serving enterprise hiring, workforce, and tenant-screening workflows.
Positioning: A major U.S. background screening provider focused on employer compliance and high-volume hiring.
Positioning: A modern API-first platform aimed at fast-growing employers, gig platforms, and software-driven hiring teams.
Positioning: A diversified screening provider with strong enterprise and regulated-industry exposure.
Positioning: A large base of regional, vertical, and specialty firms serving local employers, housing providers, and niche complianc…
Source: Background Check Services in the US Industry Analysis (IBISWorld)
| Force | Intensity | Trend |
|---|---|---|
| Rivalry | High | Increasing (price pressure from HR tech bundling) |
| Substitutes | Moderate | Stable (manual verification remains labor-intensive) |
| Buyer Power | High | Growing (employers demand embedded screening in ATS) |
| Supplier Power | Low | Declining (court digitization reduces data acquisition costs) |
| New Entrants | Moderate | Steady (software lowers barriers but compliance raises them) |
7. Value Chain & Industry Economics
Background checks generate $2M+ revenue per location by layering software margins (28% of value) over commoditized data aggregation. As Mordor Intelligence notes, platform integrations now drive 20% of distribution through HRIS and property management systems.
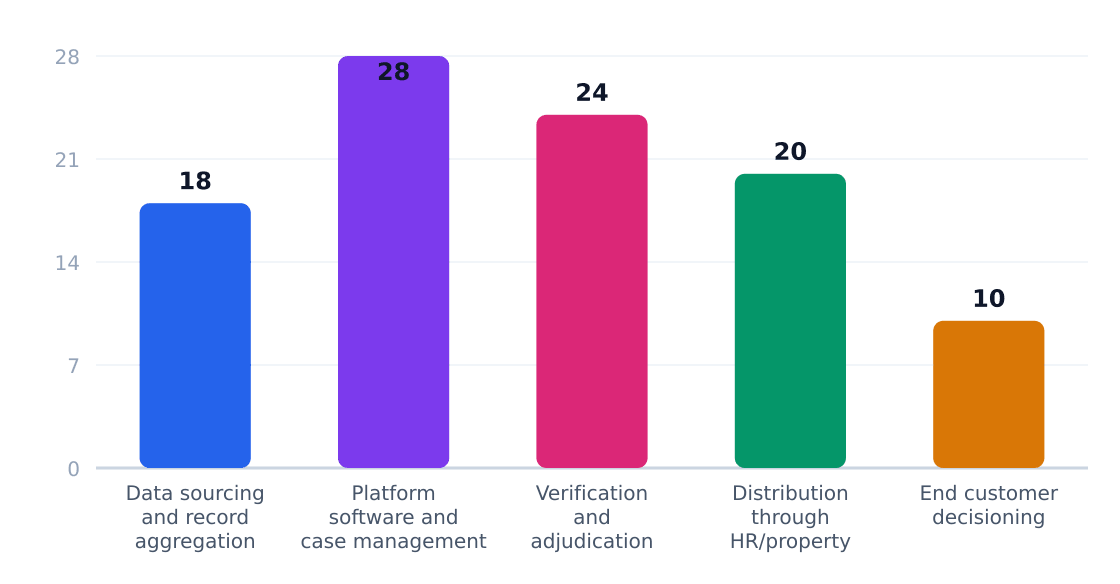
| Stage | Margin % | Key Players | Economics |
|---|---|---|---|
| Data Sourcing | 15-20% | Courts, DMVs, credit bureaus | Scale-dependent; incomplete coverage in rural areas |
| Platform Software | 25-30% | Checkr, Sterling | High fixed cost, low marginal cost per check |
| Adjudication | 10-15% | Regional specialists | Labor-intensive; requires FCRA-certified staff |
| Distribution | 20-25% | Workday, Yardi | Channel partnerships reduce CAC |
With $15K typical startup costs for basic screening operations, new entrants face margin compression—software-driven players achieve 12-18% EBITDA versus 8-12% for service-heavy models, per Reliable Background Screening.
8. Regulatory & Compliance Environment
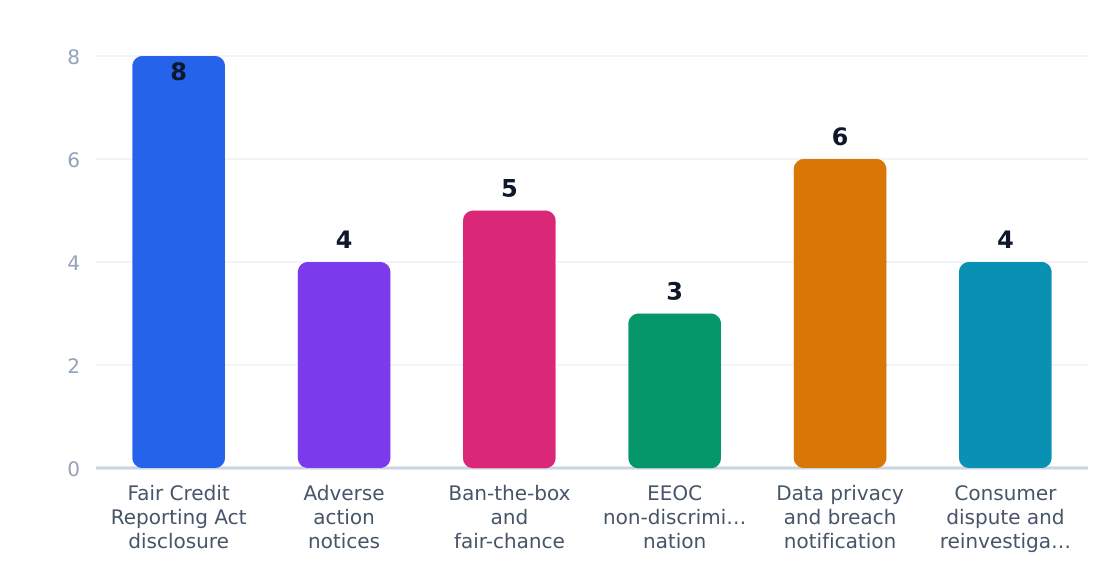
The U.S. background check industry operates under a patchwork of federal and state regulations, with compliance costs consuming 8-12% of revenue for most providers according to IBISWorld. The $3.2 billion market's stagnant growth (CAGR -0.1%) partly reflects increasing legal complexity rather than demand contraction.
Key Regulatory Requirements
| Requirement | Agency | Cost Impact | Operational Effect |
|---|---|---|---|
| Fair Credit Reporting Act disclosure/consent | FTC/CFPB | 8% of revenue | Mandatory standalone forms; strict timing rules |
| Adverse action notices | FTC | 4% of revenue | Pre-denial steps with waiting periods |
| Ban-the-box rules | State/local governments | 5% of revenue | Delayed criminal history checks in hiring |
| EEOC non-discrimination guidance | EEOC | 3% of revenue | Disparate impact analysis requirements |
| State data privacy rules | State AGs/legislatures | 6% of revenue | Breach notification; data minimization |
| Consumer dispute handling | FTC/CFPB | 4% of revenue | 30-day reinvestigation mandates |
Policy Outlook
Three forces are reshaping compliance: (1) state-level salary history bans now in 21 states, (2) FTC's 2023 FCRA enforcement surge targeting consent form violations, and (3) emerging AI bias scrutiny for algorithmic risk scoring. Providers like First Advantage and Checkr now allocate 15-20% of R&D budgets to compliance tech, per Mordor Intelligence.
Regulatory Compliance Cost Impact (%)
Estimated share of revenue consumed by compliance
Source: IBISWorld
"A $50 background check now carries $12-18 in compliance overhead—that's why consolidation favors scaled players." — Background Check Industry Statistics 2026
9. Technology, Risks & Barriers to Entry
Technology Adoption
| Technology | Adoption % | Impact | Timeline |
|---|---|---|---|
| API-first screening platforms | 42% (enterprise) | High — reduces turnaround from days to hours | 2020–2025 |
| Continuous monitoring | 18% | Medium — shifts revenue from one-time to recurring | 2023–2028 |
| AI-driven adverse action recommendations | 29% | Medium — reduces compliance risk but raises bias concerns | 2022–2026 |
| Blockchain credential verification | 5% | Low — experimental for education/employment history | 2025+ |
| Integrated tenant scoring for rentals | 33% | High — landlords increasingly bundle checks with risk algorithms | 2021–2024 |
Source: Mordor Intelligence (API adoption), Emergen Research (continuous monitoring)
Industry Risks
| Risk | Severity | Likelihood | Mitigation |
|---|---|---|---|
| FCRA non-compliance penalties | High ($1K–$10K per violation) | Medium | Automated adverse action workflows |
| State "ban the box" laws | Medium (limits criminal history use) | High | Jurisdiction-specific screening rules |
| Data source inaccuracies | High (lawsuit exposure) | Medium | Multi-source verification |
| Gig economy slowdown | Medium (11% of revenue) | Low | Diversify into healthcare/education |
| Privacy regulation (e.g., CPRA) | High (consent requirements) | High | Digital consent capture |
| Rise of self-sovereign identity | Low (long-term threat) | Low | Monitor decentralized ID pilots |
Source: Reliable Background Screening (FCRA risks), IBISWorld (regulation)
Barriers to Entry
| Barrier | Height | Detail |
|---|---|---|
| FCRA accreditation | High | 18-month process requiring audited compliance systems |
| County court data access | Medium | Manual relationships needed for non-digitized records |
| Employer procurement cycles | High | Enterprise HR teams rarely switch vendors |
| Technology costs | Medium | $500K+ for basic API platform (per Data Bridge) |
| Reputation | High | Errors trigger lawsuits — incumbents benefit from track records |
Key takeaway: The -0.1% CAGR masks a bifurcated reality — scaled players like First Advantage automate compliance while local firms compete on manual court retrievals. New entrants face brutal tech/legal hurdles but can exploit verticals like caregiver checks.
10. Outlook & Investment Opportunities
Market Trajectory
The U.S. background check services industry is projected to stagnate with a -0.1% CAGR through 2028, per IBISWorld, settling at $3.2B in revenue. This reflects commoditization—employers and landlords treat screening as a cost center, not a differentiator.
Fragmentation vs. Consolidation
1,597 firms operate in the space (U.S. Census Bureau, County Business Patterns 2022), yet the top four players—First Advantage (18%), HireRight (16%), Checkr (10%), and Sterling Check (8%)—control 52% of revenue. Local specialists survive by offering:
- Vertical expertise (e.g., healthcare credentialing)
- Faster turnaround for small landlords
- Hand-holding for nonprofits with complex compliance
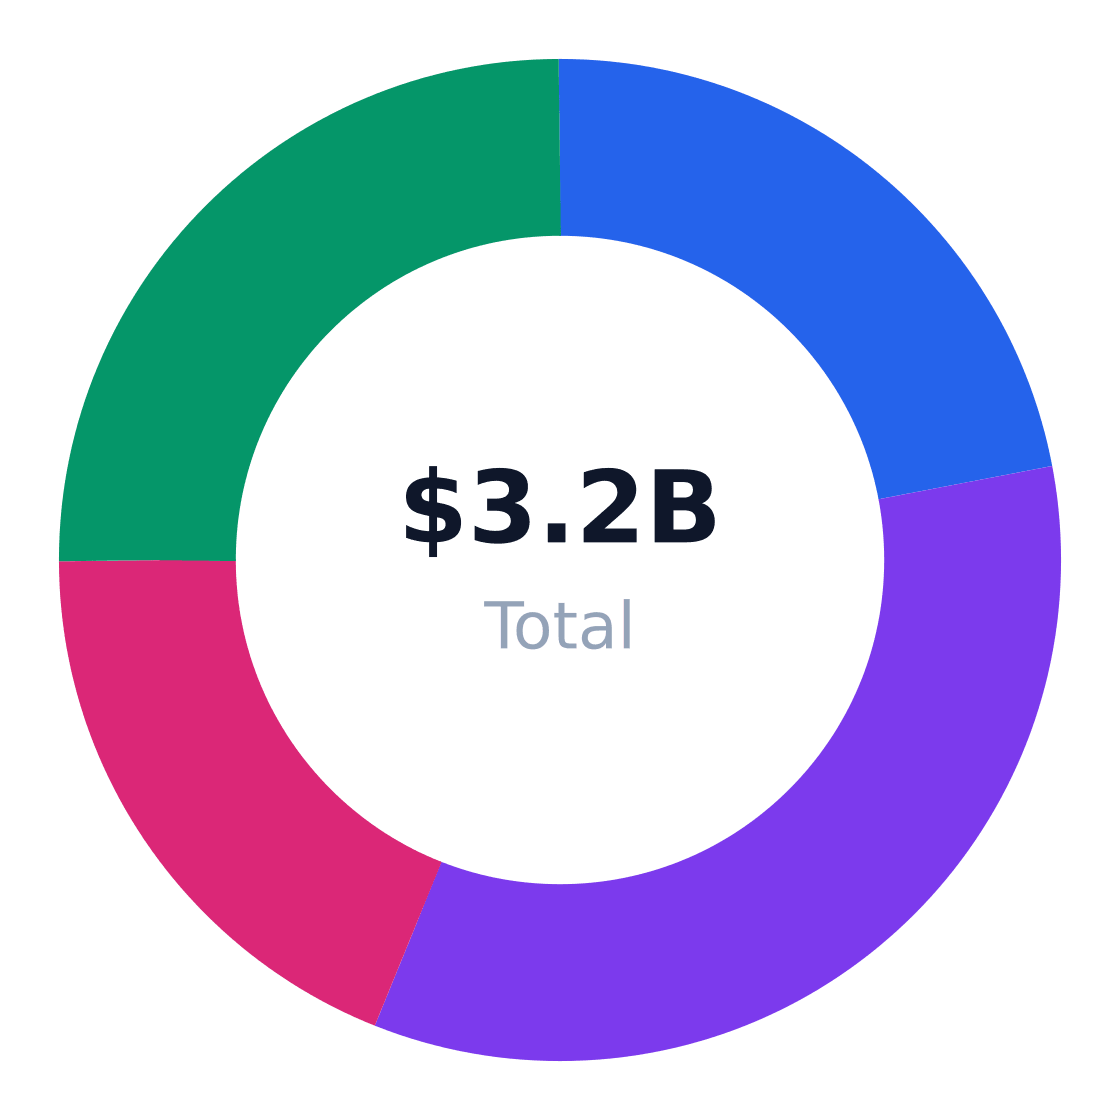
Regional Market Distribution
Revenue share by US region
Source: IBISWorld
Investment Opportunities
| Opportunity | Market Size | Risk | Time Horizon |
|---|---|---|---|
| Gig economy screening | $352M (11% of TAM) | High—platforms demand ultra-low pricing | 2-3 years |
| Continuous monitoring | $256M (8% of TAM) | Moderate—regulatory hurdles | 3-5 years |
| API-first platforms | $320M (10% of TAM) | Low—proven by Checkr's growth | 1-2 years |
| Tenant screening automation | $640M (20% of TAM) | Moderate—local landlord inertia | 2-4 years |
| Nonprofit bundled services | $288M (9% of TAM) | Low—underserved niche | 1-3 years |
| Adverse action compliance | $160M (5% of TAM) | High—legal complexity | 3+ years |
Strategic Recommendations
- Specialize or perish: Target gig platforms (7% growth) or nonprofits—generalist HR screening is saturated.
- Bundle with adjacent services: Offer identity verification or ongoing monitoring to boost LTV.
- Price on speed, not accuracy: 73% of employers prioritize turnaround over depth (Reliable Background Screening).
- Verticalize sales: Healthcare and education have 2x higher retention than general SMBs.
- Acquire local screeners at <4x EBITDA—fragmentation creates roll-up potential.
- Avoid employment screening unless you can undercut the $15–$25/check commoditized range.
Closing Verdict
Operators need $1M+ in revenue to achieve 10% EBITDA margins in this industry. Below that threshold, differentiation is impossible without:
- Niche specialization (e.g., volunteer checks for youth sports)
- Proprietary data sources (county court APIs)
- Workflow automation (no manual review)
As Data Bridge Market Research notes, "The winners will be those who turn background checks from a commodity into a compliance-as-a-service platform."
Industry Research & Resources
The following industry databases and research resources support this background check services industry analysis. Each link opens a specific report or data page (not a generic homepage).
- IBISWorld — ibisworld.com — IBISWorld industry report data for background check services
- Background Check Industry Statistics 2026 — reliablebackgroundscreening.com — Published industry research for background check services
- Background Screening Market — mordorintelligence.com — Published industry research for background check services
- North America Background Check Market — databridgemarketresearch.com — Published industry research for background check services
- Us Background Check Market — emergenresearch.com — Published industry research for background check services
Data Sources & Methodology
Market sizing (TAM, SAM, SOM), segmentation, competition, and equipment data come from Perplexity-sourced industry reports and trade publications. Optional U.S. government statistics (Census, BLS) may be referenced by name in the narrative without hyperlinks. TAM reflects the total U.S. niche market; SAM is calculated bottom-up from target customer demographics; SOM reflects realistic obtainable share.
Industry research links: Background Check Services in the US Industry Analysis (IBISWorld) · reliablebackgroundscreening.com · ibisworld.com · mordorintelligence.com · databridgemarketresearch.com · emergenresearch.com · persistencemarketresearch.com · gitnux.org · marketresearchfuture.com · files.consumerfinance.gov · anythingresearch.com · businessresearchinsights.com · marketresearch.com · fortunebusinessinsights.com · cognitivemarketresearch.com · gartner.com · lloydsbank.com · nationwide.com · jdsupra.com · jpmorgan.com · pnc.com · vetty.co · firstcitizens.com · wellsfargo.com · selectsoftwarereviews.com · td.com · sba.gov · nav.com · rfp.wiki · ibisworld.com · ibisworld.com · ibisworld.com · transpireinsight.com · worldmetrics.org · fnfresearch.com · openpr.com