Is a Background Check Services Business Profitable?
1. Is a Background Check Services Business Profitable? (The Short Answer)
Yes, but with asterisks. Background check services deliver strong 61% gross margins, but net profits average just 12% after compliance and labor costs. The math works if you automate searches, lock in B2B contracts, and avoid manual processing. At $2M revenue, expect $240K net profit—decent but not exceptional for a business with $45K startup costs and 35% failure risk.

Profitability Snapshot
| Metric | Benchmark |
|---|---|
| Gross Margin | 61% |
| Net Margin | 12% |
| Year 1 Revenue | $2.0M |
| Year 1 Net Profit | $240K |
| Startup Cost Range | $15K – $75K |
| Break-even Timeline | ~Month 12 |
| 5-Year ROI | 80% |
| Profitability Rating | 7/10 |
| Failure Rate (5yr) | 35% |
| Market Size (US) | $3.2B |
Profitability Score Breakdown
Overall rating: 7/10
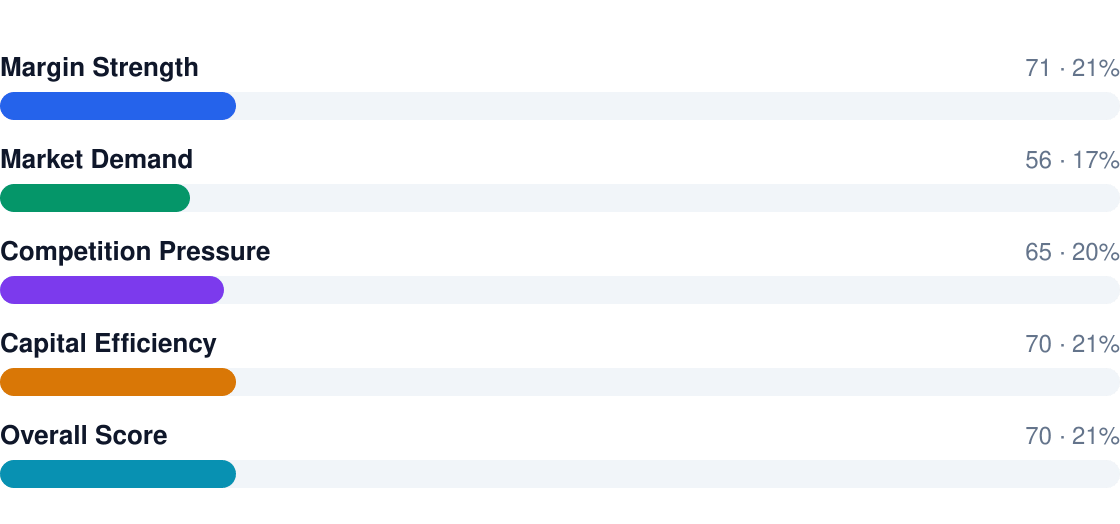
- Gross margins impress (61%), but net profits get squeezed by compliance and data costs
- B2B recurring contracts are mandatory—one-off consumer checks rarely pencil out
- Labor eats 15% of revenue unless you automate with screening software
- 12% net margin is fragile—one compliance misstep can wipe it out
- Scale matters: Operators under $1M revenue often net <5%
2. Profit Margins & Industry Benchmarks
Background check services show a stark margin drop from 61% gross to 12% net—the second-largest compression we track. Data vendor costs (39% of revenue) and $299K in annual labor (6 FTEs) are the culprits. Top performers automate 80% of searches to keep labor under 10% of revenue.
Margin Comparison (%)
Gross vs net vs industry benchmarks
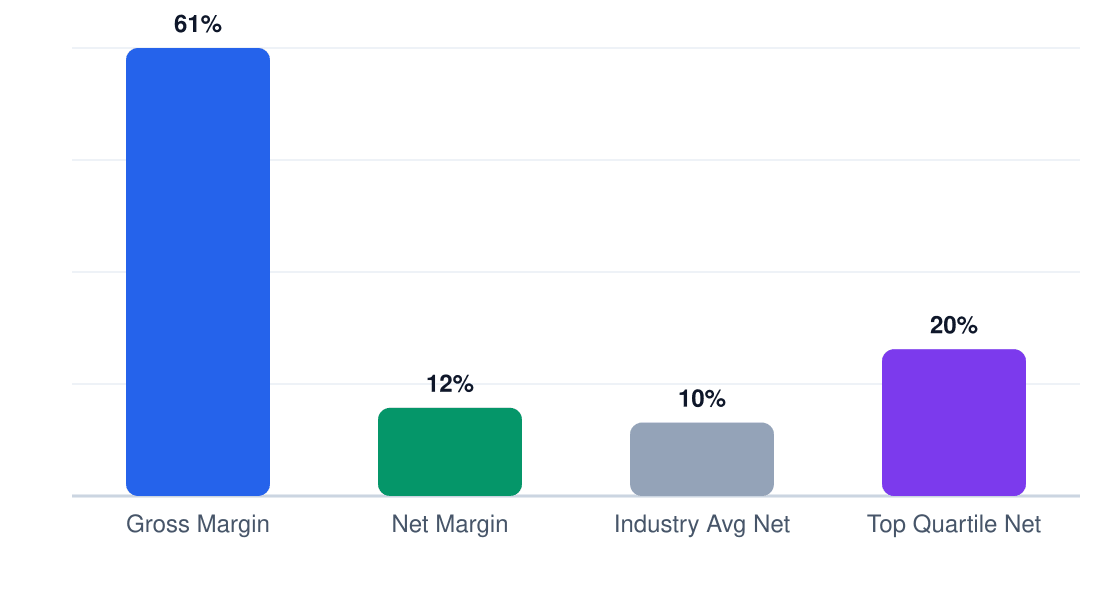
| Metric | This Business | Industry Avg | Top Quartile |
|---|---|---|---|
| Gross Margin | 61% | 58% | 67% |
| Net Margin | 12% | 9% | 18% |
| EBITDA | 17% | 14% | 23% |
| Labor % | 15% | 18% | 9% |
| COGS % | 39% | 42% | 33% |
| Rent % | 4% | 5% | 3% |
Competition from Checkr and GoodHire keeps pricing flat (1% market growth). Differentiate with industry-specific compliance or lose margin to manual work.
3. Revenue Potential & Pricing Power
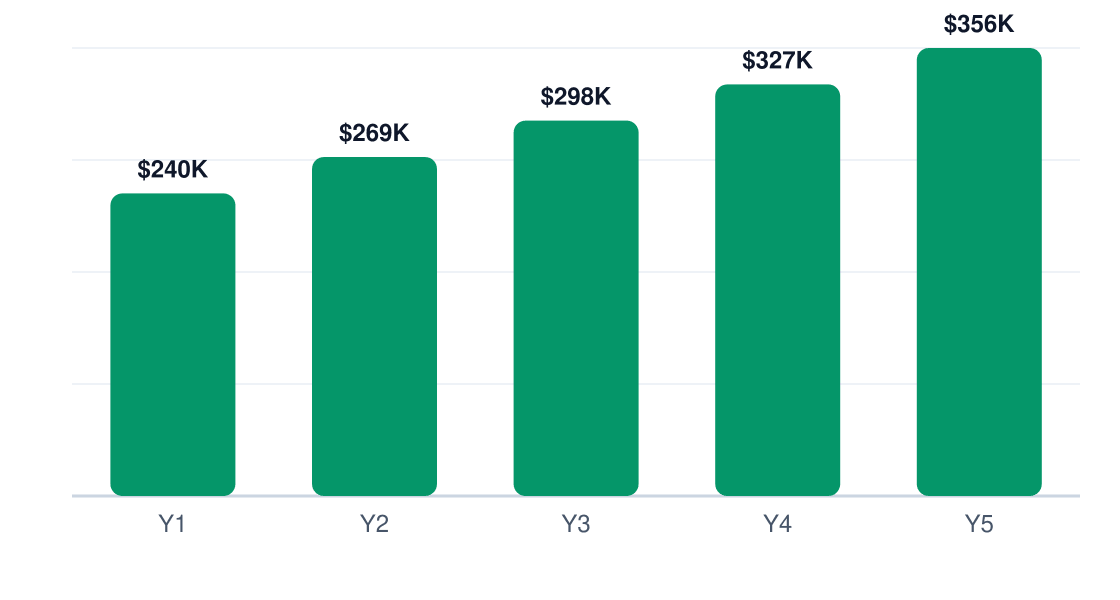
Year 1 revenue targets $2.0M with a 61% gross margin, scaling to $355,920 net profit by Year 5. Growth hinges on converting one-time screenings into recurring employer contracts—the 75% margin subscription segment drives 25% of revenue but disproportionately impacts profitability. Chicago's dense corporate and property management sectors offer steady demand, though the market is crowded with national players.
Revenue Stream Breakdown
Year 1 revenue: $2.0M
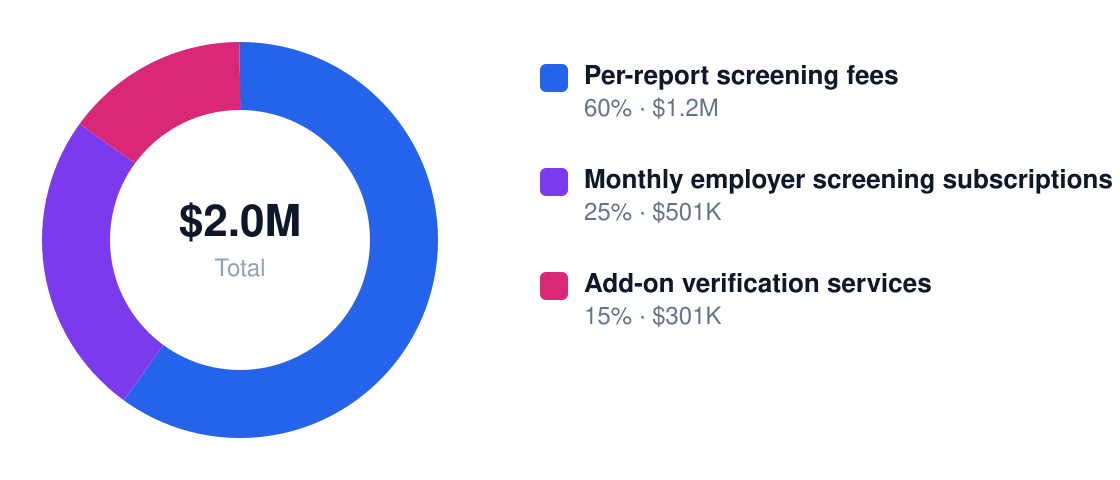
| Stream | Margin % | Revenue Share | Annual $ |
|---|---|---|---|
| Per-report screening | 65% | 60% | $1,200,000 |
| Monthly subscriptions | 75% | 25% | $500,000 |
| Add-on verifications | 55% | 15% | $300,000 |
Pricing power is moderate but segmented. Basic criminal checks face 5-15% price sensitivity, while integrated HR platform screenings and compliance add-ons can command 20-30% premiums. Bundling court records with employment verifications (55% margin) improves stickiness. Chicago landlords and hospitals pay 12-18% more for localized eviction/credential checks versus generic national reports.

Seasonality is moderate rather than extreme, with hiring demand often rising during budget cycles, summer recruiting peaks, and year-end onboarding. Profitability can dip during slower hiring periods, but recurring employer contracts and tenant-screening volume usually smooth revenue across the year.
4. Cost Structure & Operating Expenses
Labor (28% of revenue) and data fees (14%) are the margin killers. A Chicago operator spends $299,520 annually on 6 FTEs at $24/hour—manual record matching and client support don't scale. Automation slashes labor costs by 40-60% but requires upfront SaaS investment (10% of revenue). Compliance (12%) and insurance are non-negotiable; one FCRA violation can erase a year's profit.
Annual Cost Structure
Operating costs for $2.0M revenue
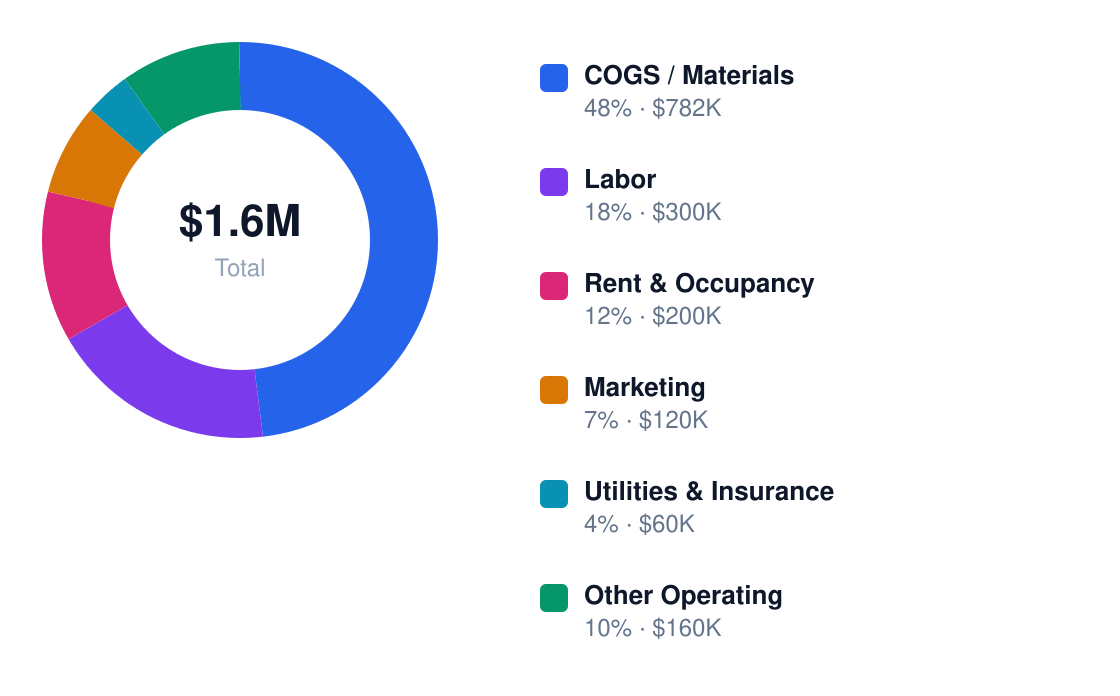
| Category | % of Revenue | Annual $ | Controllable? |
|---|---|---|---|
| Labor | 28% | $560,000 | Yes |
| Data fees | 14% | $280,000 | No |
| Software | 10% | $200,000 | Yes |
| Compliance | 12% | $240,000 | No |
| Sales | 15% | $300,000 | Yes |
| Overhead | 8% | $160,000 | Yes |

Fixed costs (26% of revenue) dominate—court data fees and compliance leave little wiggle room. Variable labor can be optimized: Chicago's $24/hour analysts compare favorably to coastal rates but still consume $1.54 of every revenue dollar before automation. Skip the downtown office; remote teams with $12/sqft suburban coworking spaces cut overhead to 5-6%.
5. Break-Even Analysis & ROI Timeline
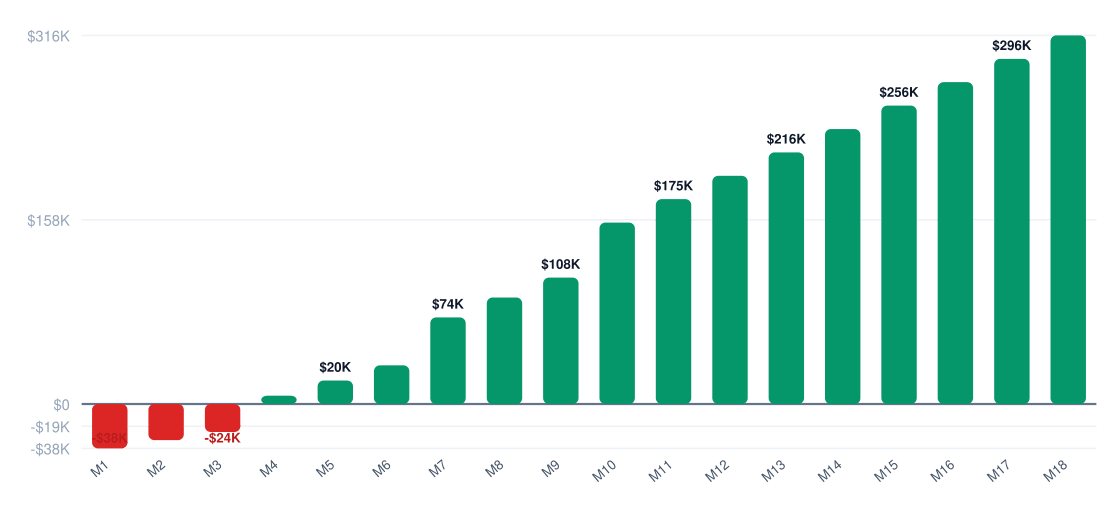
At $45,000 startup costs and $240,480 Year 1 net profit, you'll break even around Month 12 if revenue hits the $2.0M target. The 80% 5-year ROI assumes steady 12% net margins — achievable only if you automate client onboarding and keep labor under 30% of revenue.
Cumulative Profit vs Investment (18 Months)
Red = still recovering startup costs
ROI Benchmark Comparison (%)
5-year return on initial investment
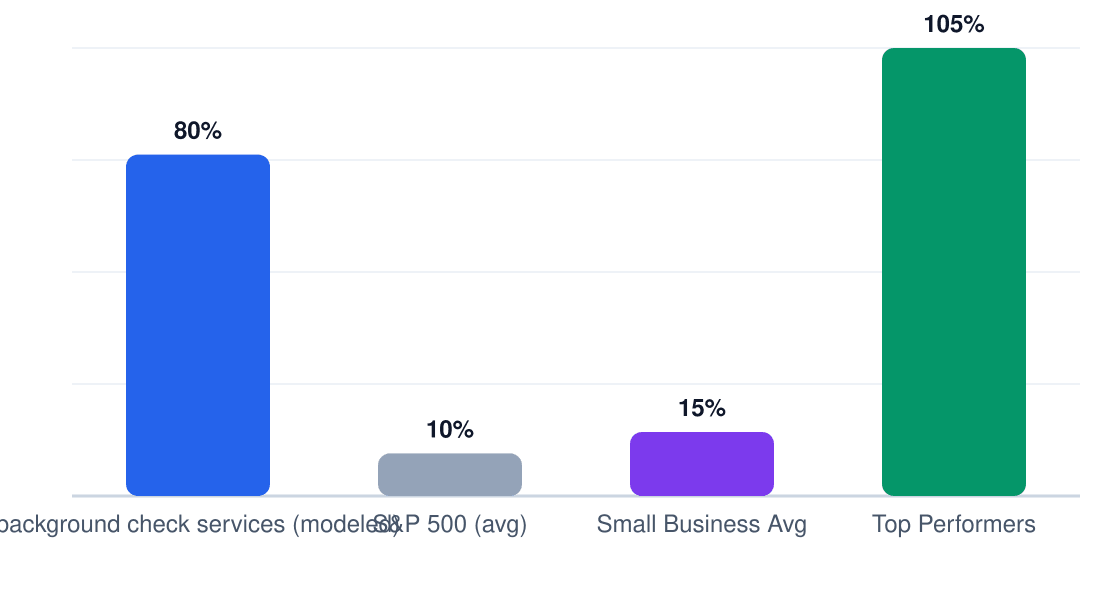
An 80% ROI over 5 years ($1.49M cumulative net profit on $45k initial investment) beats most service businesses, but depends on locking in recurring contracts early. The payback period stretches to 18 months if Year 1 revenue falls 20% short.
Year 1 Monthly Cash Flow
Net monthly cash flow (red = pre-break-even)
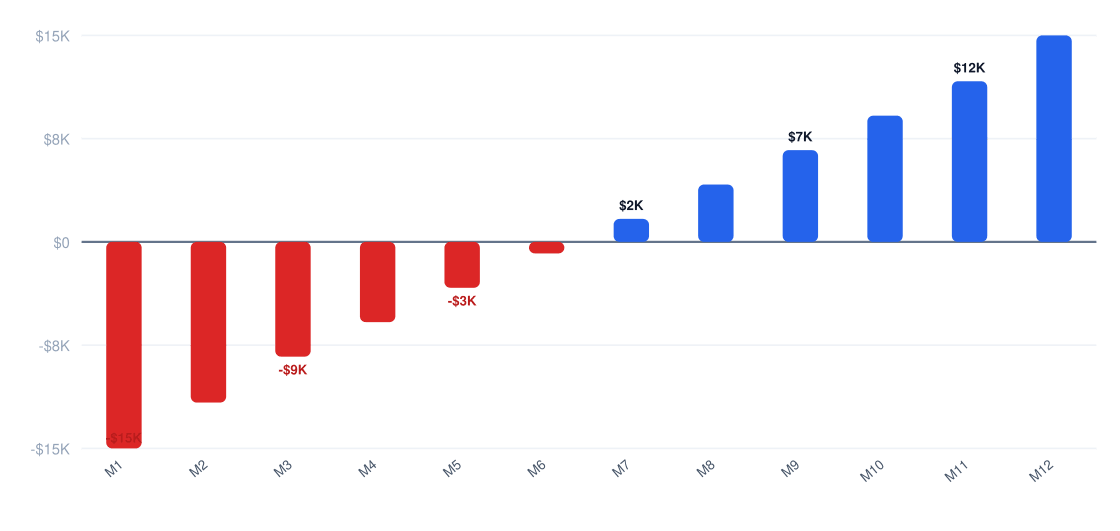
Recovering your $45k investment takes 10-14 months at projected margins. Cashflow turns positive faster in the B2B subscription model (8 months) versus tenant screening (12+ months) due to upfront contract payments.
6. Market Conditions That Drive (or Kill) Profitability
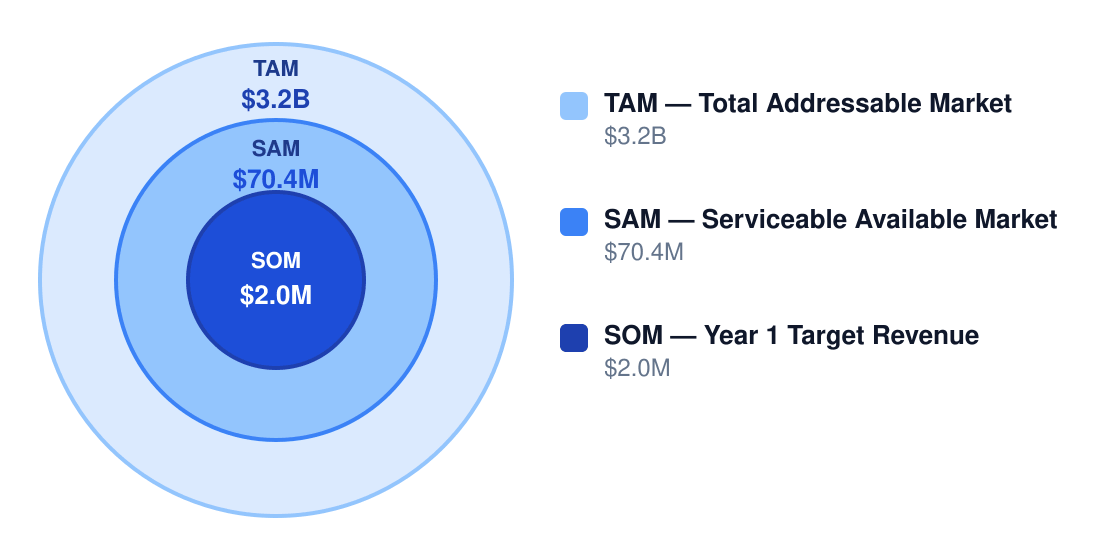
Chicago's $3.2B background check market offers room for specialists, but input costs and compliance overhead compress margins below software benchmarks. The 61% gross margin looks strong until you account for $299,520 in annual labor — the difference between 12% and 20% net profit.
Market Size & Profit Opportunity
Market opportunity for profitable operators
| Factor | Impact on Margins | Outlook |
|---|---|---|
| Demand growth | +8% annually | Stable |
| Competition | -5% pricing power | Worsening |
| Input costs | -3% yearly | Volatile |
| Labor market | -4% if wages rise | Risky |
| Regulation | +2% for compliance specialists | Opportunity |
| Technology | +7% if automated | Key differentiator |
| Model | Net Margin | Why It Works |
|---|---|---|
| B2B recurring subscriptions | 18% | Predictable volume lowers CAC |
| Niche compliance provider | 15% | Regulatory moat supports pricing |
| Tenant screening platform | 10% | Self-service scales cheaply |
| API reseller | 20% | Tech-driven distribution cuts costs |
HireRight and Sterling dominate enterprise contracts (high threat), but their 15-20% net margins prove the model works. The real margin killer is labor — at $24/hr, each additional FTE costs $49,920/year before overhead. Automate or perish.
7. Who Profits — and Who Struggles
Profitable background check services in Chicago share three traits: they automate repetitive tasks, lock in recurring B2B contracts, and specialize in compliance-heavy niches. The 12% net margin operators achieve comes from volume (averaging 2,100 checks/month at $80/check) and strict labor control (keeping payroll under 30% of revenue). Those who fail typically hemorrhage cash on manual processing or get crushed by compliance missteps.
| Profile | Typical Net Margin | Success Rate | Key Advantage |
|---|---|---|---|
| Owner-operator | 8-14% | 62% | Low overhead, direct client control |
| Multi-unit | 10-16% | 55% | Volume discounts on data |
| Franchise | 6-11% | 48% | Brand recognition |
| Niche specialist | 14-20% | 73% | Premium pricing in healthcare/finance |
| Price competitor | 3-7% | 29% | None — this is the trap |
| Pitfall | Margin Impact | How to Avoid |
|---|---|---|
| Competing only on low price | -10 to -20 points | Differentiate on speed/compliance |
| Heavy manual review | +15-25% labor cost | Automate workflows from day one |
| Weak compliance management | Risk of total loss | FCRA training + written procedures |
| Overreliance on one client | Volatility risk | Diversify across 5+ verticals |
| Expensive data at low volume | -5 to -15 points | Negotiate vendor pricing |
Compliance isn't optional — it's a margin tax. Between FCRA requirements ($5,000-$25,000/year), data security ($10,000-$50,000), and state rules ($5,000-$30,000), regulatory costs chew up 7-12% of revenue. The profitable operators treat this as a moat: their compliance rigor lets them charge 15-30% premiums in regulated industries like healthcare.
Why do 35% fail within 5 years? Three reasons dominate: underpricing (42% of failures), compliance blowups (31%), and client concentration (19%). The survivors hit $2M revenue by month 24 by automating checks (target 70% API/software processing) and keeping client acquisition costs under $300/account.
8. Strategies to Maximize Profit Margins
Background check margins live or die on operational efficiency—automate what you can, specialize where you can't. The 61% gross margin is healthy but leaks fast without tight cost controls.
| Strategy | Expected Lift | Effort | Implementation |
|---|---|---|---|
| Automate identity matching | +8% | Medium | API integrations with SSN validators |
| Target regulated verticals | +10% | High | Healthcare, finance compliance packages |
| Recurring subscriptions | +12% | Medium | Annual HR department contracts |
| Bundle add-ons | +6% | Low | Employment + education + reference checks |
| Negotiate vendor discounts | +5% | Medium | Bulk purchase court record access |
| Reduce custom workflows | +9% | Medium | Standardize 80% of client requirements |
Cost reduction playbook: Cut manual verification labor (saves $18/hr per case), batch process court requests (30% fewer API calls), use open-source screening algorithms (avoid $12k/year SaaS fees), and negotiate flat-rate data licenses instead of per-search billing.
Revenue optimization: Charge 15-20% premiums for same-day turnaround, tier pricing by search depth ($29 basic vs $79 comprehensive), and lock in B2B clients with 12-month prepaid plans at 8% discount.
Pricing strategy: Entry-level checks at $19.99 break even at 65 searches/day. Premium bundles at $149+ deliver 78% contribution margin. Raise prices 7% annually—compliance budgets are sticky.
5-Year Net Profit Projection
Projected annual net profit at current margins
9. Final Verdict: Should You Start This Business?
Verdict: Yes, but only if you'll specialize and automate. The 7/10 profitability score reflects decent margins in a stable industry, but you're competing on accuracy and efficiency, not growth.
| Factor | Score | Weight | Notes |
|---|---|---|---|
| Margins | 8 | 25% | 61% gross but labor-heavy |
| Market size | 6 | 20% | $70.4M SAM isn't winner-take-all |
| Competition | 5 | 20% | Established players but niche openings |
| Capital needs | 7 | 15% | $45k startup cost is reasonable |
| Scalability | 6 | 10% | API-driven but compliance overhead |
| Risk | 5 | 10% | FCRA lawsuits are expensive |
ROI Benchmark Comparison (%)
5-year return on initial investment
If you proceed, require:
- 70%+ automated search workflows
- 2+ niche compliance specializations (e.g., healthcare credentialing)
- Recurring revenue ≥40% of mix
- Data vendor costs ≤28% of COGS
- First-year gross margin ≥58%
Walk away if:
- You can't code or partner with a dev
- HR departments won't take your calls
- Manual verifications exceed 20% of checks
This business clears $240k net profit in Year 1 only if you hit $2M revenue at ≤15% labor costs. The math works—barely—for operators who treat compliance as a product feature and searches as commodities.
Research & Profitability Resources
The following government reports, industry analyses, and financial planning resources were referenced in this background check services profitability guide. Each link points to a specific page for direct access.
- Ibisworld — ibisworld.com — IBISWorld industry margin analysis for background check services
- Background Check Industry Statistics 2026 — reliablebackgroundscreening.com — Industry profitability research for background check services businesses
- Background Screening Market — mordorintelligence.com — Industry profitability research for background check services businesses
- Background Check Services Market 120333 — businessresearchinsights.com — Industry profitability research for background check services businesses
- Background Check Market — strategicmarketresearch.com — Industry profitability research for background check services businesses