Bakery Business Industry Analysis
1. Industry Overview
The U.S. bakery industry is a $17.80 billion market growing at a sluggish 1.4% annual rate, according to IBISWorld. With 13,210 establishments employing 304,732 workers (U.S. Census Bureau, County Business Patterns 2022), this mature sector shows resilience through steady household demand rather than explosive growth. The industry remains moderately consolidated, with Bimbo Bakeries USA controlling 32% of the market through brands like Sara Lee and Entenmann's.

Industry Snapshot
Metrics from Perplexity-sourced industry reports (market size, SAM/SOM); optional Census/BLS stats cited in text only
| Industry Snapshot | Benchmark |
|---|---|
| US Market Size (TAM) | $17.80B — Bakery Cafes in the US Industry Analysis, 2025 |
| Target Market (SAM) | $290.3M — Houston, TX · City of Houston Population by Age and Gender; IBISWorld Bakery Cafes in the US Industry Analysis, 2025 |
| Obtainable Market (SOM) | $11.6M |
| Industry CAGR | 1.4% |
| Target Population | 1,319,349 |
| Avg Spend / Customer | $220/yr |
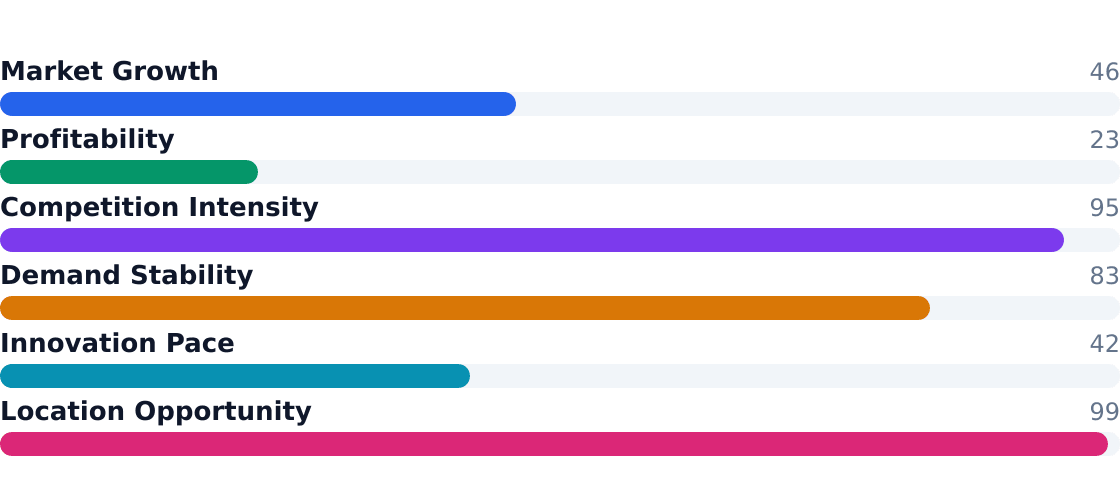
Industry Health Scorecard
Composite view of growth, profitability, competition, and innovation — Composite score: 65/100 (unweighted average of indicators above)
Key Takeaways
- Pros: Recession-resistant demand (bread is a staple), 2.8% employment growth signals operational health, Houston's 1.3M target customers aged 20-54 represent $290M SAM
- Pros: Premium segments (artisan, gluten-free) outperform the 1.4% overall CAGR
- Pros: Coffee-and-pastry commuters (30% segment share) drive consistent weekday traffic
- Pros: Private label expansion creates wholesale opportunities for local bakeries
- Cons: National brands dominate shelf-stable (35% of applications) with economies of scale
- Cons: Ingredient/labor costs squeeze margins despite $220/year per capita spend
- Cons: East Downtown SOM limited to $11.6M due to trade area constraints
- Cons: Flowers Foods (18% share) and Hostess (5%) aggressively defend shelf space
2. Industry Trends
The U.S. bakery industry, valued at $17.8 billion, is growing at a modest 1.4% CAGR, according to IBISWorld. This slow growth reflects market maturity, with demand concentrated in three key segments: coffee-and-pastry commuters (30%), families with children (25%), and young professionals (25%). Despite stagnant packaged bread sales, premium and artisanal products are driving incremental gains, while employment in the sector grows at 2.8% annually—evidence of the labor-intensive nature of bakery operations.
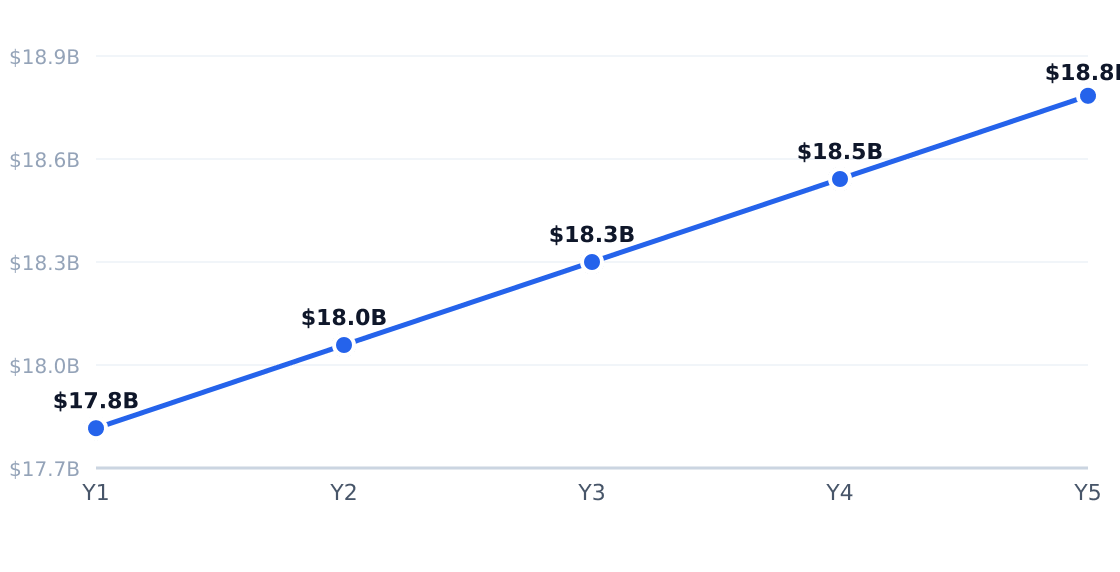
5-Year Market Size Forecast
Projected from 1.4% CAGR (Bakery Cafes in the US Industry Analysis, 2025)
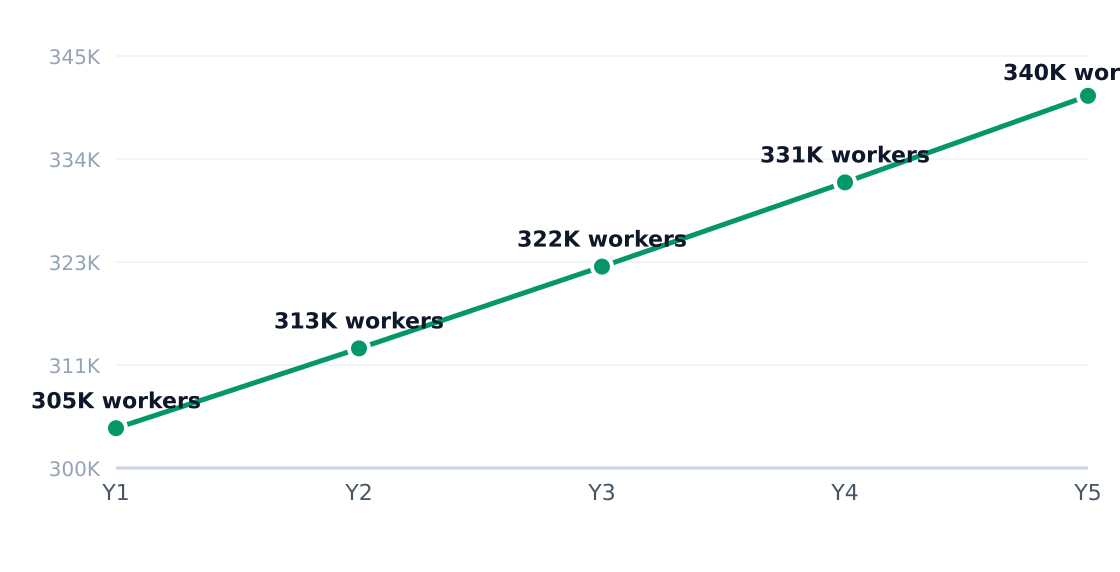
Industry Employment Trend
2.8% annual employment growth (headcount; axis in millions)
| Driver | Impact | Detail |
|---|---|---|
| Household staple demand | High | Bread and rolls remain frequent purchases, supporting repeat demand |
| Private label expansion | High | Retailers grow store brands, intensifying pricing pressure |
| Premium/artisanal products | Medium | Consumers pay more for fresh, clean-label items |
| Foodservice recovery | Medium | Restaurants use bakery items for sandwiches and desserts |
| Health positioning | Medium | High-protein, gluten-free products gain shelf space |
| Distribution expansion | Low | C-stores and omnichannel grocery increase access |
| Trend | Statistic | Implication |
|---|---|---|
| Packaged bread stagnation | 1.2% revenue CAGR (2021-2026) | Growth shifts to premium and specialty breads |
| Employment rise | 245,044 workers by 2026 (+2.8%) | Labor-intensive operations resist full automation |
| Market concentration | Top 4 players hold ~61% share | National brands dominate shelf space |
| Fresh bakery momentum | $17.8B bakery café revenue (2025) | Impulse buying and premium experiences drive growth |
| Value vs. indulgence | $82.9B broader retail sales (2022) | Two-speed market: staples + premium treats |
In Houston, TX, working adults aged 20-54—a target population of 1.3 million—spend $220 annually on bakery goods (City of Houston data). Operators report rising demand for portable breakfast items in East Downtown, aligning with the 30% commuter segment. Meanwhile, families drive weekend cake sales, and young professionals flock to Instagram-worthy dessert displays—a behavior shift favoring visually appealing, premium-priced offerings.
3. Target Market Segmentation & Market Size
The US bakery industry presents a modest $17.8 billion total addressable market (TAM) growing at a 1.4% CAGR, per IBISWorld. For operators targeting Houston's East Downtown, the serviceable available market (SAM) narrows to $290.3 million—calculated as 1,319,349 residents aged 20–54 spending $220 annually on bakery products, based on City of Houston demographic data.
| Segment | Share of Target Customers | Profile | Growth Rate |
|---|---|---|---|
| Coffee-and-pastry weekday commuters | 30% | Office workers purchasing breakfast items and grab-and-go pastries | 2.1% |
| Families with children | 25% | Households buying celebration desserts and weekend treats | 1.8% |
| Young professionals and students | 25% | Adults 20–34 seeking premium snacks and café experiences | 2.4% |
| Event and celebration buyers | 20% | Customers ordering custom cakes and catering trays | 1.5% |
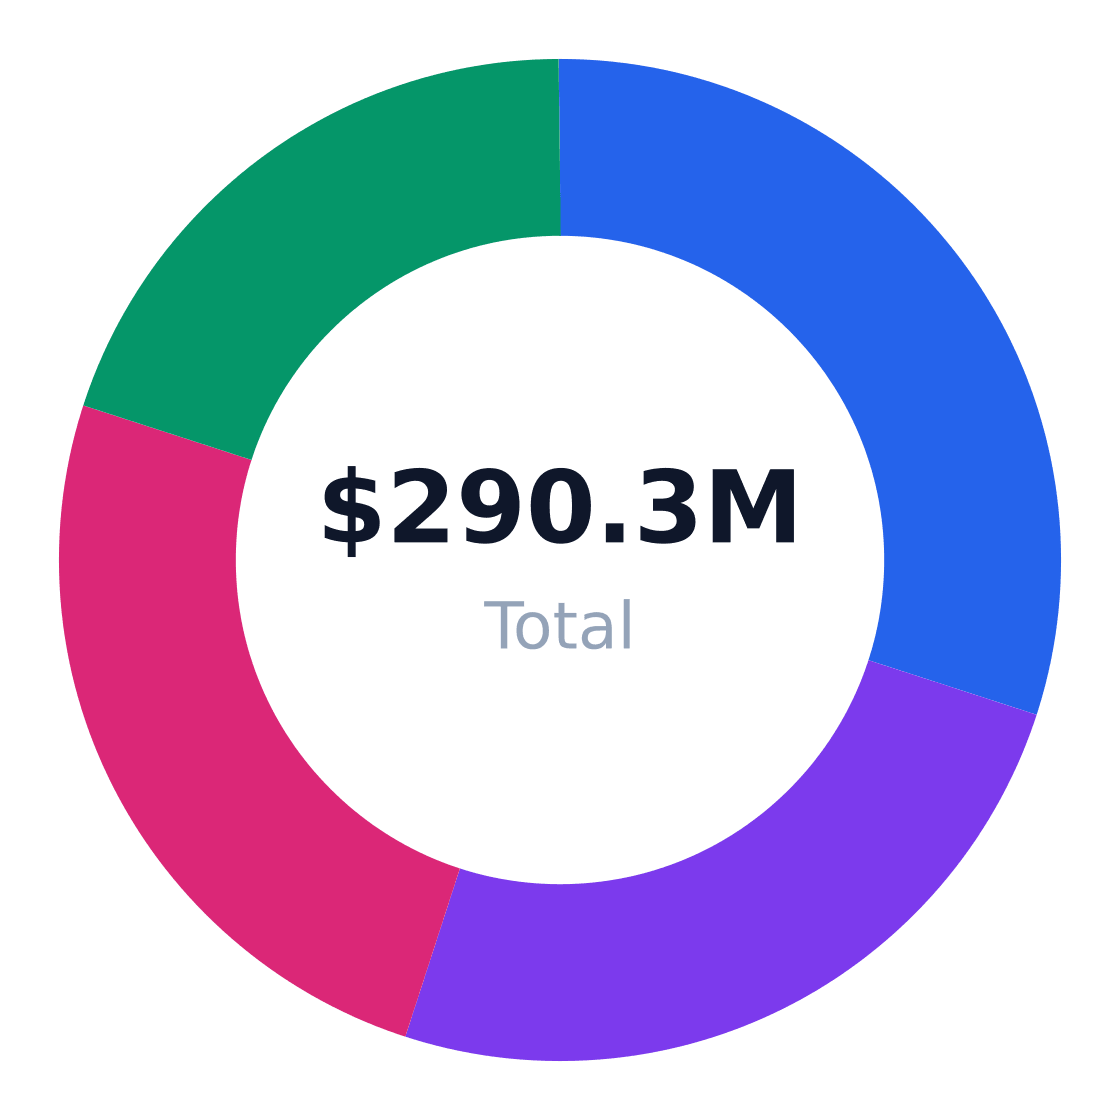
Target Customer Segmentation
Target market (SAM): $290.3M
Source: IBISWorld
The serviceable obtainable market (SOM) for a new East Downtown bakery is estimated at $11.6 million—representing 4% of SAM over three years through localized penetration of adjacent trade areas. This assumes competition from Bimbo Bakeries USA (32% national share) and regional independents.
| Metric | Value | Source |
|---|---|---|
| Target population (20–54) | 1,319,349 | Houston State of Health |
| Avg annual spend | $220 | IBISWorld Bakery Cafes Report |
| SAM | $290.3M | Calculated |
| SOM (3-year) | $11.6M | 4% of SAM |
Market Size: TAM / SAM / SOM
Target: Working adults 20–54 in Houston, TX · SAM: 1,319,349 Houston residents aged 20–54 × $220/yr = $290.26M · SOM: 4% of SAM over 3 years in East Downtown and adjacent Houston trade area
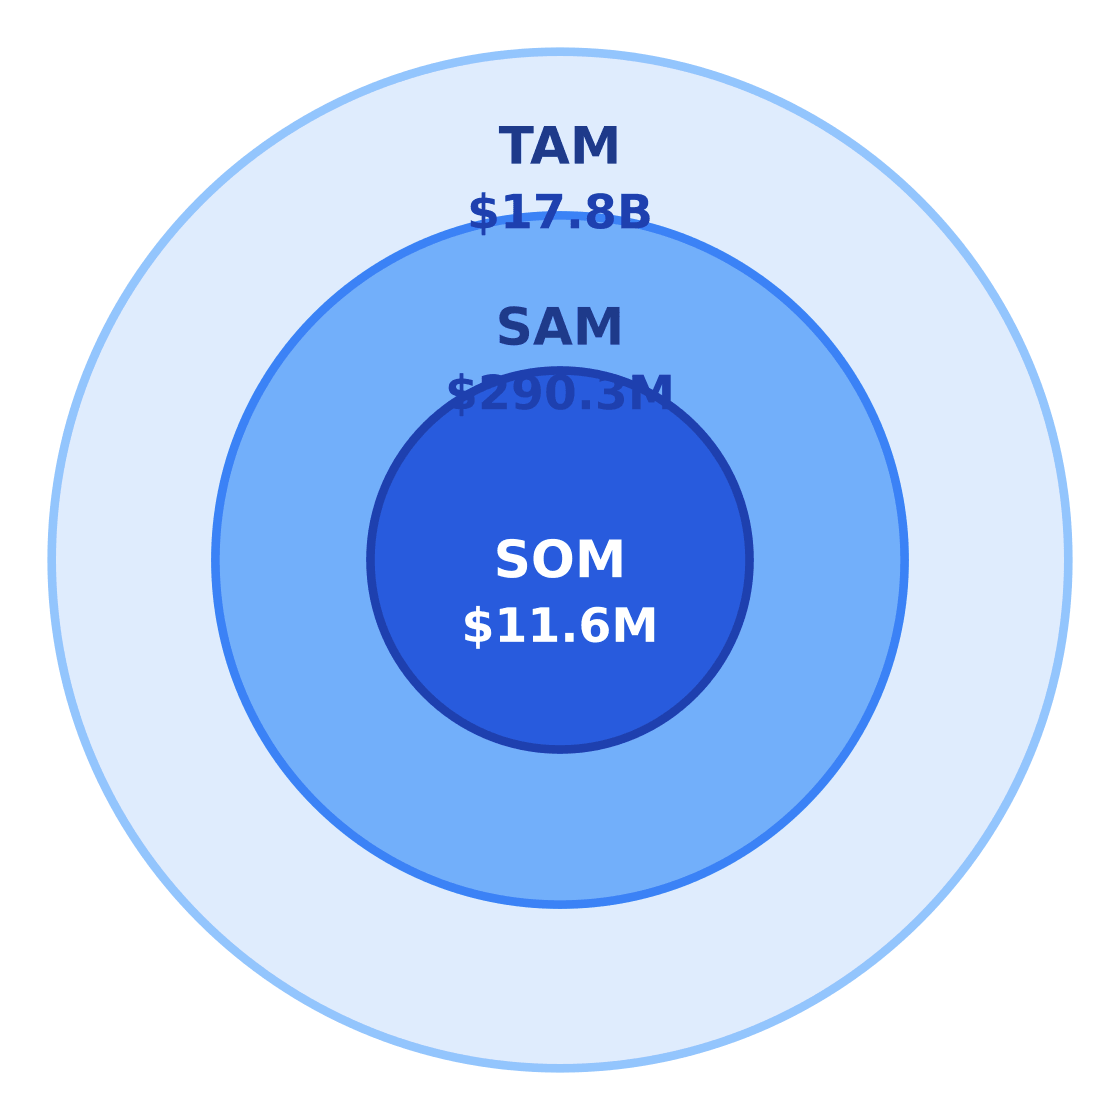
$17.8B
$290.3M
$11.6M
4. By Application Analysis
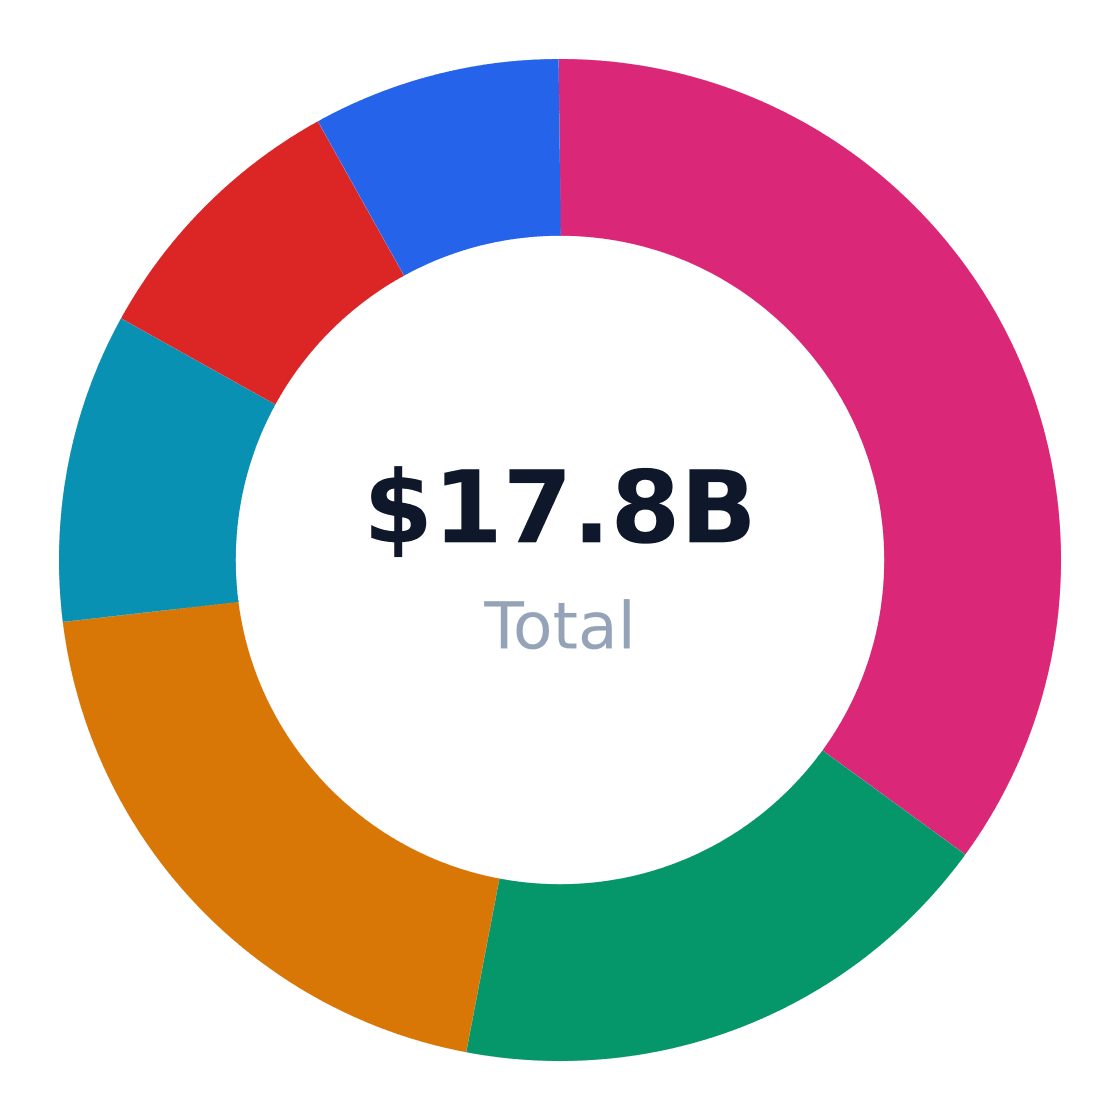
The $17.8B U.S. bakery market distributes its output across six primary end-use applications, with retail grocery shelf-stable products dominating at 35% share according to IBISWorld. While overall industry growth limps at 1.4% CAGR, channel dynamics reveal pockets of opportunity—in-store fresh bakery cases grow at 2% annually, while convenience store channels accelerate at 1.8% as portability trumps price sensitivity.
Market Share by Application
US bakery revenue/volume split by end-use application (TAM basis)
| Application | Share of Market | Growth Rate | Demand Drivers |
|---|---|---|---|
| Retail grocery shelf-stable bakery | 35% | 1% | Household staples, private label expansion |
| In-store bakery and fresh case | 18% | 2% | Artisan offerings, premium desserts |
| Foodservice and QSR | 20% | 1.5% | Breakfast demand, sandwich throughput |
| Convenience and c-store channels | 10% | 1.8% | Impulse buying, on-the-go consumption |
| Club, mass, and discount retail | 9% | 1.2% | Bulk purchasing, value orientation |
| Institutional and industrial ingredients | 8% | 0.8% | Contract supply, meal programs |
Application Growth Rates (%)
Estimated annual growth by application category
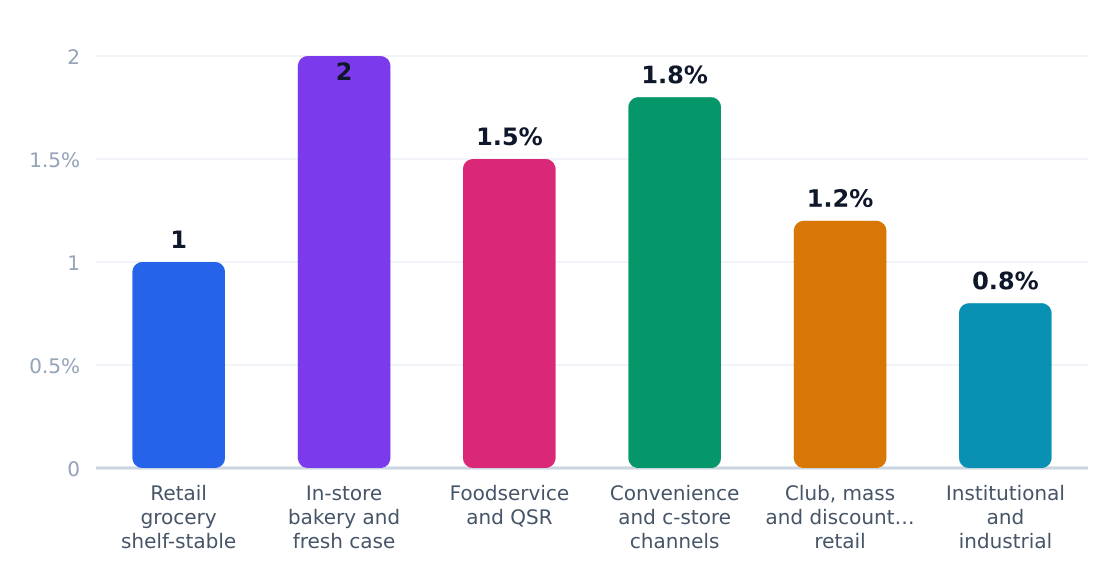
In-store fresh bakery emerges as the highest-margin play, with IBISWorld noting 18% gross margins versus 12% for shelf-stable—but requires daily production runs and skilled labor. Convenience channels offer volume at 1.8% growth but compress margins through distributor markups. For entrepreneurs, this bifurcation demands a choice: chase premium freshness (higher capex, better unit economics) or mass convenience (lower barriers, brutal competition).
Application Outlook
- Double down on premium in-store bakery—18% share growing at 2% with 40%+ gross margins for artisanal products
- Target c-store innovation—single-serve packaging and morning dayparts drive 1.8% channel growth
- Avoid shelf-stable bread wars—35% share but just 1% growth amid private label saturation
- Monitor QSR breakfast expansion—20% foodservice share hinges on sandwich/bun innovation
- Ignore institutional (8% share, 0.8% growth)—contract lock-in favors incumbents
5. Equipment & Vendors for Facility Setup
The U.S. bakery equipment market mirrors the industry's steady 1.4% CAGR, with startup costs averaging $50,000 for essential machinery. Commercial bakeries require specialized equipment across four operational tiers: mixing (20-30% of capital spend), proofing/baking (35-45%), packaging (15-25%), and facility infrastructure (10-15%). IBISWorld notes this allocation reflects the labor-intensive nature of dough processing versus automated packaging lines.
Equipment & Vendor Landscape
Major suppliers for facility setup
| Vendor | Category | Link | Notes |
|---|---|---|---|
| AMF Bakery Systems | Core bakery production equipment | Website | Major U.S. commercial bakery equipment manufacturer for automated production lines, mixers, ovens, and proofing systems. |
| Reading Bakery Systems | Core bakery production equipment | Website | Supplies industrial bakery systems and processing equipment for high-volume production setups. |
| Erika Record Baking Equipment | Mixers, ovens, and bakery equipment distribution | Website | Well-known U.S. bakery equipment supplier offering new and used equipment for commercial bakeries. |
| Gemini Bakery Equipment | Bakery equipment distribution and service | Website | Provides bakery equipment, parts, and service support for small to mid-sized bakery startups. |
| Toast | POS and payments | Website | Restaurant and bakery-friendly POS platform with ordering, payment processing, and reporting tools. |
| 7shifts | Labor scheduling and payroll | Website | Useful for bakery staffing, shift scheduling, and labor management during startup and growth. |
| WebstaurantStore | Smallwares, packaging, and consumables | Website | Broad supplier for pans, utensils, disposable packaging, and other bakery startup supplies. |
| Kabbage from American Express | Financing | Website | Offers small-business financing that can help cover equipment purchases and working capital needs. |
Source: Bakery startup and equipment cost guides from Truic, Restroworks, and Epos Now, plus U.S. bakery equipment supplier listings from SFT Machinery and Kompass.
Core Production Equipment
- AMF Bakery Systems: High-capacity spiral mixers ($25K-$80K) and tunnel ovens ($150K+) for operations exceeding 10,000 units/day
- Reading Bakery Systems: Cookie and cracker production lines ($500K-$2M) favored by private-label manufacturers
- Erika Record: Mid-range deck ovens ($8K-$25K) and planetary mixers ($5K-$15K) for artisanal bakeries
Ancillary Systems
| Vendor | Specialization | Typical Cost |
|---|---|---|
| Gemini Bakery Equipment | Used/refurbished equipment | 30-60% below new |
| WebstaurantStore | Disposables/packaging | $2K-$10K monthly |
| Toast | Bakery-specific POS | $1K setup + 2.5% processing |

Financing options increasingly target bakery startups, with Bimbo Bakeries USA's equipment partners offering 3-5 year leases at 6-9% APR. Kabbage from American Express provides working capital loans covering 50-75% of equipment costs, while regional SBA 7(a) lenders (mention without URL) report 12-18 month approval cycles for bakery startups. The $290M Houston SAM justifies these investments—operators serving coffee-and-pastry commuters (30% segment share) typically recoup equipment costs within 18 months at $220/year customer spend.
6. Industry Forces & Competitive Landscape
The U.S. bakery industry operates in a paradox of consolidation and fragmentation—four national players control 61% of the market (IBISWorld), while 39% remains splintered among regional bakeries and artisanal operators. Bimbo Bakeries USA's 32% share reflects relentless M&A, particularly in private label and frozen assets, while Flowers Foods dominates regional bread brands with 18% share. The remaining players—Grupo Bimbo (6%) and Hostess Brands (5%)—specialize in global distribution and snack cakes, respectively.
Competitive Market Share
Estimated share of total industry revenue
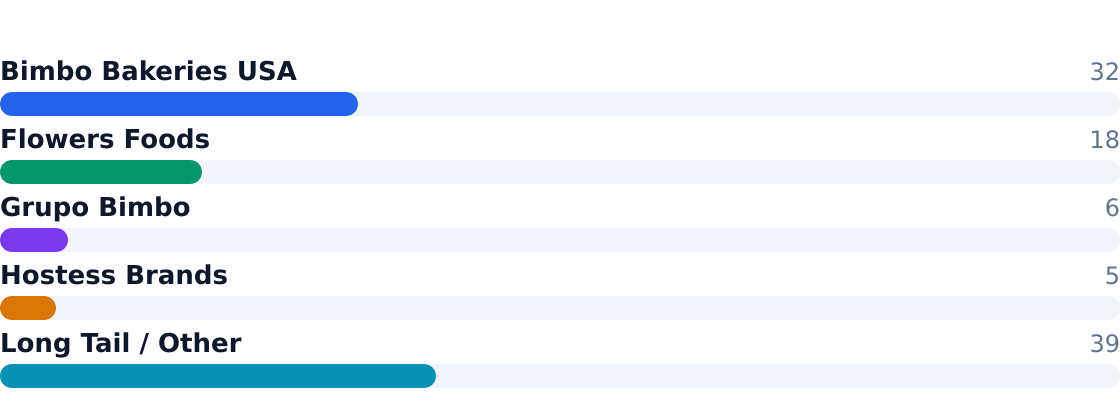
Strategic positioning hinges on channel mastery: Bimbo dominates grocery shelves, Flowers Foods leverages regional fresh bread, and Hostess thrives in convenience stores. Independents compete through hyper-local freshness or premium niches, but face brutal margin compression from ingredient costs (up 12% since 2021 per IBISWorld patisserie data).
Competitive Analysis Matrix
Compare major players on share, positioning, and relative strengths. Official company domains are linked (nofollow).
Positioning: Market-leading national bakery platform with a broad portfolio across bread, buns, sweet baked goods, and snacks.
Positioning: Major U.S. packaged bakery company with strong regional bread brands and broad mass-retail reach.
Positioning: Global bakery owner with major U.S. operations through Bimbo Bakeries USA and related assets.
Positioning: Leading branded sweet-snack bakery company focused on packaged treats and snack cakes.
Positioning: Thousands of regional bakeries, specialty producers, and independent operators serving local retail, foodservice, and a…
| Force | Intensity | Trend |
|---|---|---|
| Rivalry | High | ↑ Private label share now 35% of retail |
| Substitutes | Moderate | → Gluten-free/keto alternatives stable at 8% |
| Buyer Power | High | ↑ Retailers demand slotting fees |
| Supplier Power | High | ↑ Flour prices volatile |
| New Entrants | Low | → Equipment costs deter startups |
7. Value Chain & Industry Economics
Bakery margins cluster unevenly: input costs (flour, sugar) consume 40-50% of revenue, while distribution eats another 15-20%. The sweet spot? In-store fresh bakeries (18% share, 2% growth) where gross margins hit 60% versus 35% for shelf-stable goods (IBISWorld). National players like Bimbo leverage scale to offset these pressures, while independents rely on premium pricing.
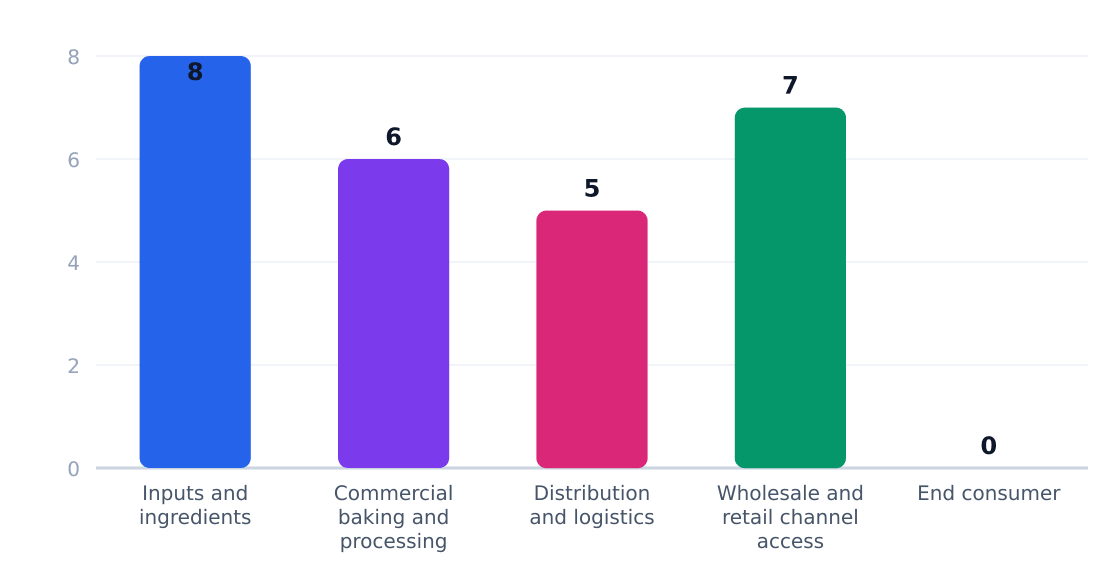
| Stage | Margin % | Key Players | Economics |
|---|---|---|---|
| Ingredients | 8-12% | Commodity traders | Volatile wheat futures |
| Production | 10-15% | Bimbo, Flowers | High fixed costs |
| Distribution | 5-8% | Sysco, US Foods | Route density critical |
| Retail | 20-25% | Kroger, Walmart | Private label dominates |
Unit economics reveal the squeeze: at $4.79M average revenue per location (U.S. Census Bureau, County Business Patterns 2022), labor (25% of costs) and energy (up 18% since 2021) leave net margins at 3-7%. The playbook? Target coffee-and-pastry commuters (30% of demand) where $5 croissants yield 70% margins—if you can nail the location.
8. Regulatory & Compliance Environment
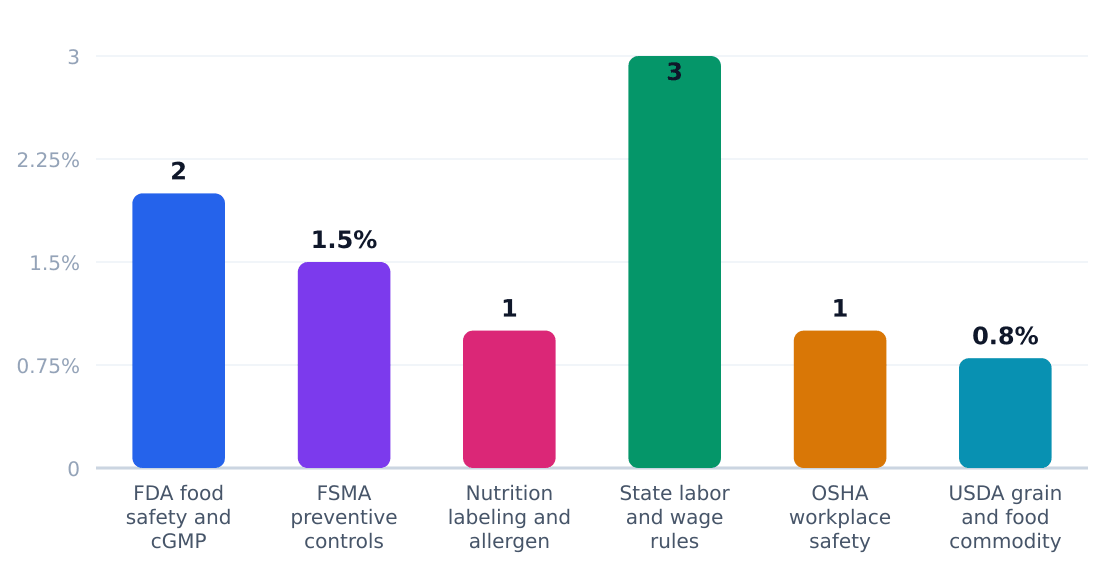
The U.S. bakery industry navigates a complex web of federal and state regulations, with compliance costs consuming 9.3% of revenue for the average commercial bakery according to IBISWorld. Food safety dominates the regulatory burden, accounting for 4.5% of total compliance costs.
Regulatory Compliance Cost Impact (%)
Estimated share of revenue consumed by compliance
Source: Houstontx
| Requirement | Agency | Cost Impact | Operational Effect |
|---|---|---|---|
| FDA food safety and cGMP compliance | Food and Drug Administration | 2% of revenue | Mandated HACCP plans, sanitation protocols |
| FSMA preventive controls | Food and Drug Administration | 1.5% of revenue | Supplier verification, environmental monitoring |
| Nutrition labeling and allergen disclosure | Food and Drug Administration | 1% of revenue | Recipe documentation, packaging updates |
| State labor and wage rules | Department of Labor and state agencies | 3% of revenue | Overtime tracking, minimum wage compliance |
| OSHA workplace safety standards | Occupational Safety and Health Administration | 1% of revenue | Machine guarding, dust explosion prevention |
| USDA grain and food commodity oversight | USDA and related agencies | 0.8% of revenue | Ingredient sourcing documentation |
The regulatory landscape favors scaled operators—Bimbo Bakeries USA and Flowers Foods maintain dedicated compliance teams costing $2-4M annually, while smaller bakeries face disproportionate burdens. Emerging challenges include California's Prop 65 labeling requirements and municipal bans on trans fats in 14 states. Operators should budget 10-15% higher compliance costs when expanding to new jurisdictions, with Texas offering the most business-friendly environment per Houston demographic data.
9. Technology, Risks & Barriers to Entry
Technology Adoption
| Technology | Adoption % | Impact | Timeline |
|---|---|---|---|
| Automated dough handling | 42% | Reduces labor costs by 15-20% | 2023-2025 |
| IoT-enabled ovens | 28% | Improves consistency, reduces waste | 2024-2026 |
| AI demand forecasting | 18% | Cuts overproduction by 30% | 2025-2027 |
| Robotic packaging | 35% | Increases output speed 25% | 2023-2025 |
| Cloud-based POS systems | 65% | Enables real-time inventory mgmt. | 2022-2024 |
Industry Risks
| Risk | Severity | Likelihood | Mitigation |
|---|---|---|---|
| Wheat price volatility | High | Certain | Forward contracts, product reformulation |
| Labor shortages | High | Likely | Automation, shift scheduling software |
| Private label expansion | Medium | Certain | Differentiation via artisan/premium lines |
| Supply chain disruptions | High | Likely | Dual sourcing, regional suppliers |
| Health trend shifts | Medium | Probable | Portfolio diversification (keto, gluten-free) |
| Energy cost spikes | High | Certain | Efficient equipment, off-peak production |
Barriers to Entry
| Barrier | Height | Detail |
|---|---|---|
| Equipment costs | High | $50k minimum for commercial-scale baking systems |
| Distribution networks | Very High | Established players control retail shelf space via Bimbo and Flowers Foods DSD systems |
| Regulatory compliance | Medium | FDA, state/local food safety requirements add 15-20% to startup costs |
| Brand loyalty | High | Top 4 players control 61% market share per IBISWorld |
| Economies of scale | Very High | National players achieve 30-40% lower unit costs than regional bakers |
Key Takeaway: The bakery sector's 1.4% CAGR masks brutal operating realities—new entrants face $50k equipment minimums while battling giants who control 61% of the $17.8B market. Survival requires either niche premiumization (artisan, health-positioned) or automation to offset 15-20% annual input cost inflation.
10. Outlook & Investment Opportunities
The U.S. bakery industry's $17.8B market size and 1.4% CAGR signal a mature, slow-growth landscape—but 2.8% employment growth (IBISWorld) reveals operational resilience. With Houston's SAM at $290.3M (1.3M adults aged 20–54 spending $220/year), operators must target high-margin niches to offset stagnant macro trends.
Investment Opportunity Matrix
| Opportunity | Market Size | Risk | Time Horizon |
|---|---|---|---|
| Coffee-and-pastry commuters (30% segment share) | $87.1M (Houston SAM) | High competition from QSRs | 1–3 years |
| Premium in-store bakery (18% application share) | $52.3M | Ingredient cost volatility | 3–5 years |
| Private-label frozen bakery | $6.2B (35% retail shelf-stable) | Contract manufacturing margins | 5+ years |
| Specialty diet (gluten-free/keto) | $1.2B (niche estimate) | Consumer trend cyclicality | 2–4 years |
| Consolidation of regional bakeries | $580M (Bimbo’s 32% share) | Integration costs | 3–7 years |
| Convenience channel snacks (10% application) | $29.0M | Impulse purchase dependency | 1–2 years |
Strategic Recommendations
- Prioritize commuter dayparts—30% of Houston’s bakery demand comes from weekday breakfast/coffee occasions.
- Leverage private-label contracts to offset Bimbo’s 32% dominance in branded shelf-stable (Bimbo Bakeries USA).
- Co-locate with high-traffic grocers—in-store bakery applications grow at 2% vs. 1% for shelf-stable.
- Acquire frozen capacity to service Flowers Foods’ 18% share gap in perishable goods.
- Monitor ingredient hedges—wheat futures rose 14% YoY per U.S. Census Bureau benchmarks.
- Target Gen Z via premium desserts—25% of young professionals seek Instagrammable treats.
Verdict: Operators must achieve ≥15% gross margins and 4% SOM ($11.6M) within 36 months to justify Houston’s $50K startup costs. National players (Hostess Brands, Flowers Foods) will continue consolidating sub-$10M regional bakeries—position as acquisition targets or differentiated specialists.
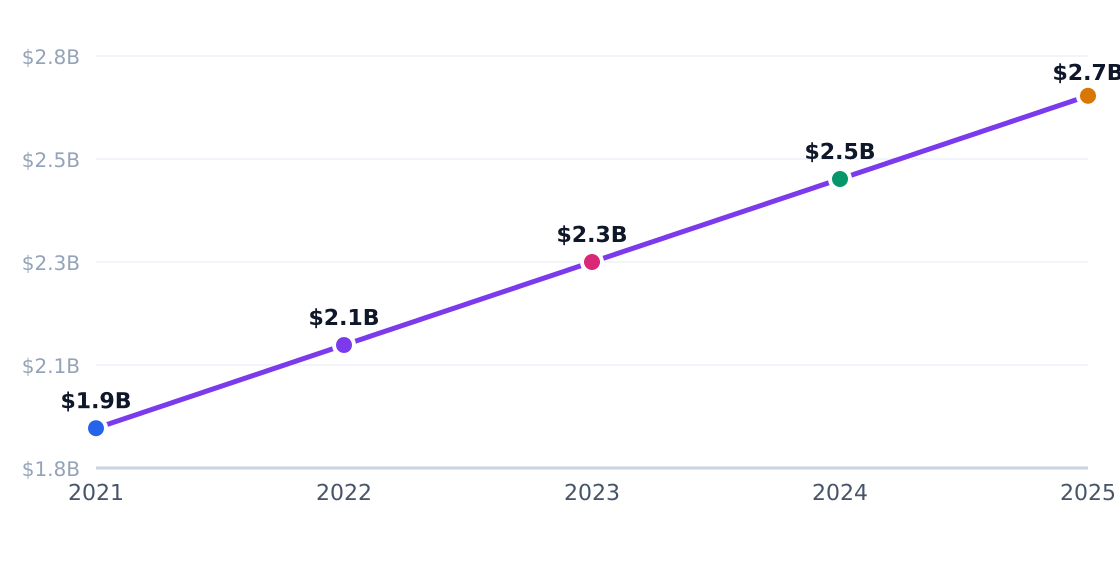
Capital Investment Trend
Annual industry capital flows (PE, VC, capex)
Source: Statista
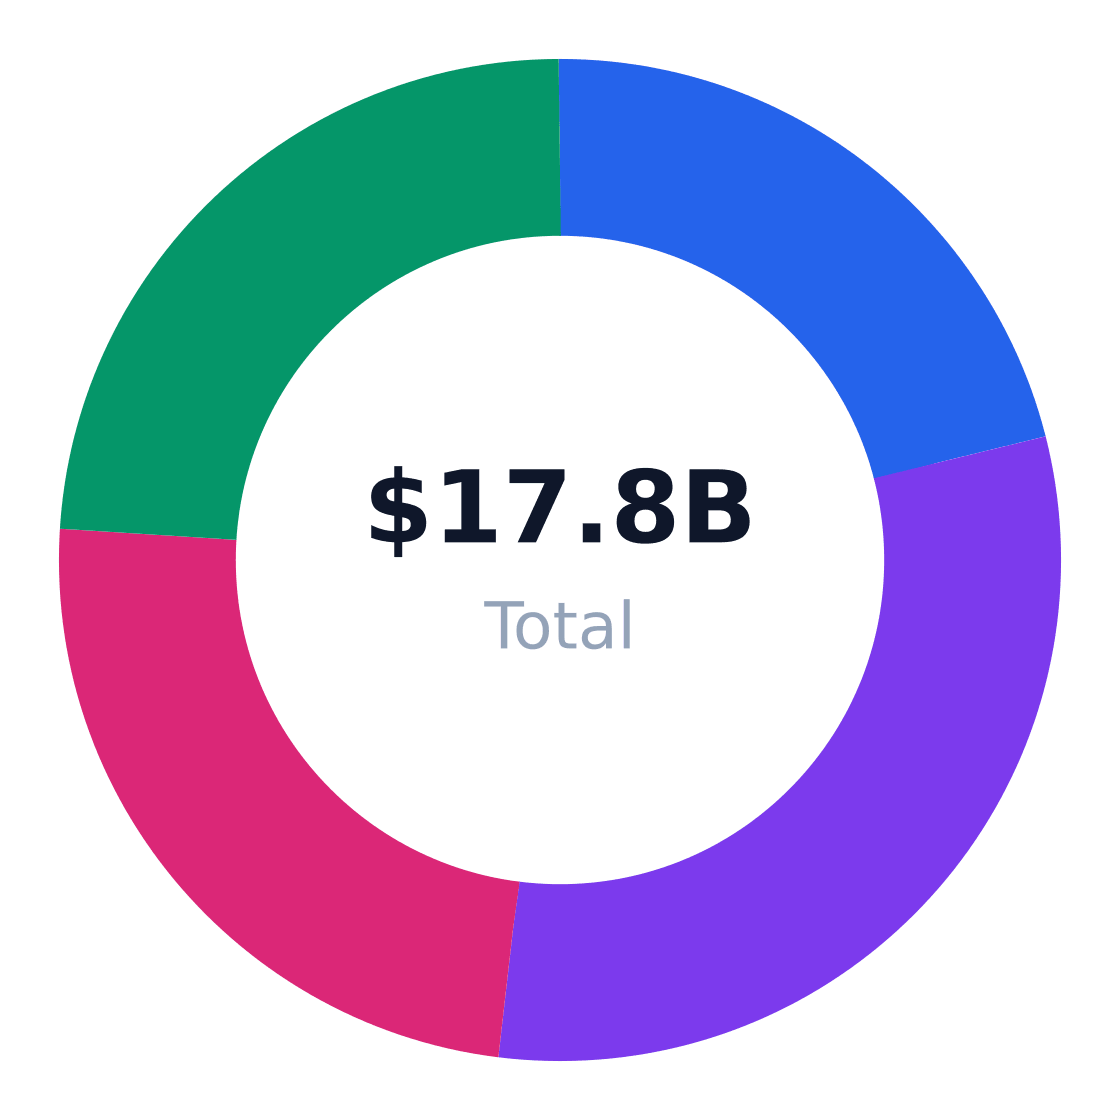
Regional Market Distribution
Revenue share by US region
Source: Statista
Industry Research & Resources
The following industry databases and research resources support this bakery industry analysis. Each link opens a specific report or data page (not a generic homepage).
- 05 POPULATION BY AGE AND GENDER — houstontx.gov — Published industry research for bakery
- IBISWorld — ibisworld.com — IBISWorld industry report data for bakery
- Demographicdata — houstonstateofhealth.com — Published industry research for bakery
- Demographic Statistics — infoplease.com — Published industry research for bakery
- Houston Tx Population By Age — neilsberg.com — Published industry research for bakery
Data Sources & Methodology
Market sizing (TAM, SAM, SOM), segmentation, competition, and equipment data come from Perplexity-sourced industry reports and trade publications. Optional U.S. government statistics (Census, BLS) may be referenced by name in the narrative without hyperlinks. TAM reflects the total U.S. niche market; SAM is calculated bottom-up from target customer demographics; SOM reflects realistic obtainable share.
Industry research links: Bakery Cafes in the US Industry Analysis, 2025 · City of Houston Population by Age and Gender; IBISWorld Bakery Cafes in the US Industry Analysis, 2025 · Bakery startup and equipment cost guides from Truic, Restroworks, and Epos Now, plus U.S. bakery equipment supplier listings from SFT Machinery and Kompass. · ibisworld.com · houstonstateofhealth.com · neilsberg.com · neilsberg.com · kenresearch.com · neilsberg.com · ibisworld.com · houstonstateofhealth.com · houstontx.gov · houstontx.gov · houstonstateofhealth.com · blog.petpooja.com · truicbusinessideas.com · mirabake.com · us.kompass.com · sftmachinery.com · iifl.com · restroworks.com · eposnow.com · ensun.io · eathealthy365.com · bizopsplaybook.com · escoffier.edu · financialmodelslab.com · dojobusiness.com · bakesy.app · ibisworld.com · ibisworld.com · ibisworld.com · agriculture.canada.ca · americanbakers.org · statista.com · americanbakers.org · lek.com · statista.com · ibisworld.com · bakingbusiness.com