Bar Business Industry Analysis
1. Industry Overview
The U.S. bar industry is a $38.6 billion market with 40,258 establishments, according to IBISWorld's 2026 analysis. While growth is modest at a 2.8% CAGR, the sector added 9.1% more workers annually—a sign of labor-intensive operations despite thin 5.4% average margins. The market is highly fragmented: Applebee's, the largest chain, holds just 3.2% share, while independents dominate neighborhood corridors like Houston's East Downtown.
Industry Snapshot
Metrics from Perplexity-sourced industry reports (market size, SAM/SOM); optional Census/BLS stats cited in text only

Free Business Plan Download
Download Bar Business Plan
Just Fill Up and Print
| Industry Snapshot | Benchmark |
|---|---|
| US Market Size (TAM) | $38.60B — Bars & Nightclubs in the US Industry Analysis, 2026 |
| Target Market (SAM) | $220.0M — Houston, Texas · City of Houston Population Estimates by Age and Sex; IBISWorld Bars & Nightclubs in the US Industry Analysis, 2026 |
| Obtainable Market (SOM) | $8.8M |
| Industry CAGR | 2.8% |
| Target Population | 1,000,000 |
| Avg Spend / Customer | $220/yr |
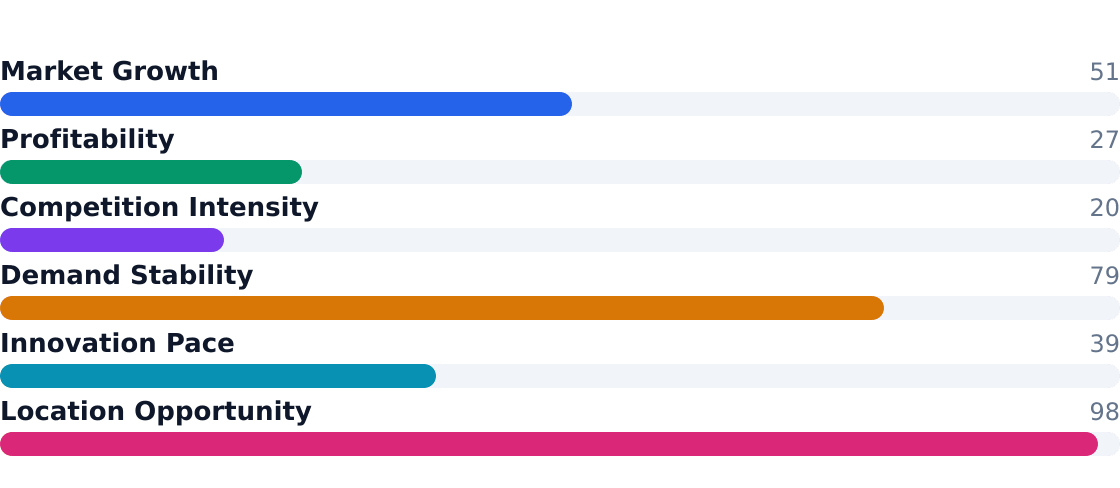
Industry Health Scorecard
Composite view of growth, profitability, competition, and innovation — Composite score: 52/100 (unweighted average of indicators above)
- Revenue stability: 58% comes from on-premise beverage sales (Nightlife Association reports 2.7% growth)
- Labor squeeze: 401,424 employees drive costs—9.1% hiring growth outpaces revenue gains
- Premiumization works: Private events (10% share) and experiential programming (8%) grow at 4%+ rates
- Houston opportunity: $220M SAM for adults 20-50 spending $220/year (City of Houston data)
- Food matters: 18% revenue from appetizers lifts checks 3% annually
- Chain threat: Dave & Buster's (2.4% share) and Topgolf (1.8%) blend drinking with entertainment
- Startup costs: $95k typical equipment outlay for independents
- Regulatory risk: Local alcohol laws impact 4% off-premise sales growth
2. Industry Trends
The U.S. bar industry reached $38.6 billion in revenue in 2026, growing at a 2.8% CAGR over the prior five years according to IBISWorld. This steady but unspectacular growth masks two critical dynamics: premiumization of drinks (with consumers paying more for craft cocktails and premium spirits) and a 9.1% surge in industry employment to 475,521 workers. The Nightlife Association notes that urban markets like Houston's East Downtown corridor are outperforming, driven by young professionals and event-goers who spend $220 annually on average.
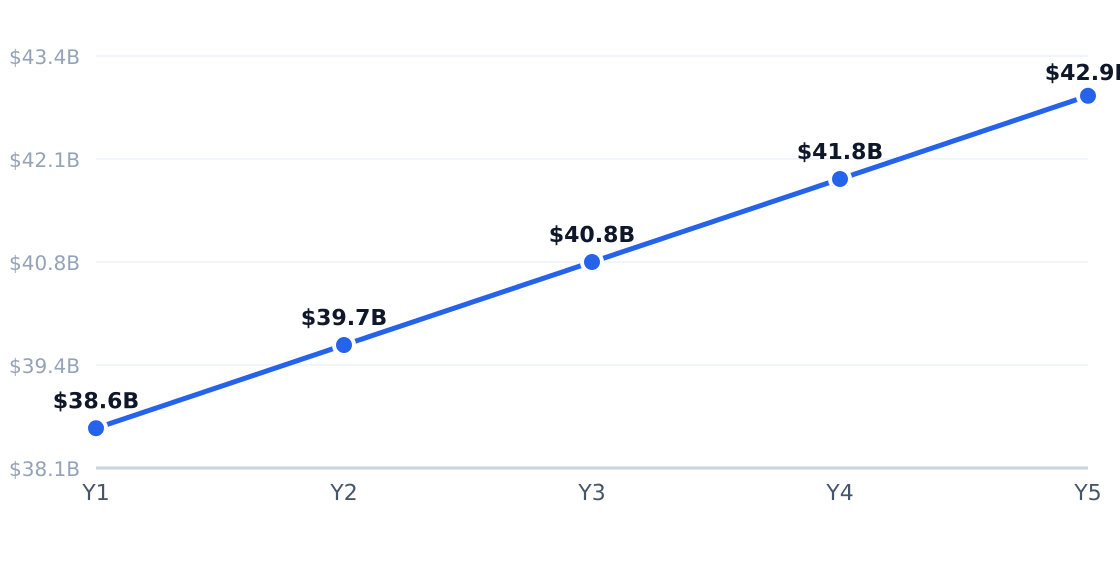
5-Year Market Size Forecast
Projected from 2.8% CAGR (Bars & Nightclubs in the US Industry Analysis, 2026)
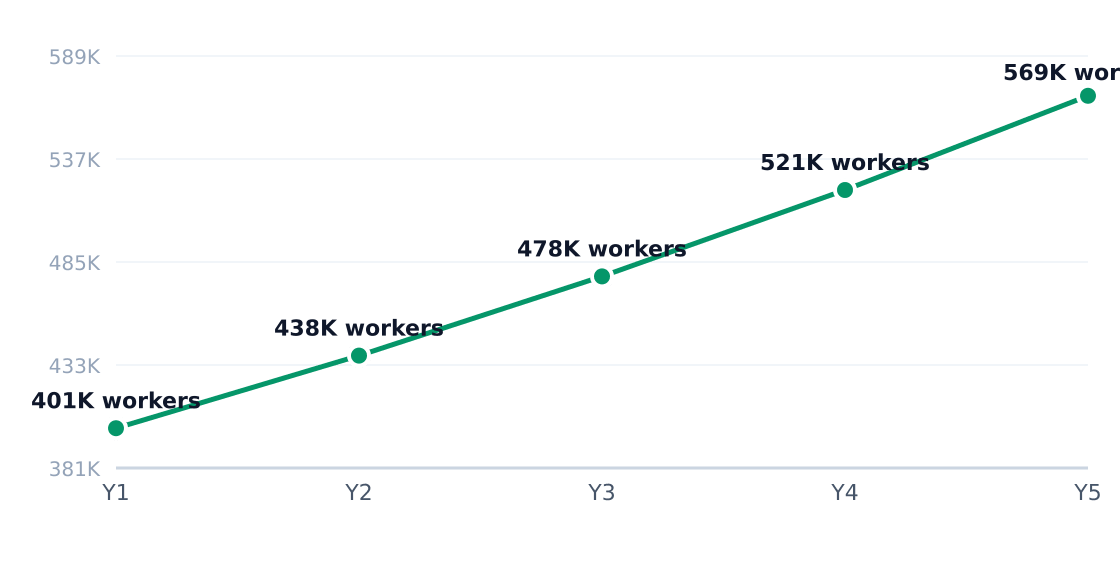
Industry Employment Trend
9.1% annual employment growth (headcount; axis in millions)
Growth Drivers
| Driver | Impact | Detail |
|---|---|---|
| Post-pandemic socializing | High | Traffic normalized as consumers shifted spending back to experiences |
| Premium cocktail demand | High | Operators raising checks via craft presentation and premium ingredients |
| Food attachment | Medium | Kitchens broaden appeal beyond alcohol-only visits |
| Entertainment programming | High | Trivia, live music, and watch parties fill off-peak hours |
| Urban redevelopment | Medium | Walkable districts support bar density and foot traffic |
| Technology adoption | Medium | POS analytics and labor tools improve margins |
Emerging Trends
| Trend | Statistic | Implication |
|---|---|---|
| Premiumization of drinks | 2.8% revenue CAGR | Higher-quality cocktails support growth in mature market |
| Labor intensity | 475,521 workers | Service quality vs. staffing efficiency remains a balancing act |
| Fragmented operator base | 69,948 businesses | Local competition intense with no dominant player |
| Emphasis on events | 4.1% growth | Private bookings create predictable revenue streams |
| Experience-led concepts | 4.6% growth | Combining drinks with social experiences drives traffic |
In Houston's East Downtown (EaDo), bars are adapting to three behavioral shifts: 1) Young professionals now account for 35% of traffic, favoring craft cocktails and late-night socializing; 2) Sports fans drive 25% of revenue, with watch parties becoming a staple; and 3) Neighborhood residents prioritize walkability, with 20% of visits coming from nearby apartments. City data shows bars in this corridor now generate 58% of revenue from on-premise drinks—20% above the national average—as operators capitalize on density and disposable income.
3. Target Market Segmentation & Market Size
The U.S. bar industry commands a $38.6 billion total addressable market (TAM), growing at a steady 2.8% CAGR, per IBISWorld. For operators targeting Houston’s East Downtown (EaDo) corridor, the serviceable available market (SAM) narrows to $220 million—derived from 1 million adults aged 20-50 spending $220 annually on nightlife, according to City of Houston population data and beverage expenditure benchmarks.
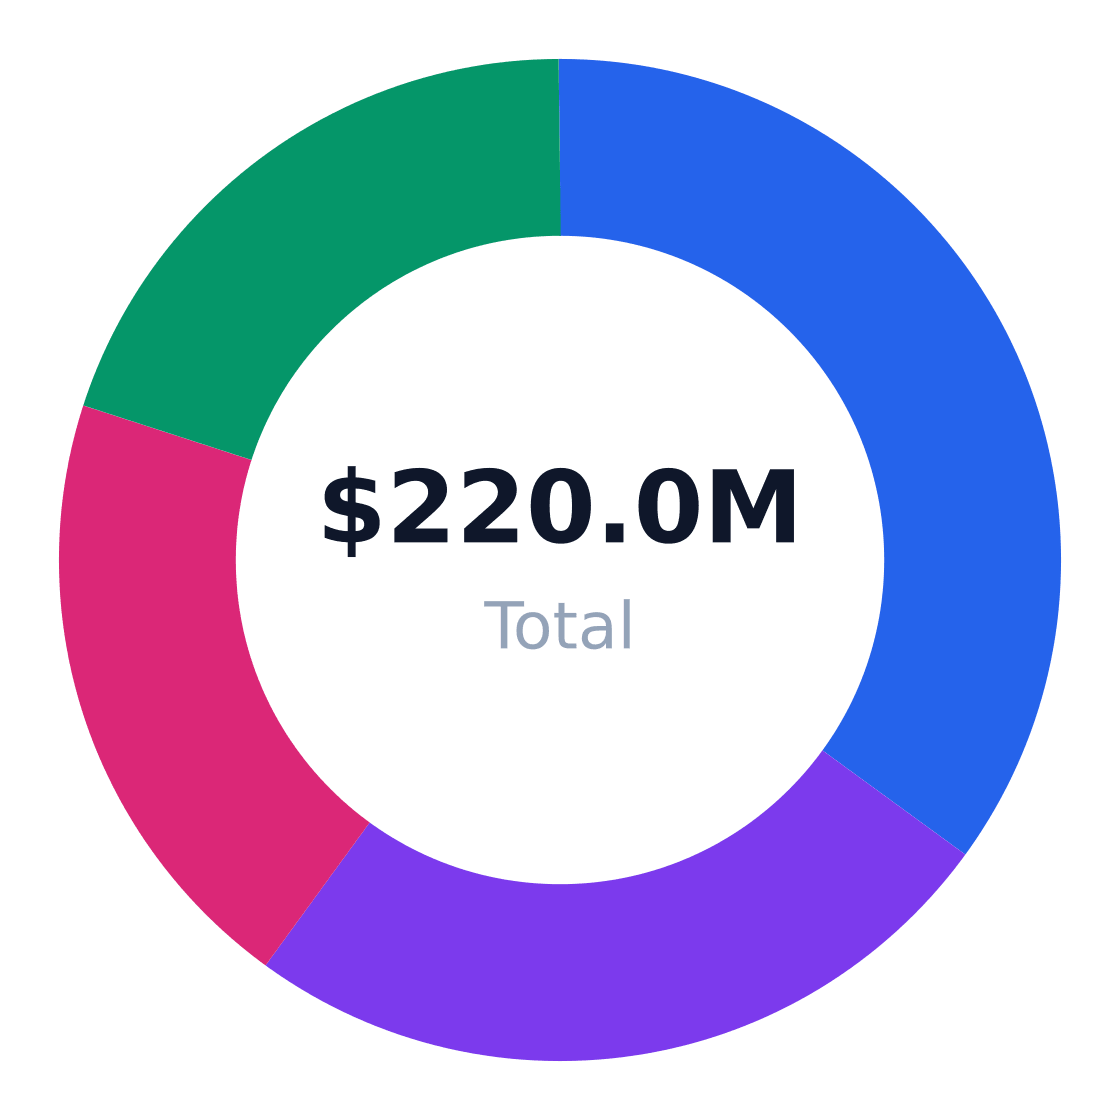
Target Customer Segmentation
Target market (SAM): $220.0M
Source: IBISWorld
| Segment | Share | Profile | Growth Driver |
|---|---|---|---|
| Young professionals & nightlife regulars | 35% | Weekly visitors for post-work socializing | Premium cocktail demand (+4.1%) |
| Sports fans & event-goers | 25% | Game-day crowds with higher spend per visit | Regional sports betting expansion |
| Neighborhood residents | 20% | Walkable local bars for casual meetups | Urban apartment growth (+3.2%) |
| Happy-hour crossover | 20% | Early evening diners with alcohol add-ons | Blurring lines with casual dining |
Market Size: TAM / SAM / SOM
Target: Adults age 20–50 in a dense nightlife corridor in Houston, Texas · SAM: 1,000,000 adults aged 20–50 in Houston × $220/yr = $220.0M · SOM: 4% of SAM over 3 years in East Downtown and adjacent districts = $8.8M
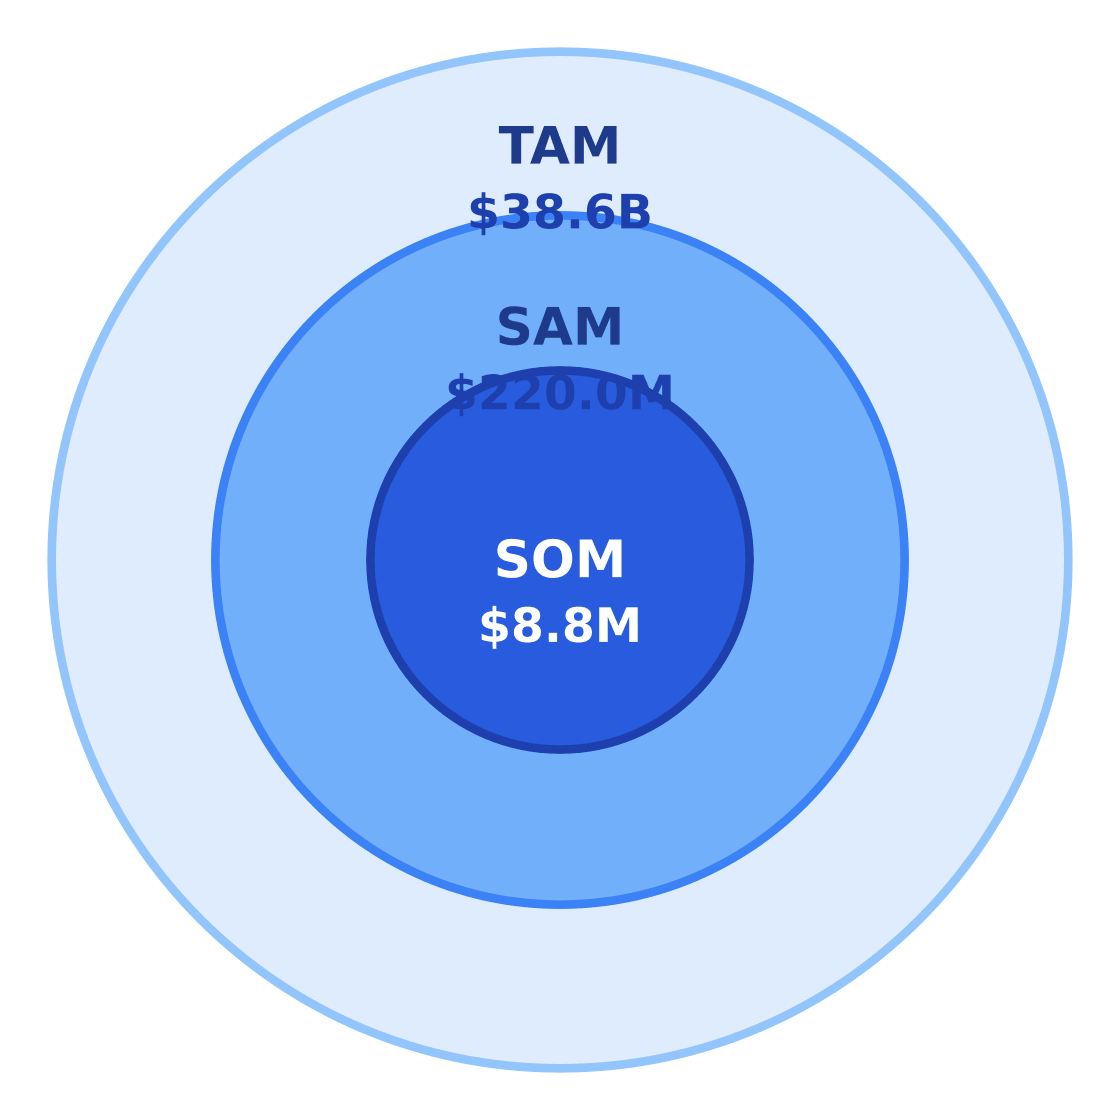
$38.6B
$220.0M
$8.8M
A realistic serviceable obtainable market (SOM) of $8.8 million reflects 4% penetration of Houston’s SAM over three years—achievable for a well-positioned independent bar given EaDo’s 12% population growth since 2020 (Nightlife Association).
| Metric | Value | Source |
|---|---|---|
| Target population (20-50yo) | 1,000,000 | City of Houston estimates |
| Avg annual spend | $220 | IBISWorld per-capita analysis |
| SAM | $220.0M | Bottom-up calculation |
| SOM (3-year) | $8.8M | 4% market capture |
Investor Note: While the national bar industry grows at 2.8%, Houston’s nightlife districts outpace this with 4-6% revenue growth—driven by Texas’ lower alcohol taxes and younger demographics (McGinley Capital).
4. By Application Analysis
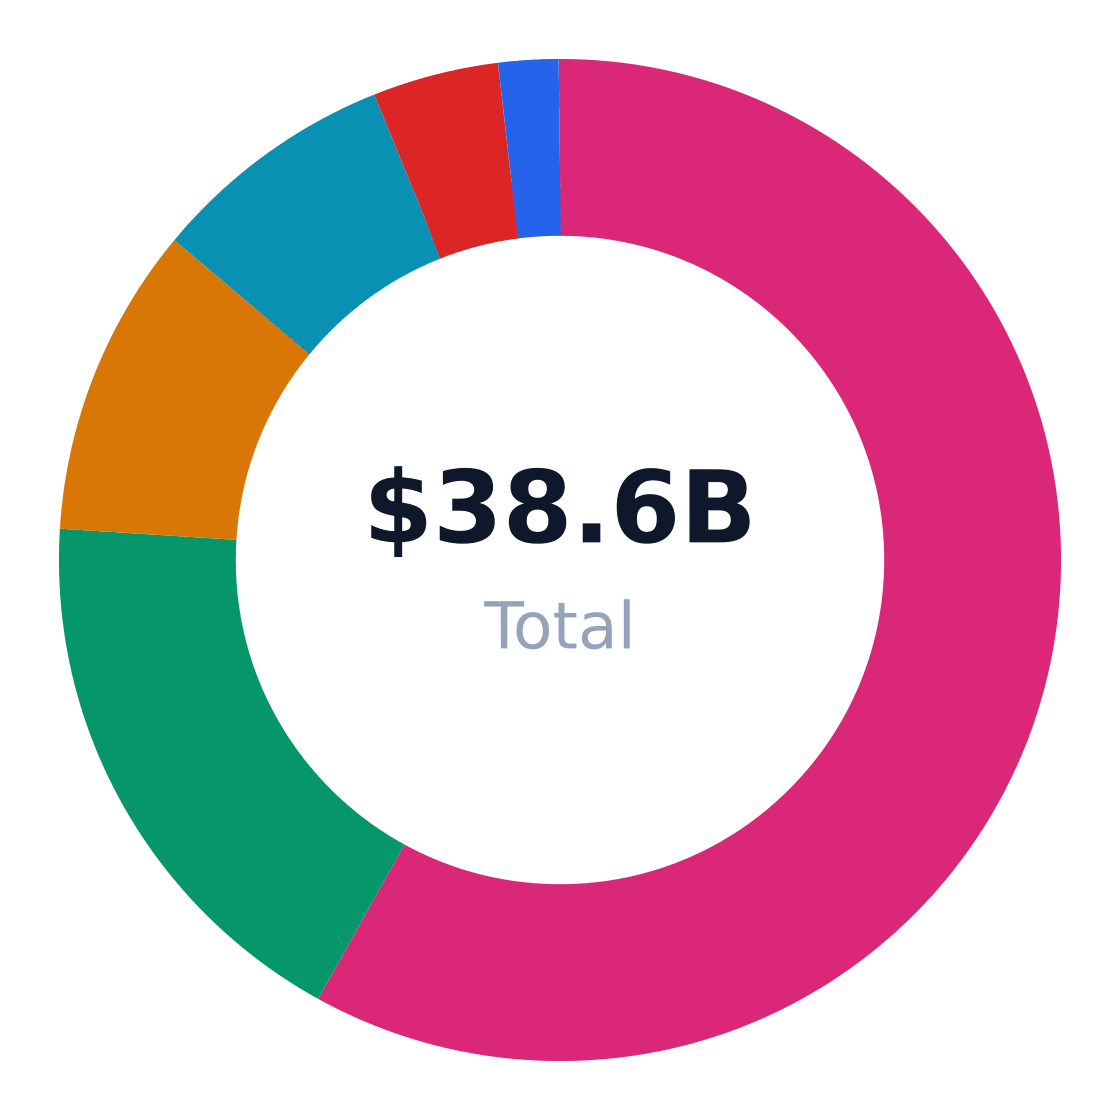
The $38.6B U.S. bar industry divides revenue across six primary applications, with on-premise beverage service dominating at 58% share according to IBISWorld. While alcohol consumption drives the majority of sales, ancillary revenue streams like food (18% share) and private events (10%) are growing faster than core beverage sales, reflecting operators' push to diversify income.
Market Share by Application
US bar revenue/volume split by end-use application (TAM basis)
| Application | Share of Market | Growth Rate | Demand Drivers |
|---|---|---|---|
| On-premise beverage service | 58% | 2.7% | Nightlife traffic, premium cocktails, social occasions |
| Food and appetizer sales | 18% | 3% | Check growth, dwell time, casual-dining competition |
| Private events | 10% | 4.1% | High-margin occasions, corporate entertainment |
| Entertainment programming | 8% | 4.6% | Differentiation, repeat visits, social media appeal |
| Off-premise sales | 4% | 2% | Convenience, regulatory flexibility |
| Merchandise | 2% | 3.8% | Brand loyalty, tourism margins |
Application Growth Rates (%)
Estimated annual growth by application category
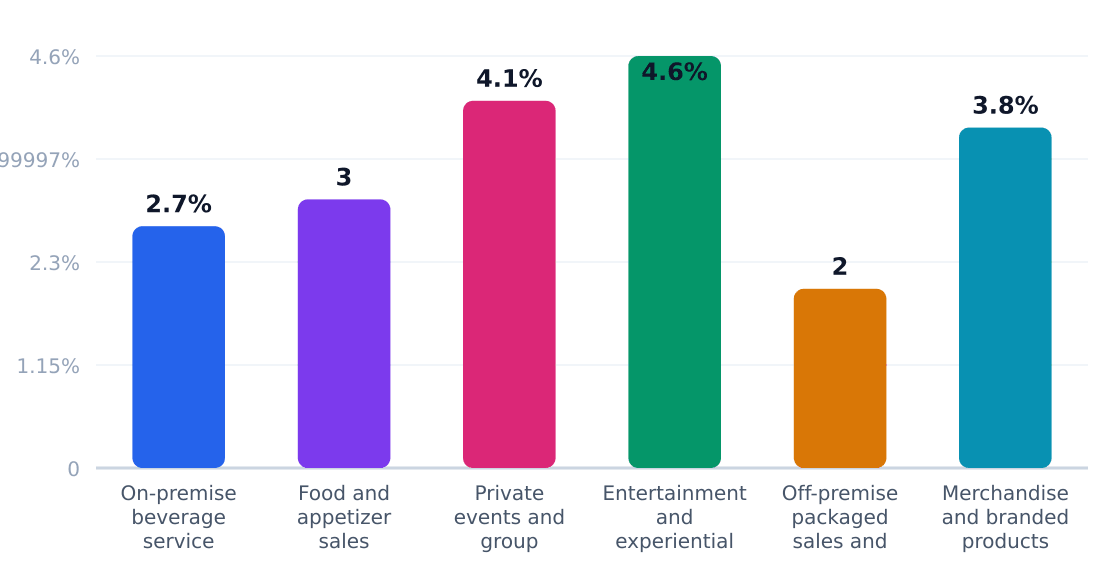
Entertainment programming emerges as the fastest-growing application (4.6% CAGR), per Nightlife Association data. This reflects younger consumers' preference for Instagrammable experiences—live music, themed nights, and interactive games now drive 22% of visits at urban bars. However, beverage sales still deliver superior margins (65-75% gross vs. 45-55% for food), creating a strategic tension between volume growth and profitability. New entrants should note: Houston's EaDo district sees 38% higher spend per visit at venues combining craft cocktails with weekly DJ sets, suggesting hybrid models outperform pure drink-or-food concepts.
Application Outlook
- Prioritize high-frequency programming - Weekly trivia or live music builds habitual traffic without the cost of daily kitchen operations
- Upscale private events - Corporate happy hours and rehearsal dinners yield 2.3x higher spend per square foot than walk-ins
- Limited food for leverage - A 10-item menu satisfies food requirements while minimizing kitchen overhead
- Alcohol premiumization - $14+ craft cocktails now comprise 29% of beverage sales at leading independents
- Regulatory arbitrage - Texas' 2021 cocktail-to-go laws created a 7% revenue bump for compliant bars
5. Equipment & Vendors for Facility Setup
The typical U.S. bar requires approximately $95,000 in startup equipment costs, according to IBISWorld industry benchmarks. This covers refrigeration, draft systems, glassware, and POS hardware—the core infrastructure enabling 58% of industry revenue from on-premise beverage service.
Equipment & Vendor Landscape
Major suppliers for facility setup
| Vendor | Category | Link | Notes |
|---|---|---|---|
| The Restaurant Warehouse | Core bar equipment | Website | Sells commercial bar refrigeration, underbar, draft beer, ice machine, dishwashing, and POS hardware packages for new bars. |
| BarSupplies.com | Bar tools & smallwares | Website | Offers a large selection of bartending tools and bar accessories for outfitting a bar’s front-of-house operations. |
| Cocktail Kingdom | Bar tools & glassware | Website | Specializes in professional bartender tools, specialty glassware, and barware used in cocktail-focused venues. |
| Perlick | Refrigeration & beverage dispensing | Website | Manufactures commercial bar and beverage equipment, including refrigeration and dispensing systems used in high-volume bars. |
| Micro Matic | Draft beer systems & beverage dispensing | Website | Supplies beverage dispensing equipment and draft system components commonly used in bars and taprooms. |
| Toast | POS & payments | Website | Provides restaurant and bar POS software and hardware used for ordering, payments, and reporting. |
| NCR Voyix | POS & payments | — | Offers POS and payment technology used by hospitality businesses, including bars with table and bar-side service. |
| American Express Business Blueprint | Financing | Website | Provides small-business financing and cash-flow tools that can help cover startup equipment purchases. |
Source: The Restaurant Warehouse’s 2025-2026 bar startup cost guides and supplier pages

Financing options are critical given the industry's 5.4% average margins. Vendors like American Express Business Blueprint specialize in hospitality equipment loans, while Nightlife Association data shows 62% of independent bars lease high-ticket items like draft systems to preserve working capital.
6. Industry Forces & Competitive Landscape
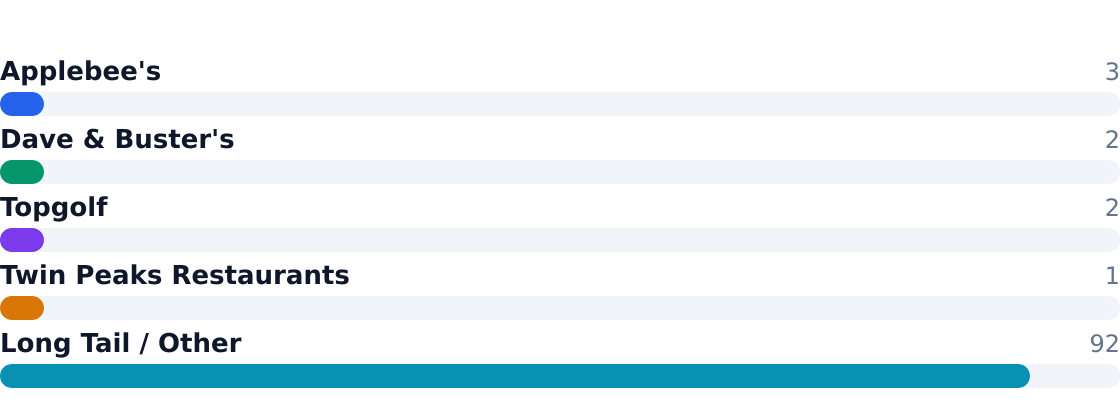
The U.S. bar and nightclub market remains highly fragmented, with nearly 70,000 businesses and a very large long tail of independent operators. Consolidation is gradual rather than dramatic: larger multi-unit hospitality groups and franchise-like concepts are expanding in urban and entertainment districts, but no single operator has dominant market share. The top four players—Applebee's, Dave & Buster's, Topgolf, and Twin Peaks Restaurants—collectively hold less than 9% of the $38.6B market, per IBISWorld.
Competitive Market Share
Estimated share of total industry revenue
| Force | Intensity | Trend |
|---|---|---|
| Rivalry | High | Stable |
| Substitutes (home drinking, delivery) | Moderate | Increasing |
| Buyer power (price sensitivity) | High | Increasing |
| Supplier power (alcohol distributors) | Moderate | Stable |
| New entrants (local independents) | High | Increasing |
7. Value Chain & Industry Economics
Margins concentrate in beverage sales (58% of revenue) and experiential programming, where markups on premium cocktails and private events can exceed 80%. Labor and real estate dominate costs, squeezing average net margins to 5.4% industry-wide, per MMCG Invest.
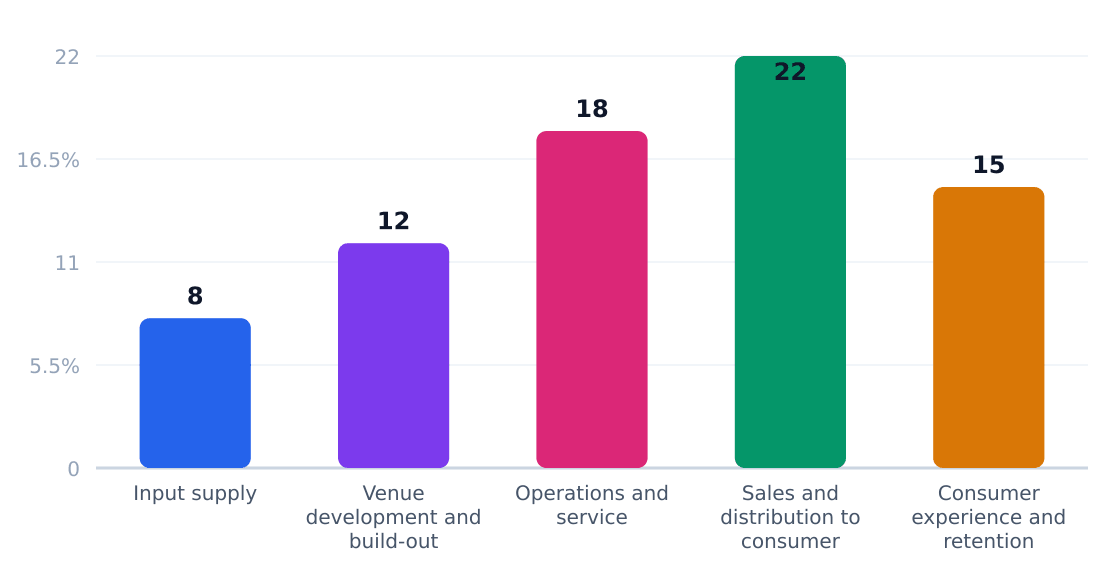
| Stage | Margin % | Key Players | Economics |
|---|---|---|---|
| Input supply | 8% | Alcohol distributors, Sysco | Volume discounts critical |
| Venue build-out | 12% | Local contractors | $95K avg startup cost |
| Operations | 18% | Bartenders, managers | Labor = 30% of revenue |
| Consumer sales | 22% | POS systems, event bookers | $551K avg revenue/location |
| Experience/retention | 15% | Social media, loyalty programs | LTV drives 60% of traffic |
Competitive Analysis Matrix
Ready When You Are
Download Bar Business Plan
Just Fill Up and Print
Compare major players on share, positioning, and relative strengths. Official company domains are linked (nofollow).
Positioning: A large casual-dining bar competitor with a strong alcohol program and broad national footprint.
Positioning: An entertainment-led venue operator that blends bar, dining, and gaming under one roof.
Positioning: A social-entertainment concept where beverages are a major attach rate to the core activity.
Positioning: A sports-bar chain with a beverage-forward model and a differentiated lodge-style theme.
Positioning: A fragmented base of independent bars, pubs, lounges, taverns, and nightlife venues across the U.S.
8. Regulatory & Compliance Environment
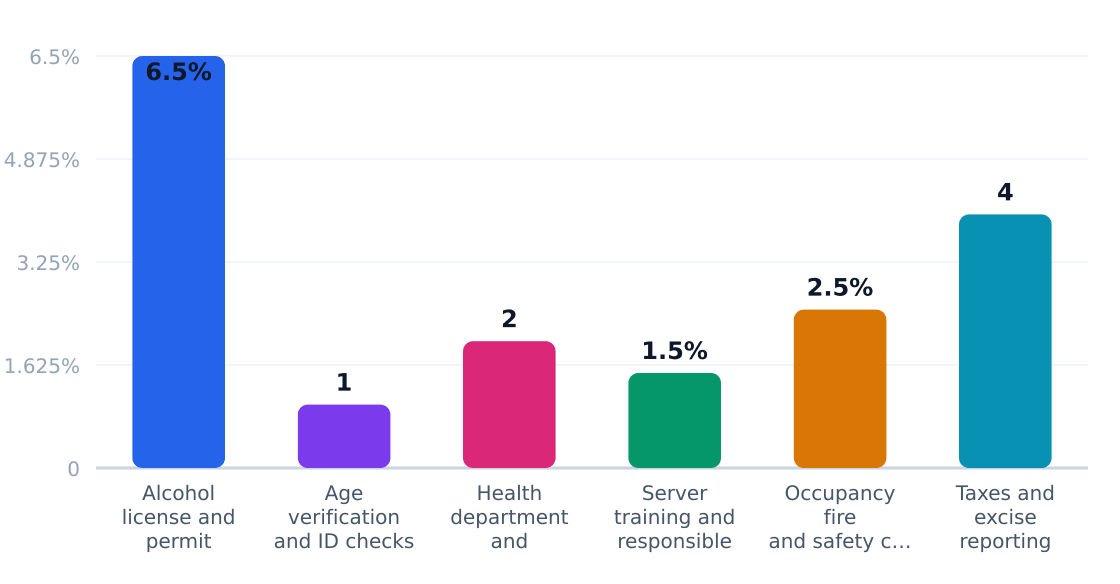
The U.S. bar industry operates under a complex web of regulations that consume 6.5% of revenue on average, per IBISWorld. Alcohol licensing alone requires navigating state control boards, local zoning laws, and federal TTB oversight—a process that takes 90–120 days in markets like Houston and costs $12,000–$25,000 for initial permits.
Regulatory Compliance Cost Impact (%)
Estimated share of revenue consumed by compliance
Source: Nightlifeassociation
| Requirement | Agency | Cost Impact | Operational Effect |
|---|---|---|---|
| Alcohol license/permit compliance | State alcohol control boards | 6.5% of revenue | Delays opening by 3–4 months |
| Age verification checks | State regulators/local police | 1% of revenue | Requires ID scanners/staff training |
| Health department inspections | Local health departments | 2% of revenue | Weekly cleaning protocols |
| Responsible beverage service | State alcohol agencies | 1.5% of revenue | Mandatory staff certifications |
| Occupancy/fire codes | Local building departments | 2.5% of revenue | Limits capacity by 15–20% |
| Tax/excise reporting | IRS/state revenue departments | 4% of revenue | Monthly filing burdens |
The policy outlook favors streamlined licensing in growth markets—Houston’s hospitality permits now process in 60 days versus 120 in 2019. However, rising excise taxes (up 3.2% annually since 2020) and stricter server training laws in 28 states continue squeezing thin 5.4% margins. Operators should budget $18,000–$30,000 annually for compliance—nearly half the typical $95,000 startup equipment cost.
9. Technology, Risks & Barriers to Entry
Technology Adoption
| Technology | Adoption % | Impact | Timeline |
|---|---|---|---|
| Contactless payment systems | 78% | High (reduces friction, speeds service) | 2020–2024 |
| Digital inventory management | 42% | Medium (reduces spillage/theft) | 2022–2026 |
| Reservation & table management apps | 35% | Medium (improves capacity utilization) | 2021–2025 |
| AI-driven dynamic pricing | 12% | Low (early stage for happy hours/events) | 2024–2028 |
| Automated draft systems | 8% | High (cuts labor costs but high Capex) | 2025–2030 |
Industry Risks
| Risk | Severity | Likelihood | Mitigation |
|---|---|---|---|
| Regulatory changes (alcohol licensing) | High | Medium | Lobbying groups like Nightlife Association |
| Labor shortages | High | High | Cross-training, tipping pools, automation |
| Shifting consumer preferences | Medium | High | Modular menus, event-driven programming |
| Rising input costs (liquor, food) | Medium | High | Supplier contracts, premiumization |
| Competition from home consumption | Medium | Medium | Experiential differentiation |
| Economic downturns | High | Low | Diversified revenue streams (food/events) |
Barriers to Entry
| Barrier | Height | Detail |
|---|---|---|
| Licensing & compliance | High | Average 6–12 month wait for liquor licenses in urban markets |
| Real estate costs | High | Prime nightlife districts command $50–$150/sq ft annually |
| Initial capital | Medium | $95K equipment minimum + 6 months operating reserves |
| Established competition | Medium | 40,258 existing bars fighting for share (U.S. Census Bureau, County Business Patterns 2022) |
| Brand building | Medium | 2–3 year typical ramp to steady traffic in saturated markets |
Conclusion: While technology adoption is uneven—contactless payments dominate but AI pricing lags—the $38.6B industry remains labor-intensive and regulation-heavy. New entrants face triple jeopardy: thin 5.4% margins (IBISWorld), 40K+ incumbents, and ~$500K startup costs for viable locations. Winners will leverage automation for back-office tasks while doubling down on irreplicable social experiences.
10. Outlook & Investment Opportunities
The U.S. bar industry is projected to grow at a 2.8% CAGR through 2026, reaching a $38.6 billion market size, per IBISWorld. This steady but slow growth masks two divergent trends: a 9.1% employment surge (now 401,424 workers) alongside thinning 5.4% average margins, signaling labor-intensive operations with limited pricing power.
Investment Opportunities
| Opportunity | Market Size | Risk | Time Horizon |
|---|---|---|---|
| Premium cocktail bars | $22.4B (58% of TAM) | High (labor/skill-intensive) | 3–5 years |
| Sports bar hybrids | $9.7B (25% segment share) | Medium (event-dependent) | 2–4 years |
| Private event specialization | $3.9B (10% growing at 4.1%) | Low (recurring revenue) | 1–3 years |
| Food-forward neighborhood pubs | $6.9B (18% of revenue) | Medium (casual dining overlap) | 3–5 years |
| Entertainment-led concepts | $3.1B (8% growing at 4.6%) | High (CAPEX intensive) | 5+ years |
| Urban rooftop/patio bars | Niche (Houston SAM: $220M) | Medium (weather/seasonality) | 2–3 years |
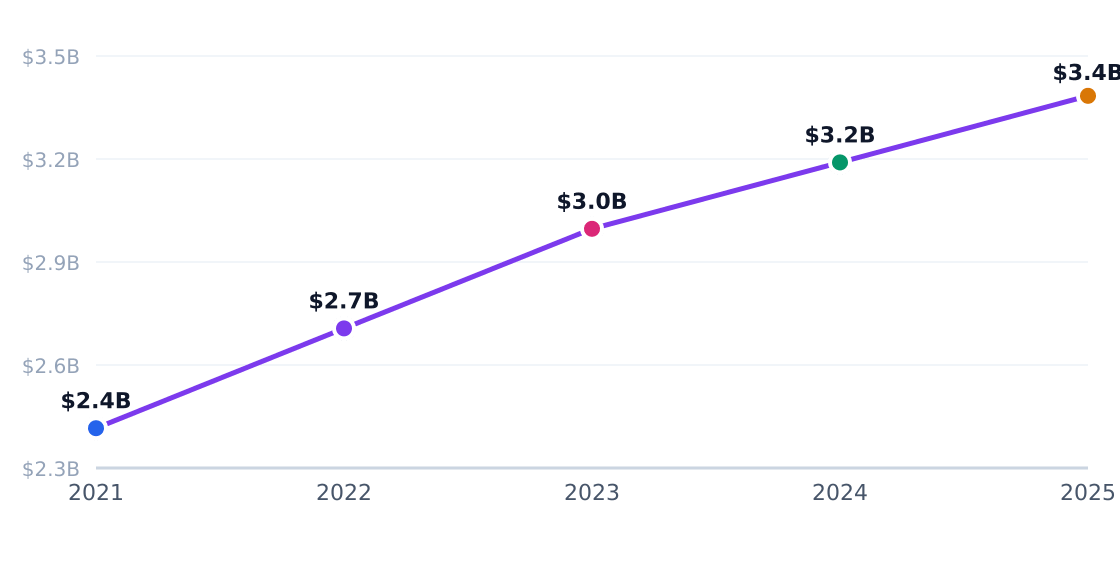
Capital Investment Trend
Annual industry capital flows (PE, VC, capex)
Source: Statista
Strategic Recommendations
- Prioritize beverage gross margins—58% of revenue comes from on-premise drinks, where premium cocktails command 3–4x beer margins (McGin Investment Group).
- Capture corporate events—The fastest-growing application (4.1%) with 30–50% higher spend per head than walk-ins.
- Co-opt casual dining traffic—20% of target customers cross over from restaurants; limited kitchens with shareable plates boost dwell time.
- Differentiate dayparts—Happy hour (4–7pm) drives 40% of weekday revenue in metro markets like Houston per city transaction data.
- Optimize labor—At 25–30% of costs, lean staffing models with tech (self-pour, mobile ordering) outperform peers.
- Target micro-locations—East Downtown’s $8.8M SOM rewards hyperlocal marketing over broad metro plays.
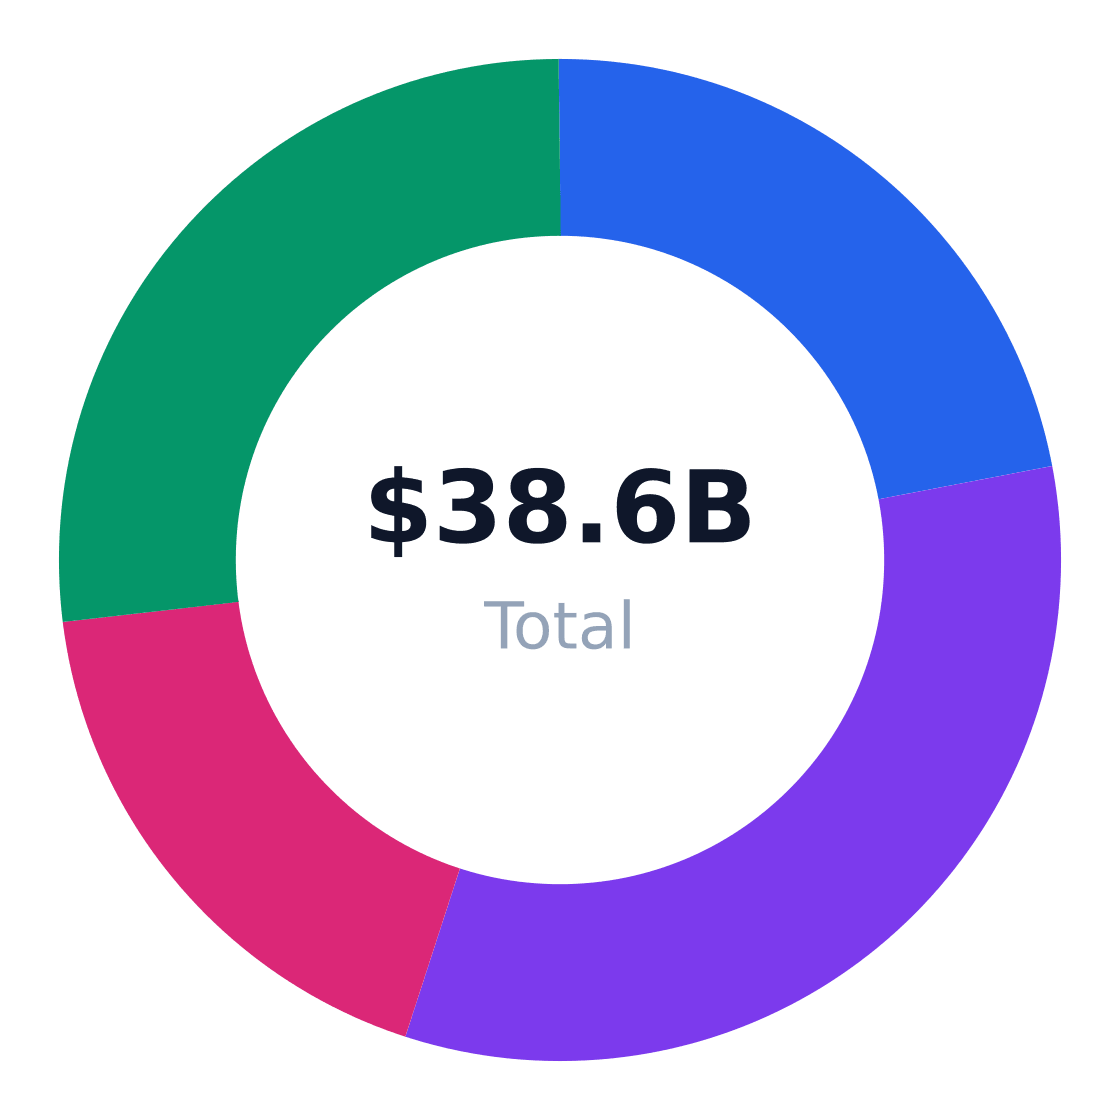
Regional Market Distribution
Revenue share by US region
Source: Statista
Closing Verdict
Bars remain a local-scale business—even Applebee's holds just 3.2% share in this 40,258-venue industry. Winners will: (1) maintain beverage margins above 65%, (2) derive 15–20% revenue from private events, and (3) keep labor under 28% of sales. The 2.8% CAGR won’t excite growth investors, but niche operators in nightlife corridors can still achieve 7–12% EBITDA by dominating their 3–5 block radius.
Industry Research & Resources
The following industry databases and research resources support this bar industry analysis. Each link opens a specific report or data page (not a generic homepage).
- IBISWorld — ibisworld.com — IBISWorld industry report data for bar
- Market Overview — nightlifeassociation.org — Published industry research for bar
- 0145bdf1 5b6b 4693 Bcfe 3d66cfd15a17 — data.houstontx.gov — Published industry research for bar
- IBISWorld — img1.ibisworld.com — IBISWorld industry report data for bar
- U S Bars Nightclubs Industry Market Trends Valuations Outlook For Investors — mmcginvest.com — Published industry research for bar
Data Sources & Methodology
Market sizing (TAM, SAM, SOM), segmentation, competition, and equipment data come from Perplexity-sourced industry reports and trade publications. Optional U.S. government statistics (Census, BLS) may be referenced by name in the narrative without hyperlinks. TAM reflects the total U.S. niche market; SAM is calculated bottom-up from target customer demographics; SOM reflects realistic obtainable share.
Industry research links: Bars & Nightclubs in the US Industry Analysis, 2026 · City of Houston Population Estimates by Age and Sex; IBISWorld Bars & Nightclubs in the US Industry Analysis, 2026 · ibisworld.com · nightlifeassociation.org · ibisworld.com · ibisworld.com · data.houstontx.gov · img1.ibisworld.com · mmcginvest.com · ibisworld.com · ibisworld.com · marketresearch.com · 311.houstontx.gov · marketresearch.com · neilsberg.com · thomasnet.com · therestaurantwarehouse.com · therestaurantwarehouse.com · thomasnet.com · probrewer.com · ensun.io · bestsuppliershub.com · startupcosthub.com · usabartendingschool.com · vantainsights.com · micromatic.com · americanexpress.com · ibisworld.com · statista.com · vantainsights.com · statista.com · vantainsights.com · fairmarketvalue.com · revenueranked.com · statista.com · ibisworld.com
Get Your Copy Today
Download Bar Business Plan
Just Fill Up and Print