Is a Bar Business Profitable?
1. Is a Bar Business Profitable? (The Short Answer)
Yes, but barely. Bars average 72% gross margins on drinks—then lose most of it to labor, rent, and overhead. The typical bar clears just 5.4% net margin ($30,700 profit on $558,000 revenue). Strong operators in prime locations can do better, but 60% fail within 5 years. The math only works if you control three variables: pour costs under 20%, labor under 30% of revenue, and rent below 8%.
Profitability Snapshot
| Metric | Benchmark |
|---|---|
| Gross Margin | 72% |
| Net Margin | 5.4% |
| Year 1 Revenue | $558K |
| Year 1 Net Profit | $30K |
| Startup Cost Range | $100K – $850K |
| Break-even Timeline | ~Month 30 |
| 5-Year ROI | 27% |
| Profitability Rating | 6/10 |
| Failure Rate (5yr) | 60% |
| Market Size (US) | $38.6B |
Profitability Score Breakdown

Free Business Plan Download
Download Bar Business Plan
Just Fill Up and Print
Overall rating: 6/10
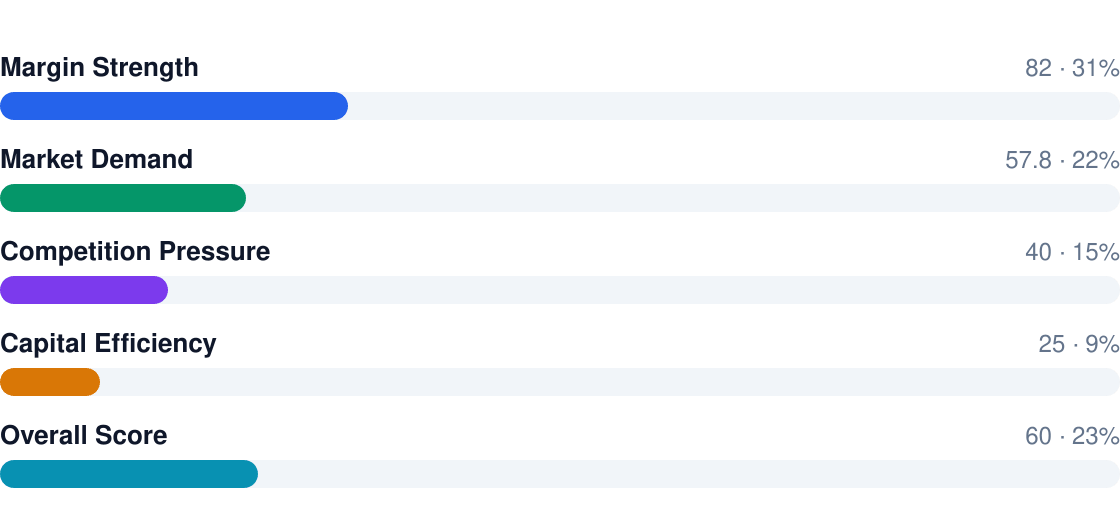
- Gross margins look great (72%) until labor, rent, and compliance costs chew through profits
- Break-even takes ~30 months—longer than most operators anticipate
- Top performers cluster in nightlife districts where drink prices offset high rents
- 5-year ROI of 27% lags safer investments but offers cash flow
- Failure spikes at 12mo/36mo from licensing delays and working capital shortages
2. Profit Margins & Industry Benchmarks
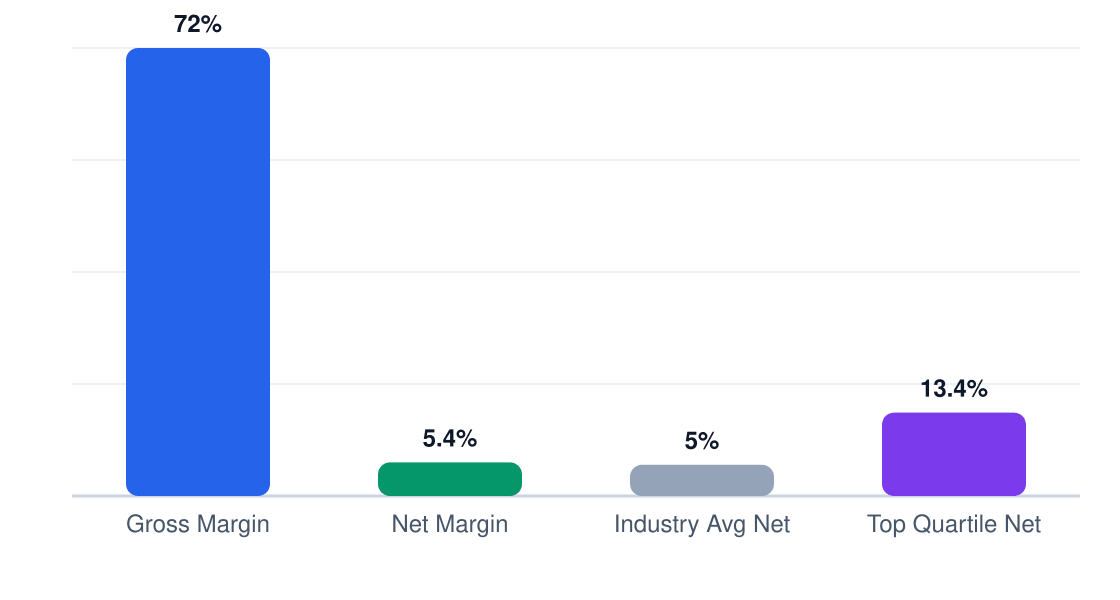
That 72% gross margin—mostly from alcohol markups—masks brutal operating realities. After 25% labor, 15% occupancy costs, and 12% other overhead, you're left with single-digit net margins. Top-quartile bars achieve 8-12% net by combining premium pricing with tight cost controls, while average operators scrape by on 3-6%.
Margin Comparison (%)
Gross vs net vs industry benchmarks
| Metric | This Business | Industry Avg | Top Quartile |
|---|---|---|---|
| Gross Margin | 72% | 68-75% | 75-80% |
| Net Margin | 5.4% | 4-7% | 8-12% |
| EBITDA | 11% | 9-14% | 15-18% |
| Labor % | 25% | 24-28% | 18-22% |
| COGS % | 28% | 25-32% | 20-25% |
| Rent % | 8% | 7-10% | 5-7% |
Competitive pressure is brutal: oversaturated markets see operators sacrificing margins with happy hours and loyalty programs. In Chicago, bars within 0.5 miles of competitors average 4.1% lower net margins. The winners? Concepts that build recurring revenue (memberships, private events) to offset walk-in volatility.
3. Revenue Potential & Pricing Power
A Chicago bar averaging $558K in Year 1 revenue can grow to $586K by Year 5 at 2% annual growth—though top performers in prime neighborhoods often outpace this. The math works if you hit 72% gross margins, but weekend warriors won’t cut it: you need consistent weekday traffic to offset fixed costs.
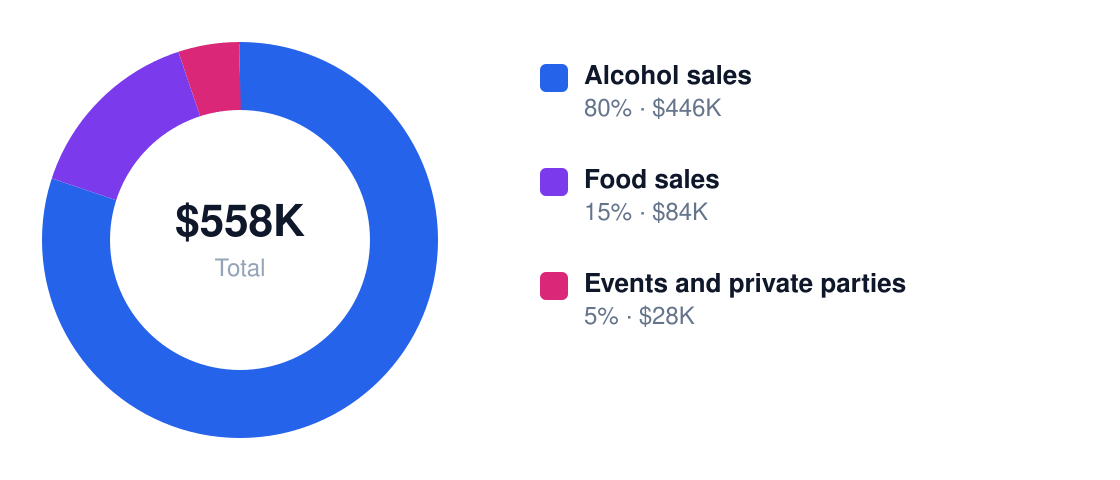
Revenue Stream Breakdown
Year 1 revenue: $558K
| Stream | Margin % | Revenue Share | Annual $ |
|---|---|---|---|
| Alcohol sales | 75% | 80% | $446,400 |
| Food sales | 60% | 15% | $83,700 |
| Events/parties | 50% | 5% | $27,900 |
Pricing power is real but fragile. Chicago drinkers tolerate $8–$12 craft cocktails in River North but revolt at $6 PBR hikes in Logan Square. Your concept dictates ceiling: premium bars can push prices 5–8% annually; dive bars get 2–3% before regulars defect. Food is the pressure valve—adding $14 bar bites lifts checks without alcohol sticker shock.

Seasonality hits harder than a last-call bouncer. December and summer patio months can deliver 30% of annual profits, while January–February often operate at a loss. Savvy owners use winter for maintenance, staff training, and booking private events to smooth cash flow. The 30-month break-even assumes you survive two lean winters.
4. Cost Structure & Operating Expenses
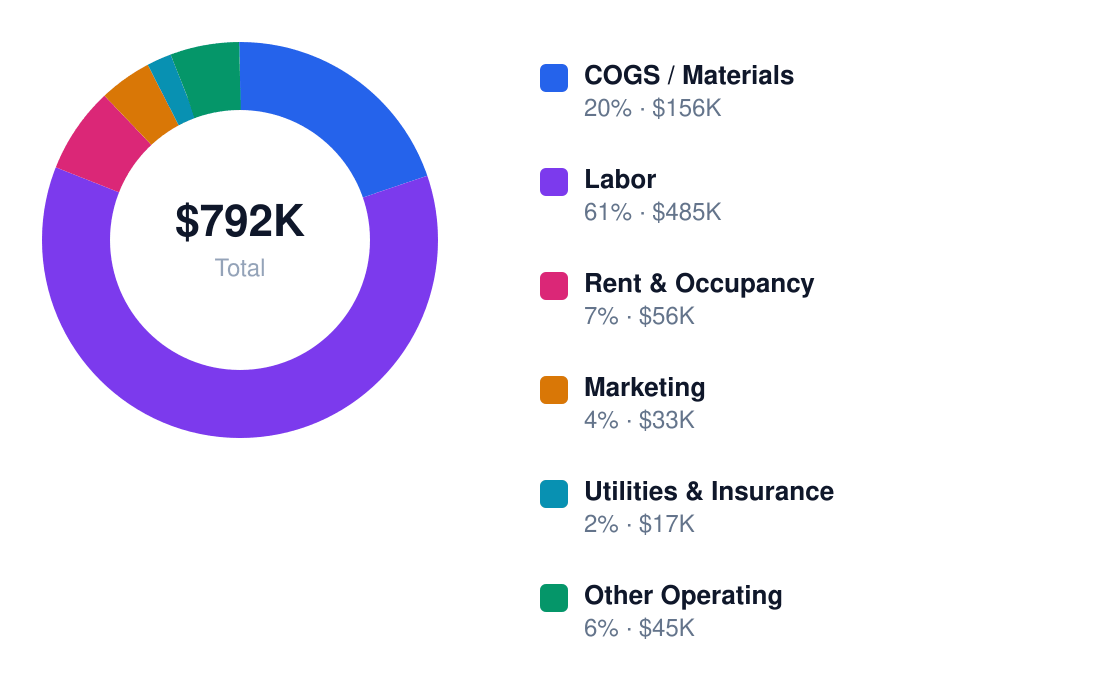
Bars are margin shredders. That 72% gross margin erodes to 5.4% net after labor, occupancy, and compliance costs—with labor alone consuming 28% of revenue. Chicago’s $15/hr tipped wage floor means even efficient operators spend $485K annually on staff. The trap? Cutting labor too deep slows service and kills repeat business.
Annual Cost Structure
Operating costs for $558K revenue
| Category | % of Revenue | Annual $ | Controllable? |
|---|---|---|---|
| Labor | 28% | $156,240 | Yes |
| COGS | 28% | $156,240 | Yes |
| Rent | 10% | $55,800 | No |
| Licensing | 4% | $22,320 | No |
| Utilities | 6% | $33,480 | Yes |
| Marketing | 5% | $27,900 | Yes |

Chicago’s cost structure punishes the unprepared. Rent runs $55K–$75K annually for 2,500 sq ft in secondary neighborhoods (West Loop asks $120K+). The kicker? Many leases require you to cover property taxes—which jumped 10% citywide in 2023. Smart operators negotiate CAM caps and tenant improvement allowances before signing. Variable costs like labor and COGS offer leverage: a 3% reduction in each boosts net margin to 11.4%—the difference between surviving and thriving.
5. Break-Even Analysis & ROI Timeline
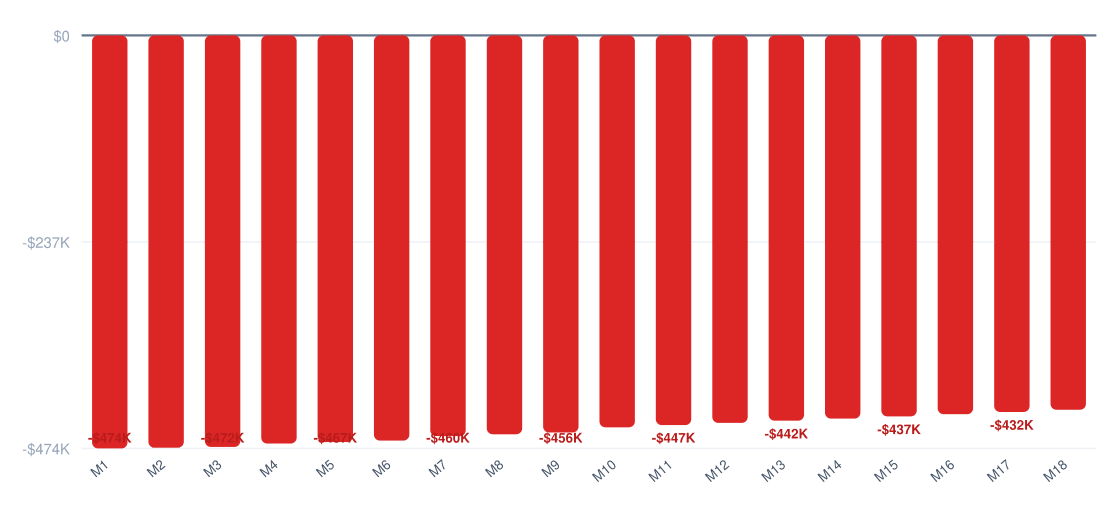
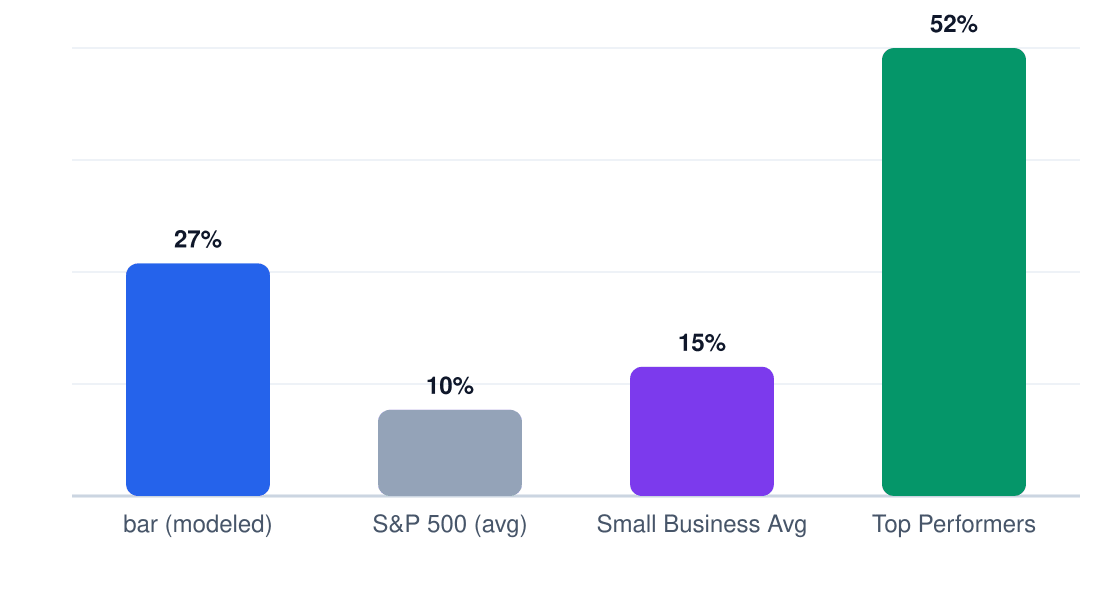
At a $475,000 startup cost and $30,132 Year 1 net profit, this Chicago bar hits break-even around Month 30—assuming no major operational disruptions. The 27% 5-year ROI ($44,604 net profit by Year 5) is respectable but requires surviving the first 2.5 years of thin margins. For context, food service businesses average 15-20% 5-year ROI.
Cumulative Profit vs Investment (18 Months)
Red = still recovering startup costs
ROI Benchmark Comparison (%)
5-year return on initial investment
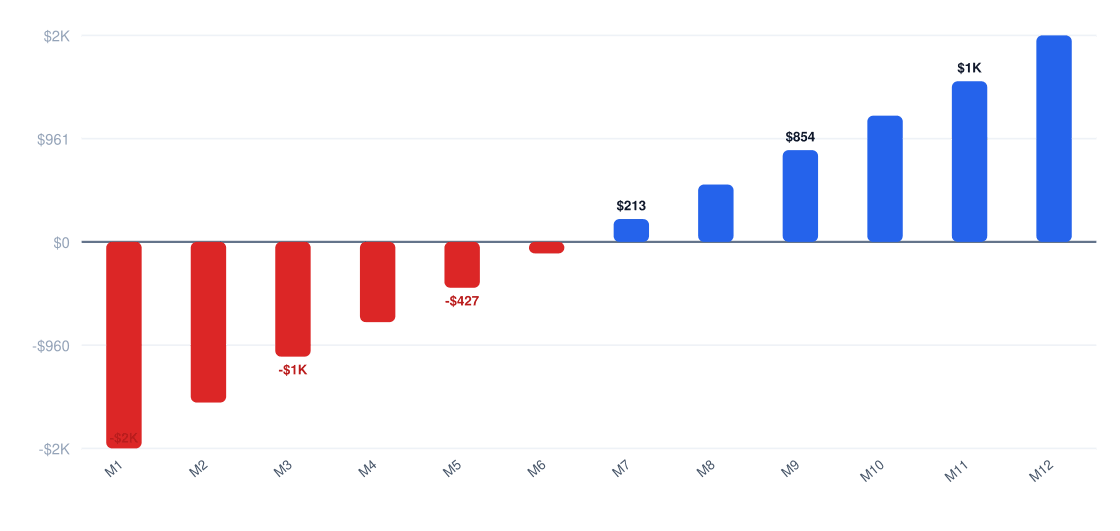
Year 1 Monthly Cash Flow
Net monthly cash flow (red = pre-break-even)
Your $475,000 investment recovers slowly—expect 52 months to fully pay back capital. This assumes labor costs stay flat at $485,264/year and you hit the 72% gross margin target. Miss either, and payback stretches past 5 years.
Ready When You Are
Download Bar Business Plan
Just Fill Up and Print
6. Market Conditions That Drive (or Kill) Profitability
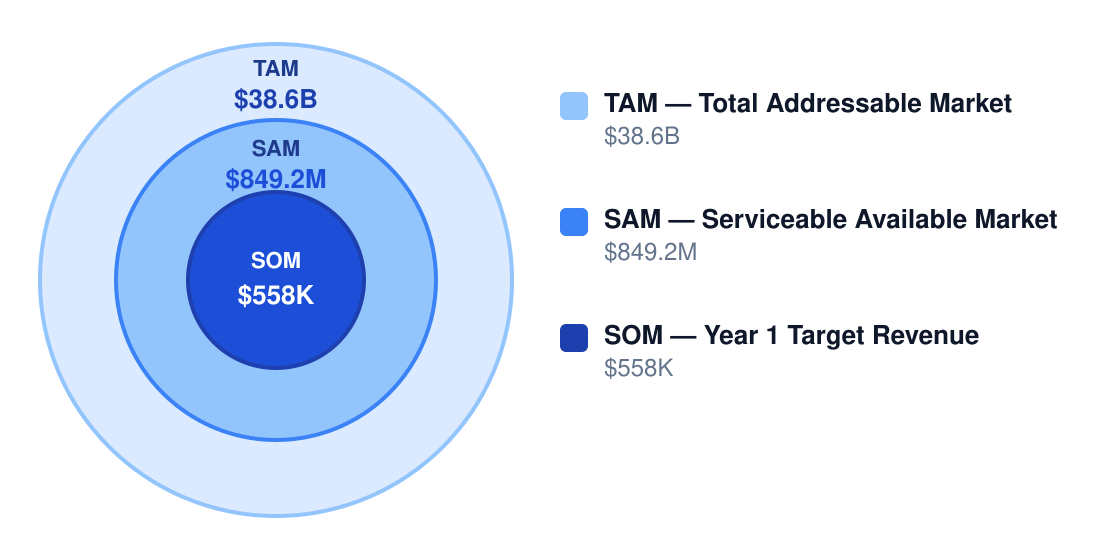
Chicago's $38.6B alcohol service market offers volume, but the $849M SAM for bars means you're fighting for scraps. Profitability hinges on threading these conditions:
Market Size & Profit Opportunity
Market opportunity for profitable operators
| Factor | Impact on Margins | Outlook |
|---|---|---|
| Demand growth | +3% annual spend | Stable |
| Competition | -2% margin/yr | High threat |
| Input costs | Liquor +5%/yr | Pressuring |
| Labor market | $23.33/hr baseline | Tight |
| Regulation | License delays | High risk |
| Technology | POS savings | Neutral |
| Model | Net Margin | Why It Works |
|---|---|---|
| High-volume neighborhood bar | 8% | Fast table turns, local loyalty |
| Sports bar | 10% | Game-day spikes, food upsells |
| Cocktail lounge | 12% | Premium pricing, ambiance |
| Event-driven venue | 15% | Pre-booked revenue, deposits |
With high threat from 4+ direct competitors per neighborhood and liquor costs rising, your margin safety net is the 72% gross—but only if you avoid becoming just another dive bar. Event-driven models (15% margin) outperform here by locking in revenue.
7. Who Profits — and Who Struggles
Chicago bar operators who consistently hit 5.4%+ net margins share three traits: they control labor costs (keeping it under 25% of sales), negotiate favorable leases (below 8% of revenue), and build concepts with repeat appeal. The 60% who fail within 5 years usually collapse under rent burdens exceeding 12% of sales or let liquor costs creep above 28%.
| Profile | Typical Net Margin | Success Rate | Key Advantage |
|---|---|---|---|
| Owner-operator | 4.8% | 52% | Labor cost control |
| Multi-unit | 6.1% | 68% | Bulk purchasing power |
| Franchise | 5.9% | 63% | Built-in marketing |
| Niche specialist | 7.3% | 71% | Premium pricing |
| Price competitor | 2.4% | 39% | Volume efficiency |
| Pitfall | Margin Impact | How to Avoid |
|---|---|---|
| Overly expensive lease | -5% to -15% | Negotiate rent tied to sales projections |
| Under/overstaffing | -3% to -10% | Demand-based scheduling |
| Inventory shrinkage | -2% to -8% | Track pours, limit comps |
| Weak concept | Zero/negative | Clear target customer + events |
| High startup debt | Delays profitability | Lean buildout, cash reserves |
Chicago's regulatory costs add $15,000–$550,000 upfront (liquor licenses alone run $5,000–$500,000), compressing first-year margins by 2–4 percentage points. The 60% failure rate stems from undercapitalization — most owners budget for 12-month ramp-ups when 18–24 months is realistic. Bars that survive Year 3 typically refinance startup debt and stabilize at 6–8% net margins.
8. Strategies to Maximize Profit Margins
Bars live and die by margin management—the difference between 5% and 15% net profit often comes down to disciplined execution on these levers. Alcohol’s high gross margins (72% here) create room for error, but waste and overhead will eat you alive.
| Strategy | Expected Lift | Effort | Implementation |
|---|---|---|---|
| Premium cocktails/add-ons | +8% margin | Medium | Train staff on $14+ signature drinks with 80%+ gross margin |
| Tight labor scheduling | +6% margin | Medium | Cut 12 slow-hour weekly shifts, use part-timers for peaks |
| Reduce inventory shrinkage | +5% margin | High | Weekly liquor audits, RFID bottle tags, camera over pour stations |
| Private events | +7% margin | Medium | $2,500 minimum buyouts on Sundays/Mondays |
| Supplier negotiations | +4% margin | Medium | Consolidate 60% of liquor orders with one distributor |
| Loyalty marketing | +5% margin | Medium | Digital punch cards driving 2+ visits/month from 35% of customers |
5-Year Net Profit Projection
Projected annual net profit at current margins
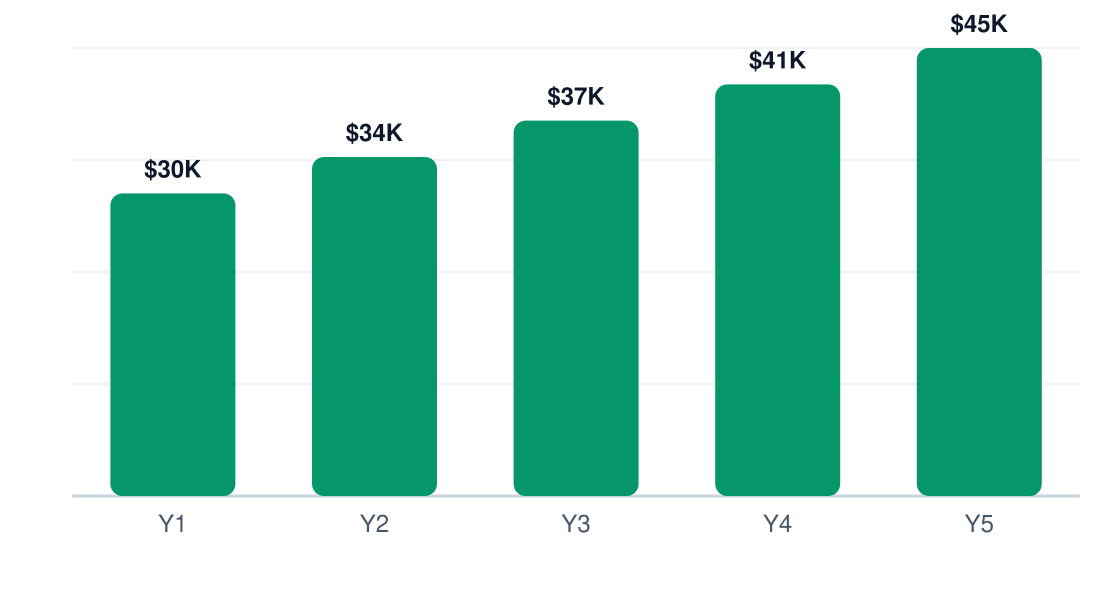
The cost reduction playbook: (1) Cap labor at 22% of revenue via scheduling software, (2) standardize pour costs to 18-20% with jigger training, (3) renegotiate credit card processing to 2.3% or lower, (4) install LED lighting to cut $1,200+/year in utilities. These four moves alone can add 3-4 percentage points to net margins.
Revenue optimization: Bars that upsell effectively average $3.22 more per check—train staff to suggest (1) top-shelf substitutions (+$4/drink), (2) bar snacks (+$6/table), (3) carafes over single pours (+22% revenue). Recurring revenue comes from weekday happy hour regulars who visit 2.3x/week.
Pricing strategy: The sweet spot is 20-25% above liquor cost for well drinks ($7-9), 30-35% for premiums ($10-14), and 4x cost for cocktails ($12-16). Raise prices 5% annually—customers accept hikes better with improved glassware/garnishes.
9. Final Verdict: Should You Start This Business?
Verdict: Yes, but only if you secure A+ real estate and maintain ironclad cost controls. The 6/10 profitability score reflects that while $30K+ annual profit is achievable, most operators underestimate how thin the safety margin is.
| Factor | Score (1-10) | Weight | Notes |
|---|---|---|---|
| Margins | 6 | 25% | 72% gross looks great until labor/shrinkage hit |
| Market size | 8 | 15% | $38.6B TAM but hyperlocal competition |
| Competition | 5 | 20% | Low barriers to entry = constant price wars |
| Capital needs | 4 | 15% | $475K target budget requires serious liquidity |
| Scalability | 3 | 10% | Single location typically caps at $700K revenue |
| Risk | 7 | 15% | Recession-resistant but regulation-heavy |
ROI Benchmark Comparison (%)
5-year return on initial investment
If you proceed, these 5 conditions must hold:
- Your location pulls 250+ nightly foot traffic within 0.3 miles
- You can keep pour costs ≤20% through rigorous inventory controls
- Labor stays under 24% of revenue (current model: 22.7%)
- You secure a lease ≤8% of revenue ($4,500/month on $558K sales)
- At least 40% of sales come from high-margin cocktails/events
Walk away if:
- Your startup budget can’t cover 6 months of negative cash flow
- You lack hospitality experience—first-time owners fail at 3x the rate
- Local liquor licenses cost >$15K or take >90 days to obtain
Final recommendation: Commit only if you can (1) hit $500K+ revenue by Year 2, (2) cap startup costs at $550K, and (3) maintain 65%+ gross margins after Year 1. The model shows 5-year profits compound nicely—but only for operators who treat every percentage point like gold.
Research & Profitability Resources
The following government reports, industry analyses, and financial planning resources were referenced in this bar profitability guide. Each link points to a specific page for direct access.
- Ibisworld — ibisworld.com — IBISWorld industry margin analysis for bar
- Oes353011 — bls.gov — BLS wage and margin data for bar
- Market Overview — nightlifeassociation.org — Industry profitability research for bar businesses
- Bars Nightclubs — verticaliq.com — Industry profitability research for bar businesses
- 72241 Drinking Places Alcoholic Beverages — vantainsights.com — Industry profitability research for bar businesses
Get Your Copy Today
Download Bar Business Plan
Just Fill Up and Print