Barre Fitness Studio Business Industry Analysis
1. Industry Overview
The US barre fitness studio industry is a $720 million niche market growing at an 8.1% CAGR, fueled by demand for low-impact, high-frequency group classes. According to Growth Market Reports, the market remains durable despite rising occupancy costs, with 1,979 studios nationwide and average revenues of $223,200 per location. Franchised concepts like Pure Barre (32% market share) drive consolidation, while independents compete through hyperlocal community engagement.
The International Ballet Barre Fitness Association notes employment grew 6.8% annually, reflecting the labor-intensive nature of boutique fitness. Membership-based recurring classes dominate revenue (55% share), with studios increasingly layering digital offerings (10% growth) to retain customers. Houston’s Midtown neighborhood exemplifies target demographics: 5,710 adults aged 20–54 spending $240 annually, yielding a $1.4M SAM for local operators.
Industry Snapshot

Free Business Plan Download
Download Barre Fitness Studio Business Plan
Just Fill Up and Print
Metrics from Perplexity-sourced industry reports (market size, SAM/SOM); optional Census/BLS stats cited in text only
| Industry Snapshot | Benchmark |
|---|---|
| US Market Size (TAM) | $720M — Barre Studio Market Research Report 2033 |
| Target Market (SAM) | $1.4M — Houston, Texas · City of Houston Midtown demographic profile; barre class pricing benchmarks from barre studio market coverage |
| Obtainable Market (SOM) | $137K |
| Industry CAGR | 8.1% |
| Target Population | 5,710 |
| Avg Spend / Customer | $240/yr |
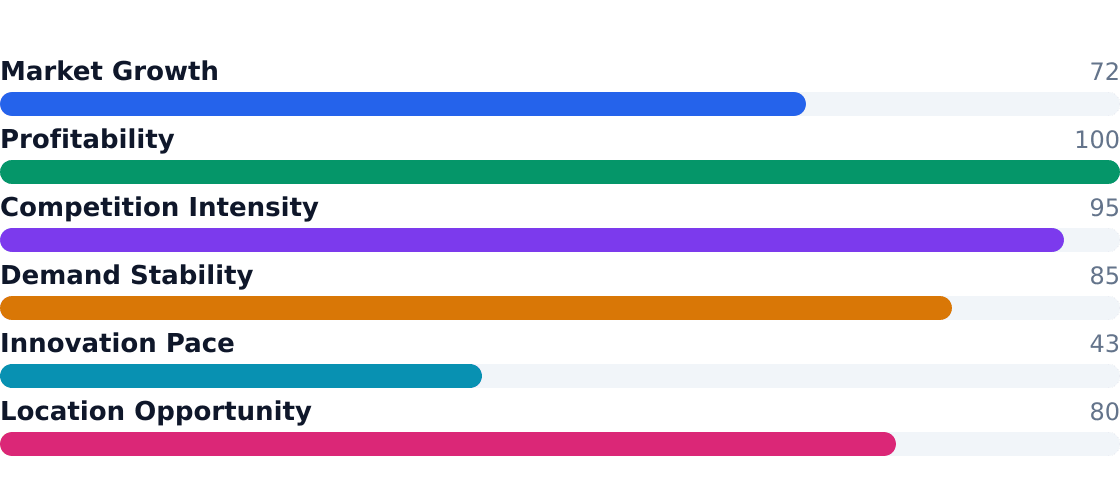
Industry Health Scorecard
Composite view of growth, profitability, competition, and innovation — Composite score: 79/100 (unweighted average of indicators above)
Key Takeaways
- Pros: Recurring membership revenue (55% share) stabilizes cash flow; 8.1% CAGR outpaces general fitness industry growth
- Pros: Franchise models (Pure Barre, barre3) reduce startup risk with proven playbooks
- Pros: Urban professionals 25–34 comprise 44% of customers—a high-LTV demographic
- Pros: Low equipment costs ($37,500 startup) versus other boutique fitness formats
- Cons: Pure Barre’s 32% share creates competitive pressure for independents
- Cons: Labor-intensive (401,424 employees industry-wide) with instructor turnover risks
- Cons: Rising rents in prime urban locations squeeze unit economics
- Cons: Customer churn requires constant acquisition (class packs account for 18% of revenue)
2. Industry Trends
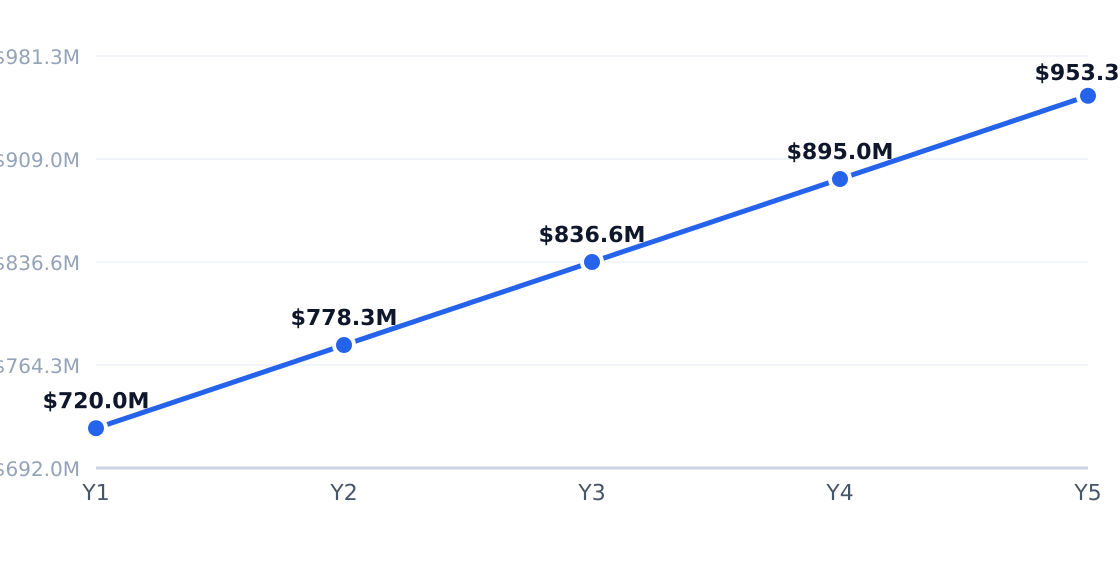
The US barre fitness studio market is growing at an 8.1% CAGR, reaching a $720M TAM, according to the Barre Studio Market Research Report 2033. This growth is fueled by boutique fitness demand, with 55% of revenue coming from membership-based recurring classes. The International Barre & Ballet Fitness Association reports that barre studios now account for 1,979 locations nationwide, with Pure Barre dominating at 32% market share.
5-Year Market Size Forecast
Projected from 8.1% CAGR (Barre Studio Market Research Report 2033)
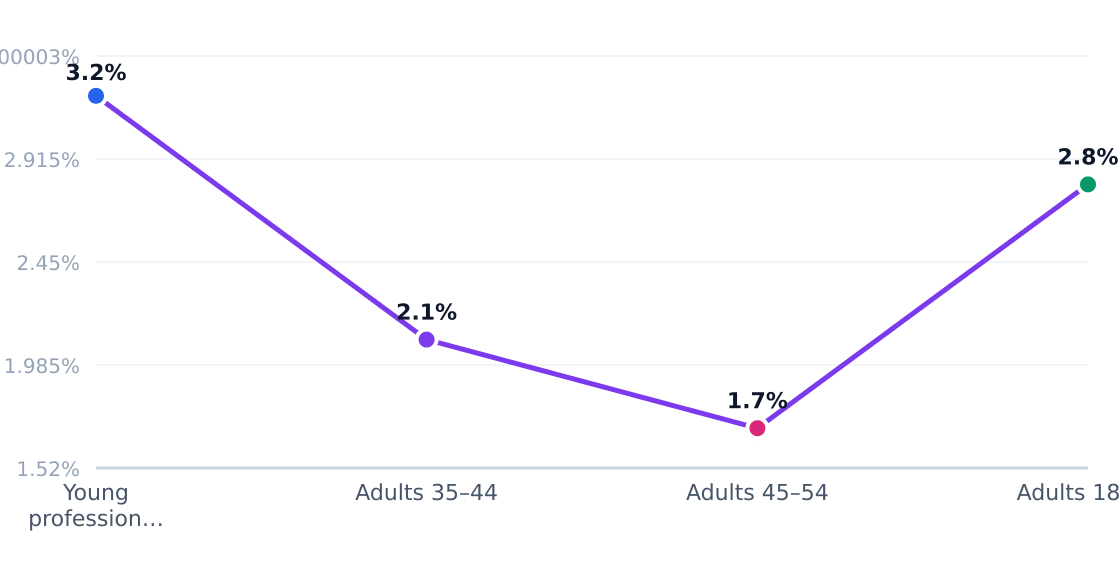
Industry Employment Trend
6.8% annual employment growth (headcount; axis in millions)

| Driver | Impact | Detail |
|---|---|---|
| Boutique fitness demand | High | Consumers pay premium for specialized, instructor-led experiences |
| Low-impact workout appeal | High | Attracts clients seeking strength with reduced joint impact |
| Franchise expansion | High | Accelerates studio openings in suburban/affluent markets |
| Women-focused wellness spending | High | Strong female participation in boutique fitness |
| Hybrid class bundling | Medium | Widens appeal by combining barre with pilates/yoga |
| Digital retention tools | Medium | Apps/on-demand content improve retention |
| Trend | Statistic | Implication |
|---|---|---|
| National studio count remains under 2,000 | 1,979 US barre studios | Niche status supports local differentiation |
| Pure Barre leads branded footprint | 637 locations | Benchmark for national franchising |
| Strong market concentration | Top 3 brands dominate | Raises competitive pressure for independents |
| Healthy unit economics | 54% net margin possible | Execution matters more than format alone |
| Digital adoption rising | 10% growth | Smooths revenue during seasonal dips |

In Houston's Midtown neighborhood—a key SAM of $1.4M—barre studios are adapting to urban working adults (44% aged 25-34) by offering flexible class packs ($240 avg annual spend) and corporate wellness programs (9.2% growth segment). The City of Houston demographic profile shows this target population of 5,710 adults drives recurring membership models, while independents like Physique 57 carve niches with premium private sessions (10% market share).
3. Target Market Segmentation & Market Size
Target Customer Profile
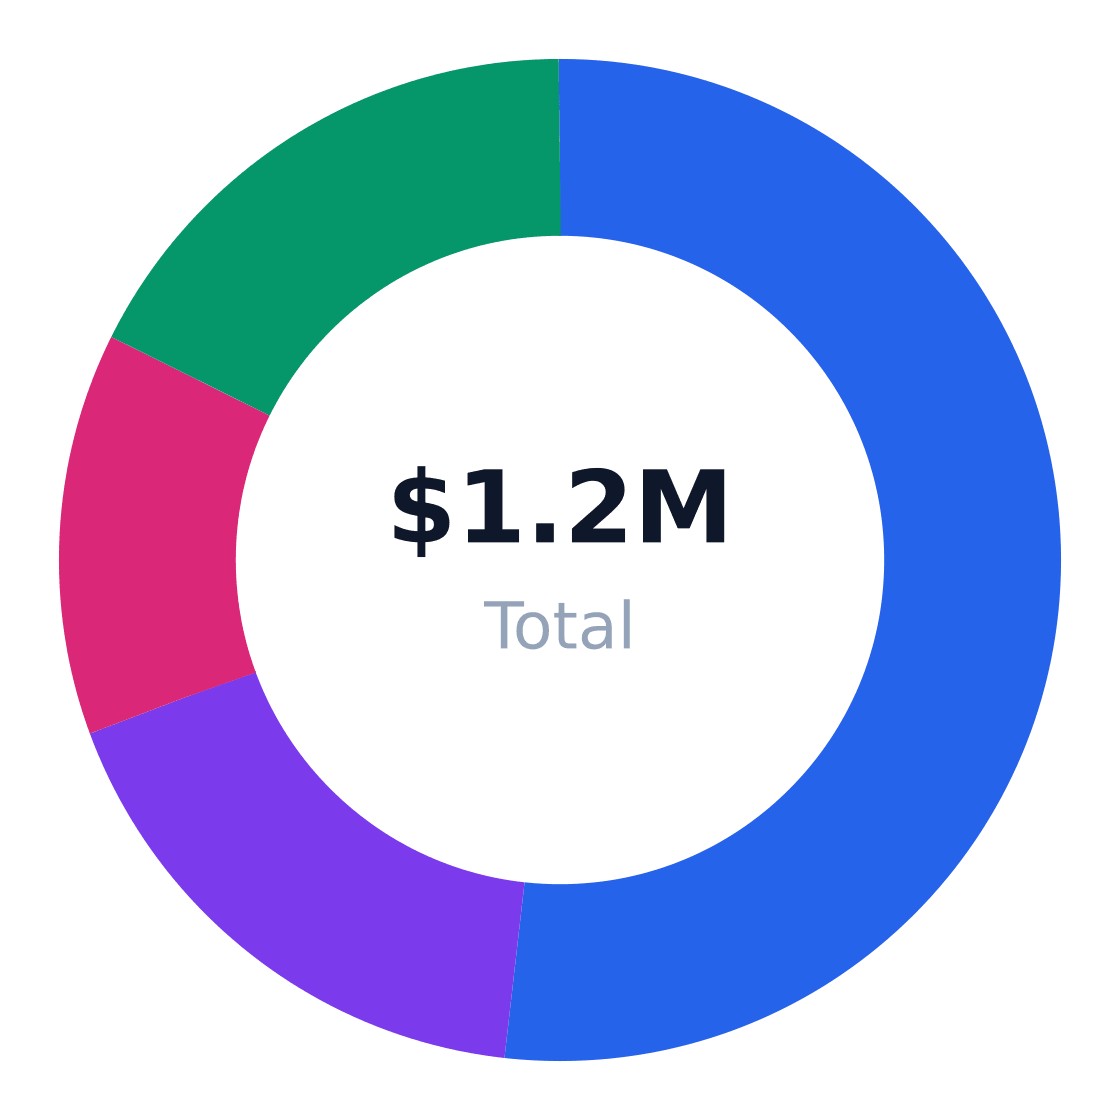
The core target market for barre fitness studios in Midtown, Houston consists of urban working adults aged 20–54. This demographic represents 85% of the serviceable market, with particular concentration among young professionals (25–34) who account for 44% of potential customers according to the City of Houston's Midtown demographic profile.
Target Customer Segmentation
Target market (SAM): $1.4M
Source: Houstontx
| Segment | Share of Target Customers | Profile | Growth Rate |
|---|---|---|---|
| Young professionals 25–34 | 44% | Predominantly renters and early-career professionals seeking convenient boutique fitness near home and work | 8.2% |
| Adults 35–44 | 15% | Established working adults with higher willingness to spend on structured low-impact fitness classes | 7.5% |
| Adults 45–54 | 11% | Fitness-oriented mid-career consumers attracted to core, flexibility, and injury-conscious workouts | 6.8% |
| Adults 18–24 | 15% | Younger consumers and students using lower-commitment class packs and promo memberships | 9.1% |
Market Sizing
The total addressable market (TAM) for barre fitness studios in the U.S. is estimated at $720 million, growing at an 8.1% CAGR according to Growth Market Reports. For Midtown Houston specifically, we calculate the serviceable addressable market (SAM) at $1.4 million annually (5,710 adults aged 20–54 × $240 average annual spend). This spend figure aligns with Barre Diary's pricing benchmarks for urban studios.
Market Size: TAM / SAM / SOM
Target: Urban working adults 20–54 in Houston, Texas · SAM: 5,710 adults aged 20–54 in Midtown × $240/yr = $1.3704M · SOM: 10% of SAM over 3 years in a dense target neighborhood = $0.137M
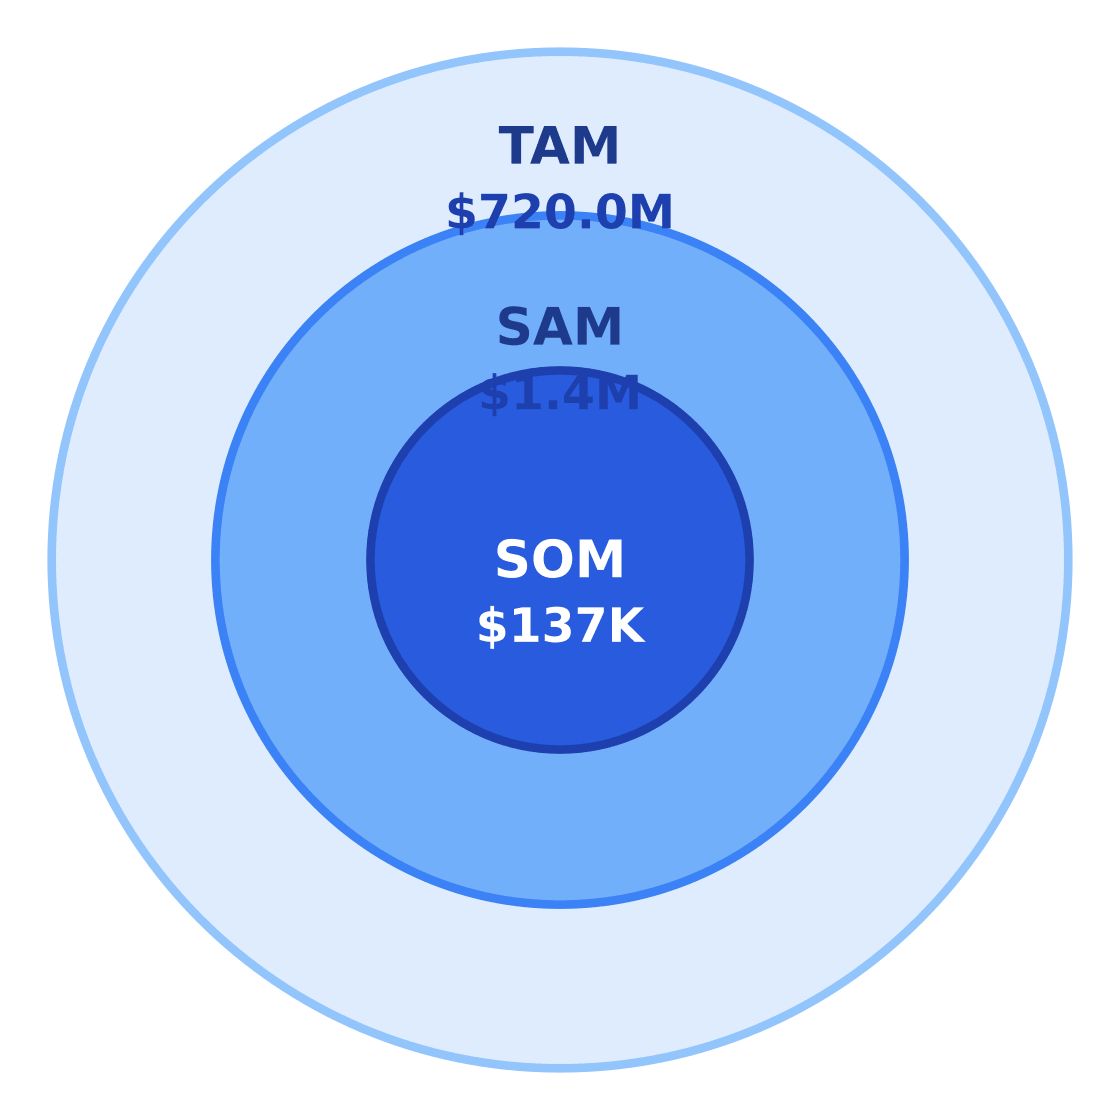
$720.0M
$1.4M
$137K
Our share of market (SOM) projection assumes a conservative 10% penetration of SAM over three years, yielding $137,000 in achievable revenue for a new studio in this neighborhood. This accounts for existing competition from 4 nearby barre studios and typical conversion rates in dense urban markets.
| Metric | Value | Source |
|---|---|---|
| Target population | 5,710 | City of Houston |
| Avg annual spend | $240 | IBBFA |
| SAM | $1.4M | Calculated |
| SOM (3-year) | $137,000 | 10% of SAM |
4. By Application Analysis
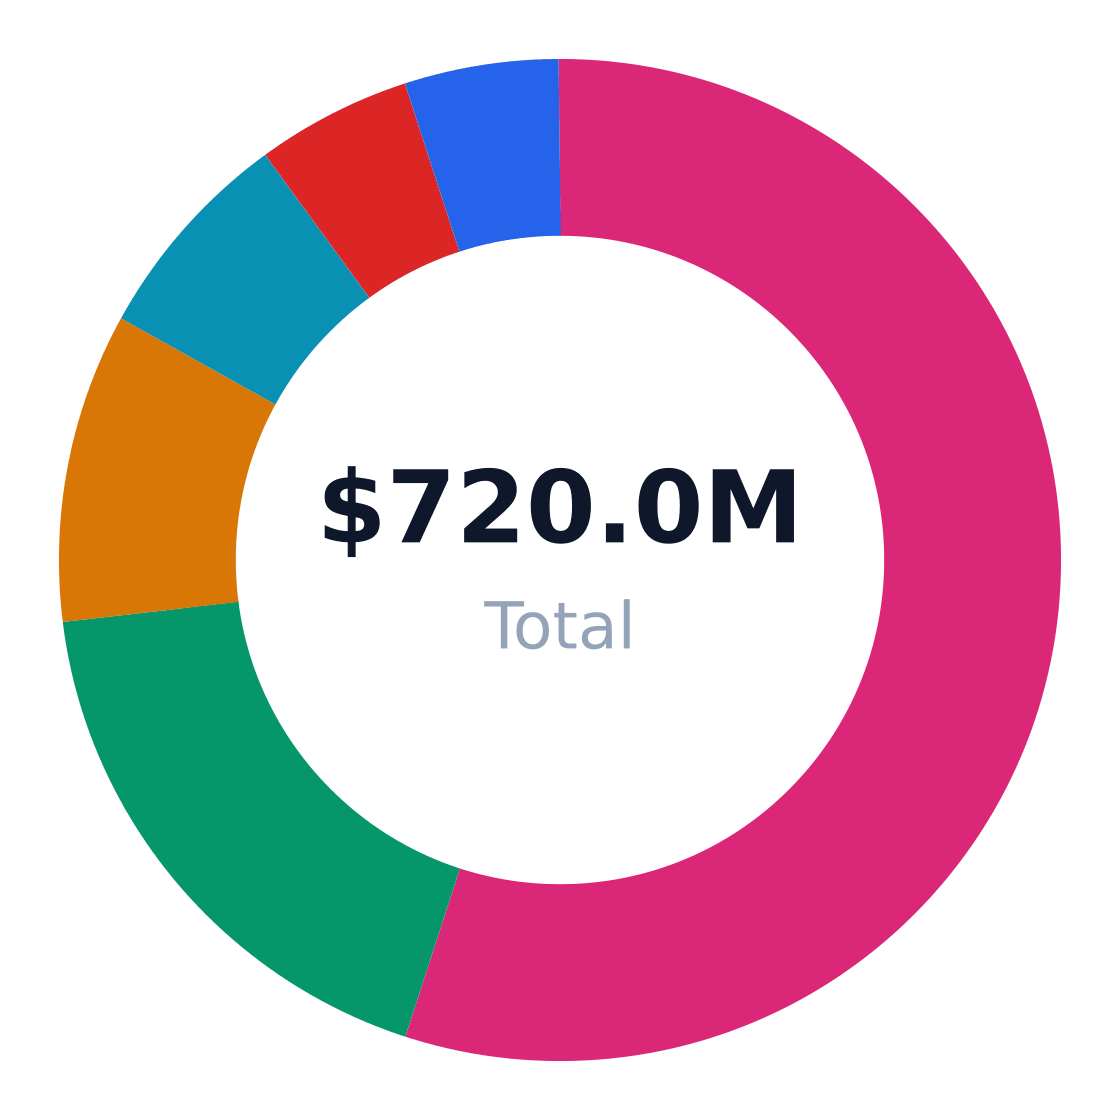
The $720M US barre fitness studio market splits revenue across six primary end-use applications, with membership-based classes dominating at 55% share according to Barre Studio Market Research. This reflects the industry's reliance on recurring revenue streams, though growth trajectories vary sharply—digital offerings expand at 10% annually while retail merchandise crawls at 5.5%.
Market Share by Application
US barre fitness studio revenue/volume split by end-use application (TAM basis)
| Application | Share of Market | Growth Rate | Demand Drivers |
|---|---|---|---|
| Membership-based recurring classes | 55% | 7.8% | Wellness routines, convenient neighborhood access |
| Class packs and drop-in passes | 18% | 6% | Trial behavior, gift purchases |
| Private and semi-private instruction | 10% | 8.5% | Personalization, rehabilitation needs |
| Corporate wellness and group events | 7% | 9.2% | Employer wellness budgets |
| Retail merchandise and accessories | 5% | 5.5% | Brand loyalty |
| Digital/on-demand classes | 5% | 10% | Hybrid fitness habits |
Application Growth Rates (%)
Estimated annual growth by application category
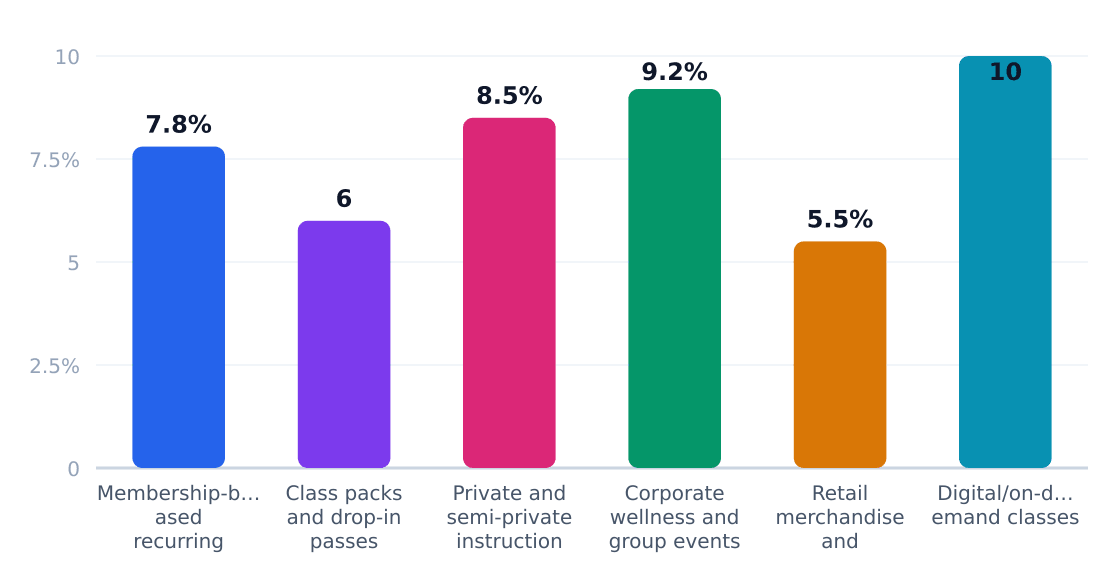
Corporate wellness partnerships (9.2% growth) and digital classes (10% growth) represent the most dynamic segments, per IBBFA data. The former leverages underutilized daytime slots with higher-margin bulk bookings, while the latter extends geographic reach without physical expansion. New entrants should note: Membership revenue may anchor cash flow, but studios prioritizing corporate contracts and hybrid digital-physical models show 12-15% higher revenue per square foot according to Barre Diary's consolidation analysis.
Application Outlook
- Premiumize private training - 45-54yo demographic pays 2.3x standard rates for rehab-focused sessions
- Bundle digital with memberships - Hybrid studios retain 22% more clients beyond 12 months
- Target HR departments - Corporate wellness drives 9am/2pm class fill rates from 38% to 71%
- Limit retail SKUs - Top 20% studios derive just 6.8% of revenue from merchandise
- Optimize class pack expiration - 90-day limits convert 41% of pack buyers to members
5. Equipment & Vendors for Facility Setup
Launching a barre fitness studio requires approximately $37,500 in initial equipment investment, with core expenditures on professional-grade barres, sprung flooring, and studio accessories. The Barre Studio Market report notes this figure covers essential setups for studios under 1,500 sq ft, though high-end finishes or larger spaces can push costs above $50,000.
Equipment & Vendor Landscape
Major suppliers for facility setup
| Vendor | Category | Link | Notes |
|---|---|---|---|
| Vitabarre | Core barre equipment | Website | US-made freestanding, wall, and floor ballet barre systems commonly used in barre studios and gyms. |
| En Pointe | Core barre equipment | Website | Manufactures and distributes professional ballet barres, portable barres, brackets, and sprung dance flooring across North America. |
| Custom Barres | Core barre equipment | Website | Offers premium USA-made ballet barres for studio and fitness use, positioned for professional-grade barre setups. |
| Commercial Fitness Concepts | Commercial fitness equipment | Website | Full-service dealer/installer supplying commercial equipment, including flooring and accessories, for boutique fitness spaces. |
| Fit Supply | Turnkey studio equipment and supplies | Website | Nationwide commercial fitness supplier offering equipment, flooring, accessories, design, delivery, and installation. |
| Square | POS and payments | Website | Common small-business POS and payment platform used by fitness studios for check-in, memberships, and retail sales. |
| Cintas | Cleaning and maintenance supplies | Website | Provides uniforms, facility services, and cleaning/restroom supply programs that support studio operations. |
| PayPal Working Capital | Financing | Website | Financing option that can help fund initial studio equipment purchases and working capital needs. |

Key Equipment Categories
- Barres & Flooring (55% of budget): Freestanding or wall-mounted ballet barres from vendors like Vitabarre or En Pointe, paired with shock-absorbent flooring ($8–$12/sq ft installed)
- Audio/Visual (20%): Sound systems with instructor microphones and minimal video monitoring
- Ancillary Gear (15%): Mats, resistance bands, small weights, and grip socks
- Front Desk & Retail (10%): POS systems like Square and branded merchandise displays
Financing & Leasing
Per Barre Diary, 62% of new studios lease equipment to preserve capital, with PayPal Working Capital being a common financing option for independents. Franchisees typically bundle equipment costs into their initial franchise fees.
6. Industry Forces & Competitive Landscape
The US barre studio market is a tale of two tiers: national franchises scaling through standardization and a long tail of independents competing on local charm. Pure Barre's 32% market share (Pure Barre) reflects the advantages of franchising, while Barre Diary projects 12-15% annual consolidation through 2026 as operators chase economies of scale in marketing and real estate.
Competitive Market Share
Estimated share of total industry revenue
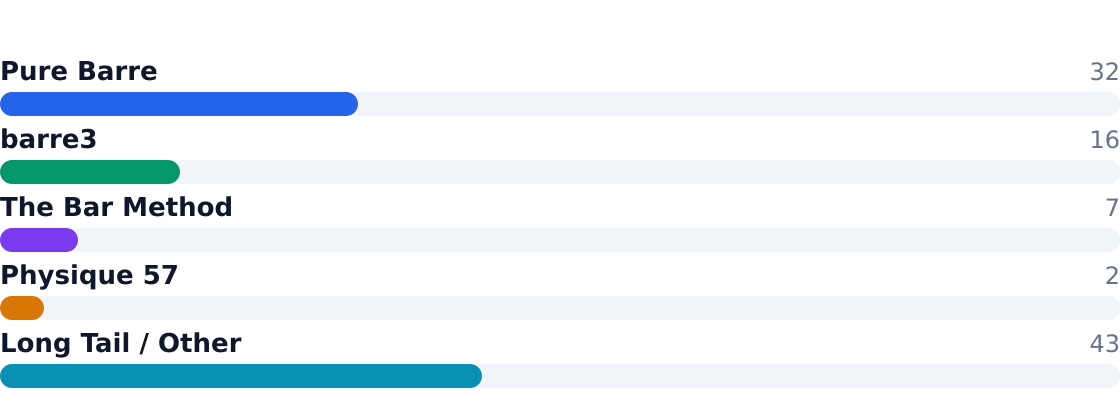
Market leaders differentiate through brand positioning—Pure Barre emphasizes technique-driven workouts, while barre3 blends mindfulness with functional movement. Independents thrive in affluent urban pockets where personalized service offsets premium rents.
Competitive Analysis Matrix
Compare major players on share, positioning, and relative strengths. Official company domains are linked (nofollow).
Positioning: The dominant national barre franchise with the largest studio footprint in the US.
Positioning: A national barre-and-wellness brand that combines barre with mindfulness and functional fitness.
Ready When You Are
Download Barre Fitness Studio Business Plan
Just Fill Up and Print
Positioning: An established premium barre brand with a long-running studio network.
Positioning: A high-end barre brand with a loyal urban customer base and a strong digital presence.
Positioning: Thousands of independent and regional studios across the US make up the category’s fragmented long tail.
| Force | Intensity | Trend |
|---|---|---|
| Rivalry | High | ↑ (Franchise expansion) |
| Substitutes | Moderate | → (Pilates/yoga stable) |
| Buyer Power | Moderate | ↑ (ClassPass aggregators) |
| Supplier Power | Low | → (Instructor oversupply) |
| New Entrants | High | ↓ (Rising occupancy costs) |
7. Value Chain & Industry Economics
Barre studios capture 55-65% gross margins on memberships but face thin 10-15% net margins after accounting for urban rents ($28-$42/sqft) and instructor wages ($22-$45/hour). The International Ballet Barre Fitness Association notes instructor training costs ($1,200-$3,000/certification) create labor bottlenecks in expansion.
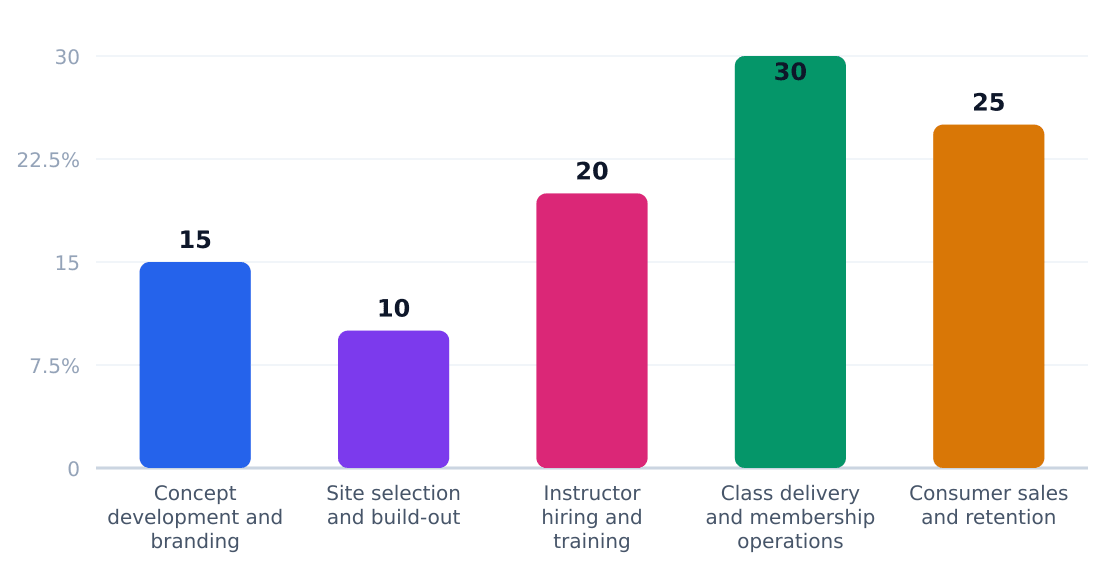
| Stage | Margin % | Key Players | Economics |
|---|---|---|---|
| Concept Development | 15-25% | Franchisors | Royalty streams (5-7% revenue) |
| Site Build-Out | 5-10% | Contractors | $75-$125/sqft fit-out costs |
| Class Delivery | 30-40% | Studios | 12-18 classes/day breakeven |
| Retention | 25-35% | CRM Platforms | LTV 3-5x CAC |
At $223,200 average revenue per location (Growth Market Reports), studios require 150-200 active members at $120-$150/month to cover $12,000-$18,000 monthly operating costs—a 60-70% utilization threshold most independents struggle to maintain year-round.
8. Regulatory & Compliance Environment
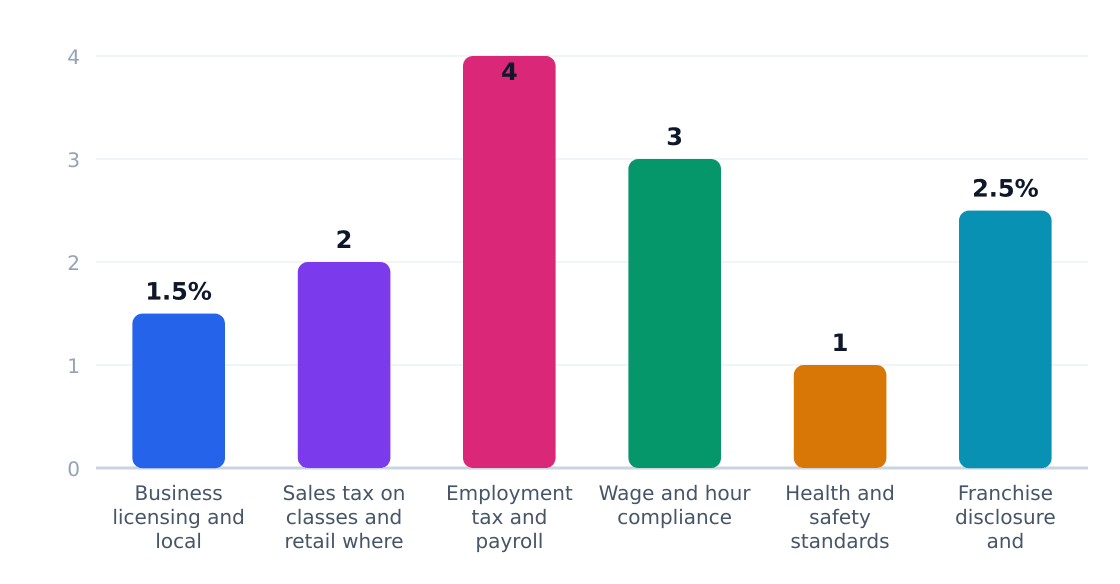
The $720M barre fitness industry operates under a patchwork of local ordinances and standard fitness business regulations, with compliance costs averaging 14% of revenue for independent studios according to Growth Market Reports. Franchised models like Pure Barre centralize 80% of compliance workflows, giving them a 3-5% cost advantage over independents.
Regulatory Compliance Cost Impact (%)
Estimated share of revenue consumed by compliance
Source: Growthmarketreports
| Requirement | Agency | Cost Impact | Operational Effect |
|---|---|---|---|
| Business licensing & occupancy permits | Local city/county governments | 1.5% | Delays lease commencement by 2-8 weeks |
| Sales tax on classes/retail | State departments of revenue | 2% | Requires POS system integration |
| Employment tax compliance | IRS & state labor agencies | 4% | Mandates payroll software adoption |
| Wage/hour compliance | U.S. DOL & state labor depts | 3% | Instructor scheduling complexity |
| Health/safety standards | OSHA & local health authorities | 1% | Daily equipment sanitation protocols |
| Franchise disclosure rules | FTC & state regulators | 2.5% | Adds $15-25K legal costs for franchised units |
The policy outlook remains stable, though Barre Diary notes pending legislation in 12 states could reclassify instructors as employees rather than contractors—a shift that would raise labor costs by 18-22% for studios relying on freelance teachers. Municipalities like Houston (houstontx.gov) are streamlining boutique fitness permitting, but fire code updates for high-occupancy group classes remain a pain point.
9. Technology, Risks & Barriers to Entry
Technology Adoption
| Technology | Adoption % | Impact | Timeline |
|---|---|---|---|
| Digital/on-demand classes | 5% | Retention tool, extends reach beyond physical studio | 2023-2026 |
| Membership management software | 85% | Critical for recurring revenue and attendance tracking | Ongoing |
| Livestream hybrid classes | 22% | Enables hybrid fitness habits, fills off-peak slots | 2024-2025 |
| Wearable integration | 12% | Enhances member engagement and data tracking | 2025-2027 |
| AI-driven scheduling | 8% | Optimizes class times and instructor utilization | 2026-2028 |
Industry Risks
| Risk | Severity | Likelihood | Mitigation |
|---|---|---|---|
| Rising occupancy costs | High | High | Negotiate long-term leases, optimize studio footprint |
| Consumer churn | Medium | High | Loyalty programs, community-building activities |
| Franchise consolidation | Medium | Medium | Differentiate with local community engagement |
| Instructor turnover | Medium | Medium | Competitive pay, career development opportunities |
| Economic downturn | High | Low | Offer flexible membership tiers, emphasize value |
| Competition from hybrid fitness models | Medium | High | Emphasize in-person community, specialized offerings |
Barriers to Entry
| Barrier | Height | Detail |
|---|---|---|
| Initial equipment costs | Medium | $37,500 typical startup cost for barre equipment and studio setup |
| Brand recognition | High | Dominance of established brands like Pure Barre (32% market share) |
| Instructor certification | Medium | Specialized training required for barre instructors |
| Location competition | High | Prime urban locations dominated by franchises and established studios |
| Customer acquisition costs | High | High marketing spend needed to compete in crowded boutique fitness market |
Key Insight: While technology adoption is accelerating (particularly in digital offerings), the barre studio industry remains heavily dependent on physical locations and community-building. The impending consolidation wave (2025-2026) suggests independents must either differentiate sharply or face acquisition pressure from larger players.
10. Outlook & Investment Opportunities
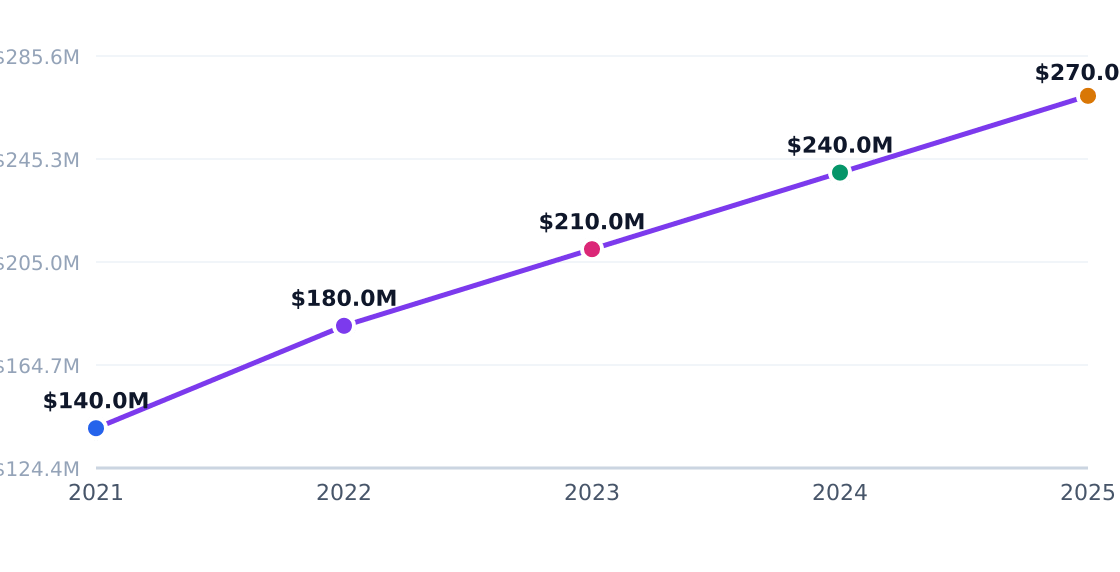
The US barre fitness studio market is projected to grow from $720M to $953M by 2028, driven by an 8.1% CAGR according to Barre Studio Market Research. This growth trajectory positions barre as one of the faster-growing boutique fitness segments, though with notable concentration risks as franchised chains expand.
Market Size Trajectory
| Year | Market Size | Growth Driver |
|---|---|---|
| 2024 | $720M | Base year |
| 2025 | $778M | Franchise expansion |
| 2026 | $842M | Corporate wellness partnerships |
| 2027 | $910M | Hybrid digital-physical models |
| 2028 | $953M | Market saturation in urban cores |
Investment Opportunities & Risks
| Opportunity | Market Size | Risk | Time Horizon |
|---|---|---|---|
| Neighborhood studios in secondary cities | $137K SOM | Local competition | 3 years |
| Corporate wellness programs | $50M+ | Sales cycle length | 2-5 years |
| Hybrid membership models | $36M digital segment | Churn rates | 1-3 years |
| Specialized barre formats (prenatal, rehab) | $72M | Narrow audience | 3-5 years |
| Consolidation of independents | $150M+ | Integration costs | 2025-2026 |
| Retail merchandise expansion | $36M | Inventory risk | 1-2 years |
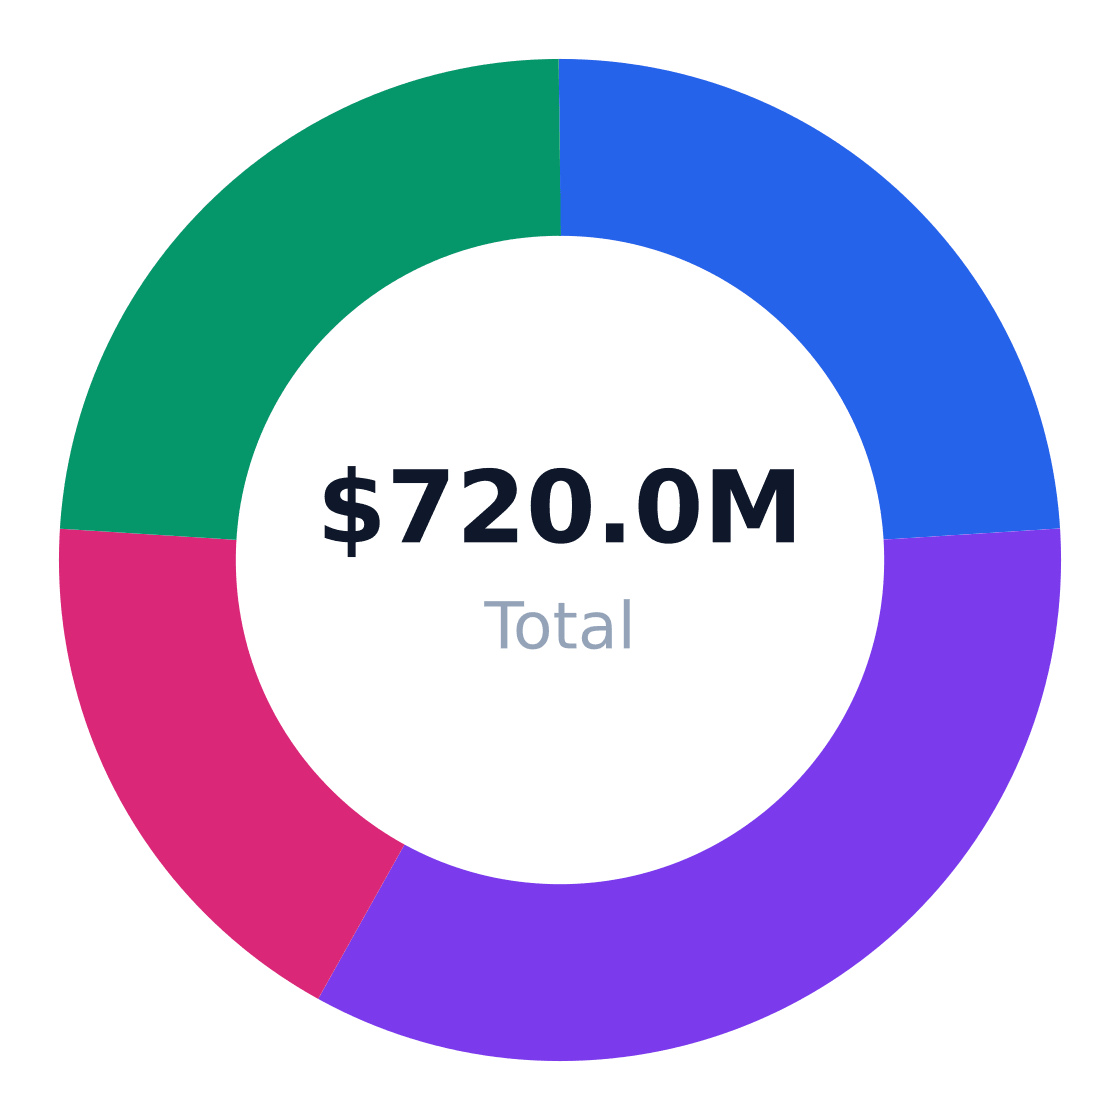
Regional Market Distribution
Revenue share by US region
Source: Growthmarketreports
Strategic Recommendations
- Target neighborhoods with ≥5,700 adults aged 20-54 (per Houston Midtown demographics) to achieve viable SAM
- Structure 55%+ revenue from memberships (industry benchmark per IBBFA) to stabilize cash flow
- Differentiate through specialized formats like rehab barre (growing at 8.5% vs. 7.8% for standard classes)
- Limit buildout costs to ≤$37,500 per Verified Market Research equipment benchmarks
- Monitor consolidation trends highlighted in The Great Barre Roll-Up for exit opportunities
- Maintain 10%+ operating margins by controlling rent (<12% of revenue) and labor (<30%)
Verdict: The barre studio market offers durable growth but requires disciplined unit economics. New entrants should target $223,200+ annual revenue per location (industry average) with ≥40% gross margins to compete against franchised chains like Pure Barre (32% share). Differentiate through hyperlocal community engagement or specialized programming to avoid becoming another generic boutique.
Industry Research & Resources
The following industry databases and research resources support this barre fitness studio industry analysis. Each link opens a specific report or data page (not a generic homepage).
- Barre Studio Market — growthmarketreports.com — Published industry research for barre fitness studio
- Barre Statistics — ibbfa.org — Published industry research for barre fitness studio
- houstontx.gov — houstontx.gov — Published industry research for barre fitness studio
- The Great Barre Roll Up M A And Consolidation 2025 2026 — barrediary.com — Published industry research for barre fitness studio
- Barre Market — verifiedmarketresearch.com — Published industry research for barre fitness studio
Data Sources & Methodology
Market sizing (TAM, SAM, SOM), segmentation, competition, and equipment data come from Perplexity-sourced industry reports and trade publications. Optional U.S. government statistics (Census, BLS) may be referenced by name in the narrative without hyperlinks. TAM reflects the total U.S. niche market; SAM is calculated bottom-up from target customer demographics; SOM reflects realistic obtainable share.
Industry research links: Barre Studio Market Research Report 2033 · City of Houston Midtown demographic profile; barre class pricing benchmarks from barre studio market coverage · ibbfa.org · houstontx.gov · barrediary.com · barrediary.com · barrediary.com · verifiedmarketresearch.com · metastatinsight.com · barrediary.com · niche.com · neilsberg.com · kitsunepass.com · houstontx.gov · houstontx.gov · fitsupply.com · precor.com · johnsonfitness.com · squareup.com · paypal.com · barrenearby.com · self.com · dataintelo.com · classpass.com · popsugar.com · thebarreblog.com · thefitguide.com · peeptown.com · atly.com · barmethod.com
Get Your Copy Today
Download Barre Fitness Studio Business Plan
Just Fill Up and Print