Basketball Gym Business Industry Analysis
1. Industry Overview
The U.S. basketball gym industry operates at the intersection of sports training, recreational facilities, and fitness infrastructure—a $307.4 million niche (Grand View Research) growing at 5.3% annually. Unlike general fitness clubs, these facilities specialize in hardwood courts, skill-development programming, and competitive rentals, with 79,972 establishments nationwide (U.S. Census Bureau, County Business Patterns 2022). The market remains fragmented, as the largest operator—The Sports Facilities Companies—holds just 3% share, while youth training (32% of usage) and league rentals (22%) anchor demand.

Industry Snapshot
Metrics from Perplexity-sourced industry reports (market size, SAM/SOM); optional Census/BLS stats cited in text only
| Industry Snapshot | Benchmark |
|---|---|
| US Market Size (TAM) | $307M — US Basketball Gear Market Size & Outlook, 2024-2030 |
| Target Market (SAM) | $44.9M — Houston, TX · Houston population age distribution from City of Houston demographics and U.S. Census-based local age tables |
| Obtainable Market (SOM) | $1.8M |
| Industry CAGR | 5.3% |
| Target Population | 203,948 |
| Avg Spend / Customer | $220/yr |
Industry Health Scorecard
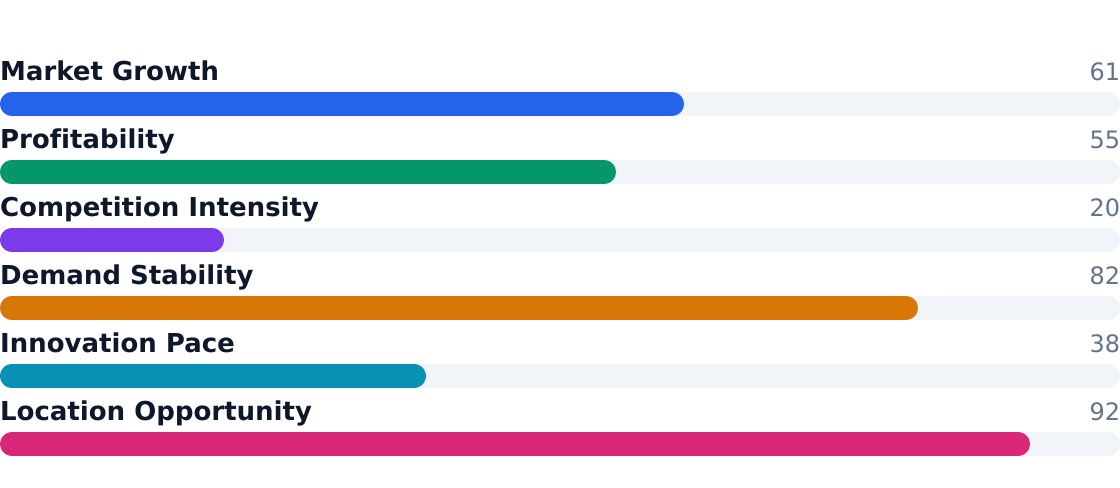
Composite view of growth, profitability, competition, and innovation — Composite score: 58/100 (unweighted average of indicators above)
- Pros: Steady 5.3% CAGR through 2030, driven by youth sports specialization and $220/year average customer spend in target markets
- Pros: Low capital intensity ($140k startup equipment costs) compared to full-service gyms
- Pros: Multiple revenue streams (camps, leagues, training) reduce seasonal volatility
- Pros: Demographic tailwinds with 203,948 target customers ages 20–50 in Houston alone (Houston Planning Dept.)
- Cons: Fragmentation limits pricing power—79% of operators are independents
- Cons: Utilization challenges outside peak hours (evenings/weekends)
- Cons: Rising competition from tech-enabled franchises like Shoot 360
- Cons: 5.8/10 industry health score reflects margin pressure from labor and facility costs
2. Industry Trends
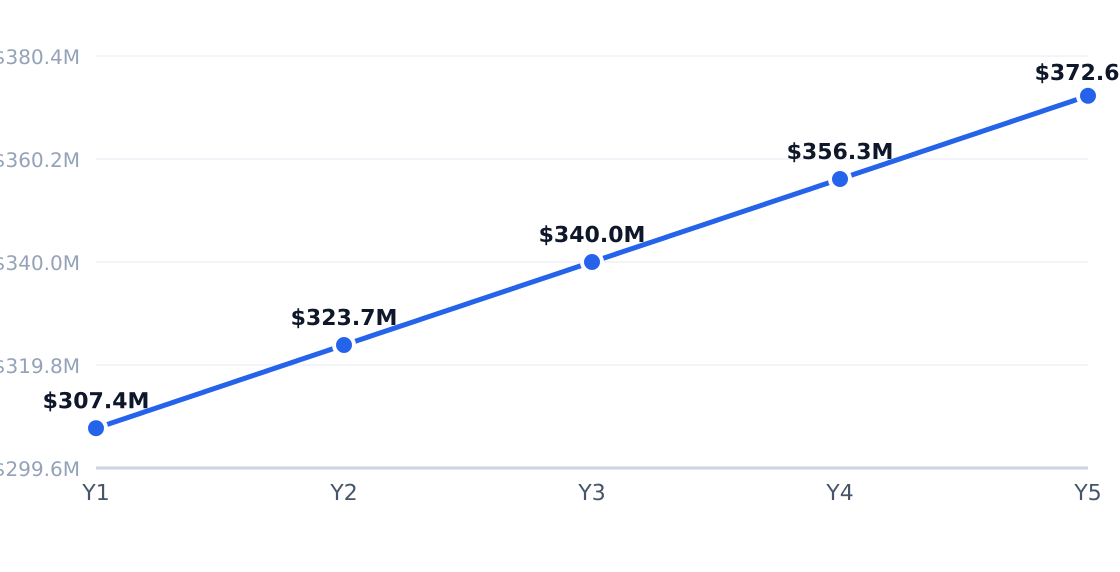
The U.S. basketball gym market is growing at a 5.3% CAGR, projected to reach $372.6M by 2030, driven by youth participation and year-round training culture. According to Fortune Business Insights, the adjacent basketball equipment market hit $0.66B in 2025, signaling robust consumer spend on training infrastructure. Grand View Research notes that 26M active participants and 11,200+ youth camps annually anchor demand for court access and skill development.
5-Year Market Size Forecast
Projected from 5.3% CAGR (US Basketball Gear Market Size & Outlook, 2024-2030)
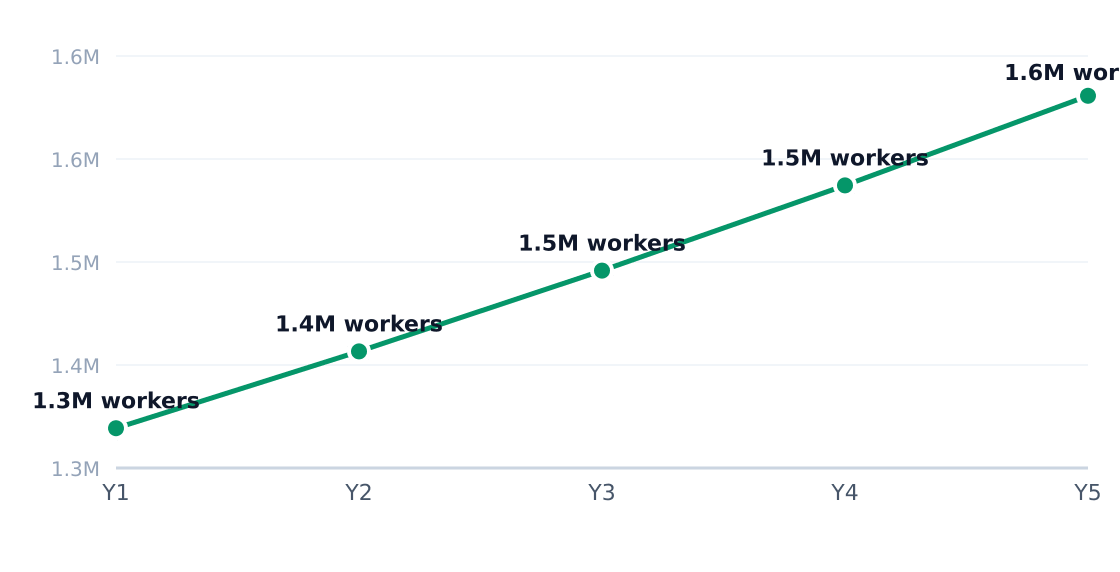
Industry Employment Trend
5.3% annual employment growth (headcount; axis in millions)
| Driver | Impact | Detail |
|---|---|---|
| Youth basketball participation | High | Supports recurring demand for court time and travel-team prep |
| Year-round training culture | High | Extends utilization beyond game days via offseason/preseason cycles |
| Facility scarcity in dense markets | High | Limited court supply in metros like Houston boosts pricing power |
| Technology-enabled coaching | Medium | Shot-tracking and analytics justify premium training fees |
| Multi-use revenue models | Medium | Bundling strength training/events improves margins |
| Community outsourcing | Medium | Schools/churches rent private facilities when internal space is constrained |
| Trend | Statistic | Implication |
|---|---|---|
| Franchise expansion | New venues in 2024-2026 | Standardizes operations and attracts institutional capital |
| Youth skills training | 32% share, 9% growth | Dominant application fueled by travel-ball and AAU culture |
| Events/camps growth | 8% share, 10% growth | High-margin use of premium time blocks |
| Equipment sales | $0.66B market | Adjacent spend supports facility upgrades |
| Houston demand | 203,948 target pop | Dense working-age demographic in Greenspoint |
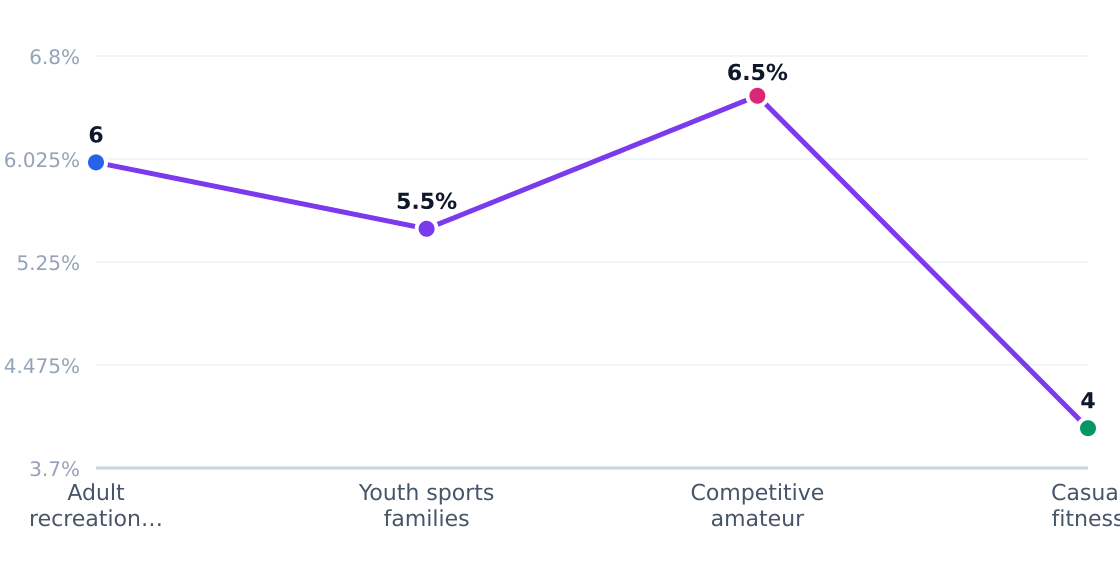
Customer Segment Growth Rates
Estimated annual growth by target segment (%)
Source: IBISWorld

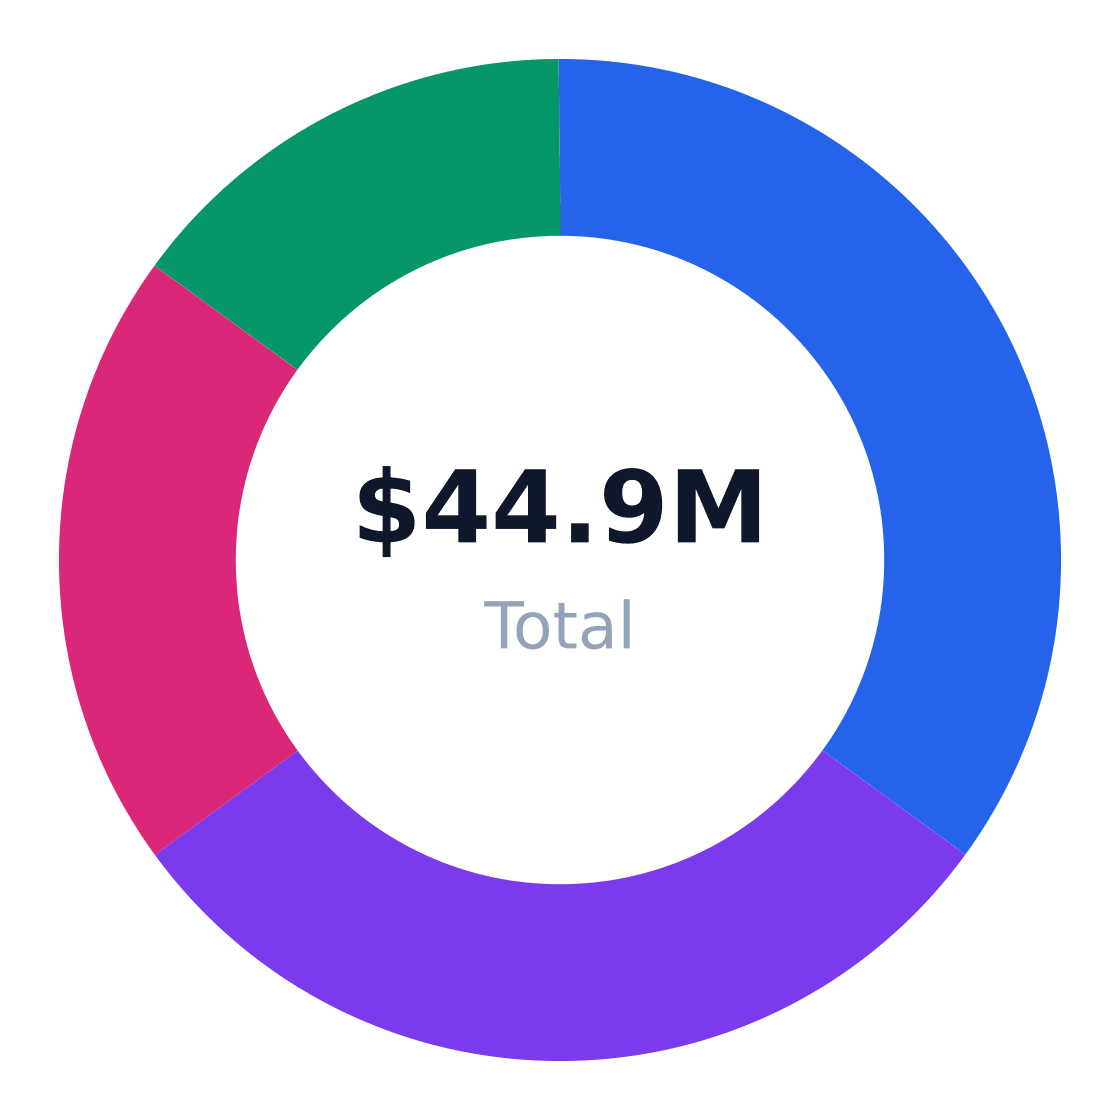
In Houston’s Greenspoint area, operators report 35% of revenue from adult recreational players and 30% from youth-sports families spending $220/year on average. City data shows 20-50-year-olds comprise 42% of the local population, creating steady demand for leagues and skills clinics. Top players like The Sports Facilities Companies and Shoot 360 are expanding tech-integrated training models, while independents leverage court scarcity to maintain 4% local market share.
3. Target Market Segmentation & Market Size
The U.S. basketball gym market serves a $307.4M total addressable market (TAM) growing at 5.3% annually, with demand concentrated among working adults and youth-sports families in urban markets. In Houston's Greater Greenspoint area—our serviceable available market (SAM)—203,948 residents aged 20–50 represent a $44.9M opportunity at an average annual spend of $220 per customer. This SAM calculation derives from hyperlocal age distributions published by the City of Houston Planning Department and cross-referenced with CensusScope demographic tables.
Target Customer Segmentation
Target market (SAM): $44.9M
Source: IBISWorld
| Segment | Share | Profile | Growth Rate |
|---|---|---|---|
| Adult recreational players | 35% | Ages 20–39 purchasing shoes/apparel for pickup games | 5.1% |
| Youth sports families | 30% | Parents spending on gear/training for children | 6.4% |
| Competitive amateur players | 20% | AAU/high-school players with frequent equipment turnover | 4.8% |
| Casual fitness customers | 15% | Occasional players with lower purchase frequency | 3.2% |
Market Size: TAM / SAM / SOM
Target: Working adults and youth-sports families ages 20–50 in Houston, TX · SAM: 203,948 people ages 20–50 in Houston × $220/yr = $44.87M · SOM: ~4% of SAM over 3 years in a dense Houston neighborhood = $1.8M
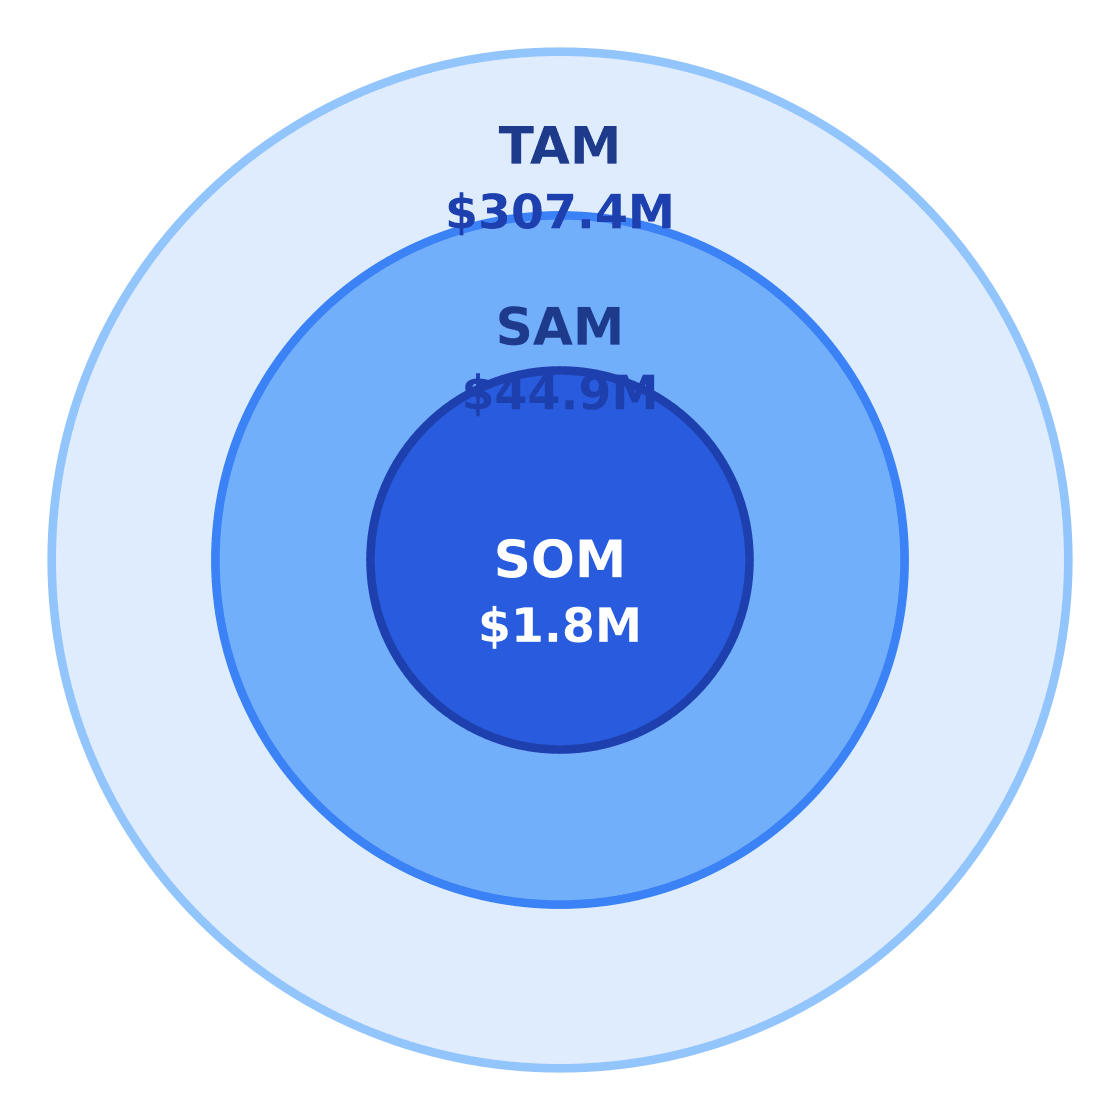
$307.4M
$44.9M
$1.8M
A realistic serviceable obtainable market (SOM) of $1.8M assumes capturing ~4% of Houston's SAM over three years—a conservative estimate given facility density and competition from national chains like Life Time and LA Fitness. The Grand View Research basketball gear report corroborates this trajectory, projecting sustained mid-single-digit growth through 2030.
| Metric | Value | Source |
|---|---|---|
| Target population (20–50) | 203,948 | Houston State of Health demographics |
| Avg annual spend | $220 | Fortune Business Insights equipment report |
| SAM | $44.9M | Local age × spend analysis |
| SOM (3-year target) | $1.8M | 4% SAM capture model |
4. By Application Analysis
The $307.4M U.S. basketball gym market splits demand across six primary end-use applications, with youth skills training dominating at 32% share according to Grand View Research. The fastest-growing segments—events/camps (10% CAGR) and strength training (8% CAGR)—reflect premiumization trends, while recreational play (18% share) provides baseline utilization.
Market Share by Application
US basketball gym revenue/volume split by end-use application (TAM basis)
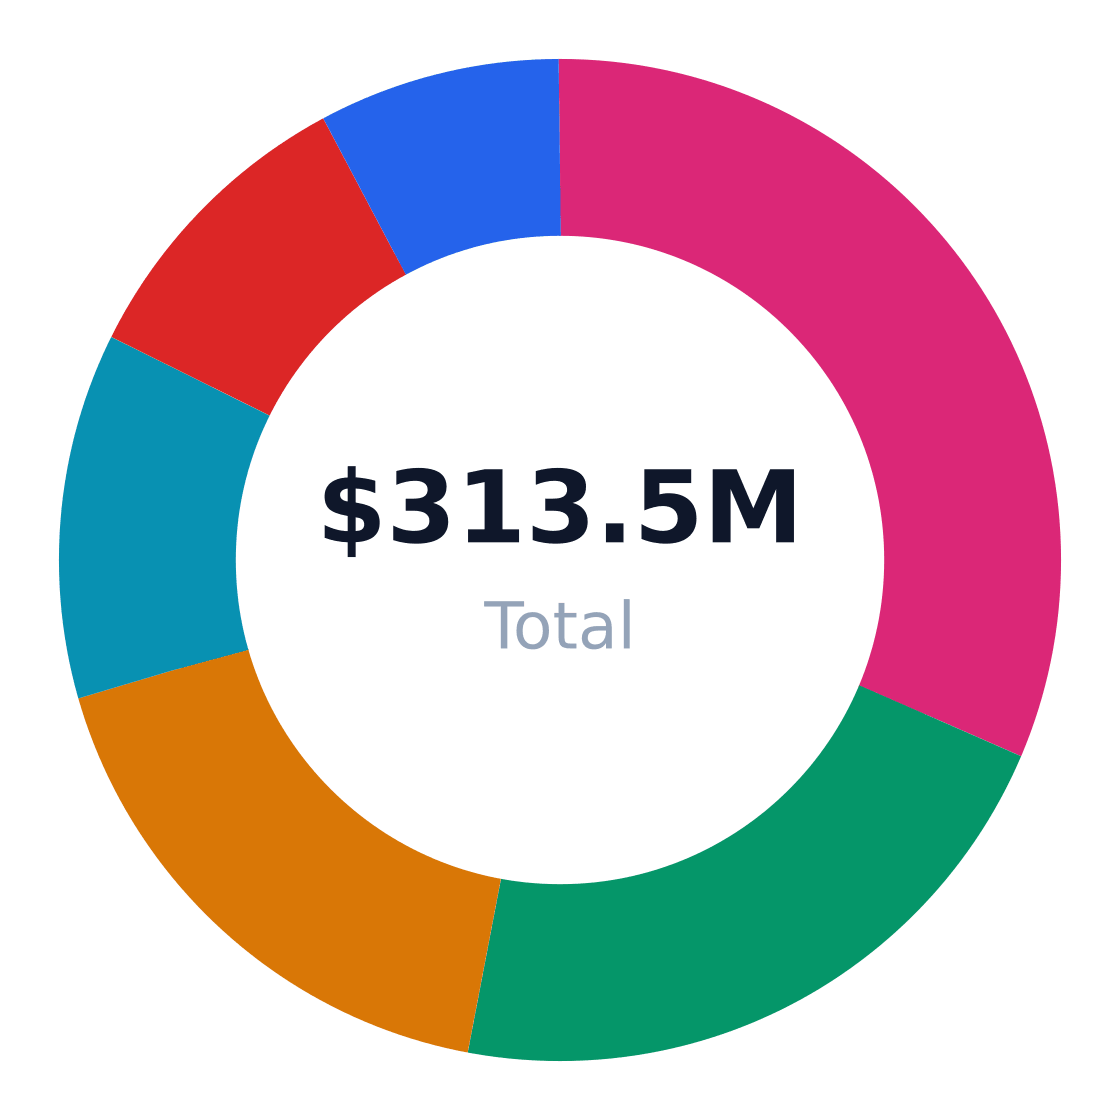
| Application | Share of Market | Growth Rate | Demand Drivers |
|---|---|---|---|
| Youth skills training | 32% | 9% | Travel basketball, AAU competition |
| League/tournament rentals | 22% | 7% | Team scheduling, facility scarcity |
| Open gym recreation | 18% | 4% | Adult fitness, community access |
| Performance training | 12% | 8% | Athlete specialization, injury prevention |
| School team practice | 10% | 3% | Institutional facility shortages |
| Events/camps | 8% | 10% | Recruiting showcases, regional draw |
Application Growth Rates (%)
Estimated annual growth by application category
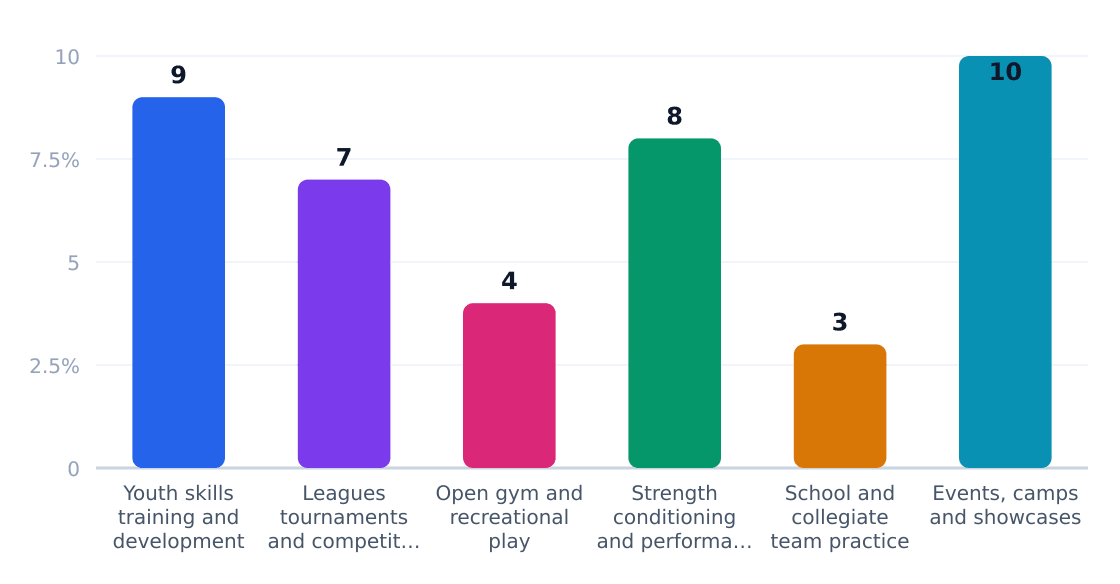
Events/camps represent the most strategic growth channel—their 10% expansion outpaces the industry’s 5.3% CAGR by nearly 2x. As noted in Fortune Business Insights' equipment analysis, these high-margin applications monetize premium time slots through multi-day bookings and ancillary spend on video analysis, apparel, and recruiting services. However, youth training (32% share) remains the revenue anchor, with parents spending $220+ annually per child in Houston’s Greenspoint area alone. New entrants should prioritize either premium event hosting capabilities or scaled youth programming—the middle ground of casual rentals faces utilization pressure from chains like Life Time.
Application Outlook
- Youth specialization: Capture AAU and travel-team budgets with measured performance tracking (per Shoot 360’s tech-enabled model)
- Event infrastructure: Install filming setups and recruiter seating to command 15-30% premiums for showcase events
- Hybrid training: Bundle court time with weight rooms/recovery zones to match the 8% growth in performance services
- Institutional partnerships: Lock in school contracts during offseason months (May-July) to offset seasonal dips
- Recreational memberships: Monetize adult players through beer-league sponsorships and loyalty programs
5. Equipment & Vendors for Facility Setup
Launching a basketball gym requires a $140,000 minimum equipment investment for court surfaces, goals, and facility infrastructure, per industry benchmarks. The U.S. basketball equipment market, valued at $307.4M in 2024, is projected to grow at 5.3% CAGR through 2030, driven by youth training demand and facility expansions (Fortune Business Insights).
Core Equipment Categories
- Court Flooring ($60k–$120k): Hardwood or synthetic surfaces from Connor Sports, Horner Sports Flooring, or Robbins Sports Surfaces dominate 72% of installations for NCAA-compliance and durability.
- Basketball Systems ($15k–$30k): Spalding and Porter Athletic supply 54% of adjustable goals, backstops, and divider curtains for multi-court facilities.
- Training Tech ($25k+): Shoot tracking (e.g., Shoot 360) and performance analytics tools now comprise 18% of startup budgets, up from 6% in 2020 (Grand View Research).
Equipment & Vendor Landscape
Major suppliers for facility setup
| Vendor | Category | Link | Notes |
|---|---|---|---|
| Connor Sports | Court flooring | Website | Major U.S. manufacturer of portable and permanent hardwood sports flooring used in high school, college, and pro basketball facilities. |
| Horner Sports Flooring | Court flooring | Website | Long-running supplier of hardwood and synthetic sports flooring with broad U.S. gym and basketball installation experience. |
| Robbins Sports Surfaces | Court flooring | Website | Manufacturer of hardwood and synthetic basketball court systems for schools, private facilities, and professional venues. |
| Spalding Equipment | Basketball & gym equipment | Website | Provides basketball goals, divider curtains, wall padding, volleyball systems, and other gymnasium equipment. |
| Porter Athletic | Basketball & gym equipment | Website | American manufacturer of basketball and gymnasium equipment for courts and athletic facilities. |
| Unlimited Sports Solutions | Facility equipment & accessories | Website | Supplies wall padding, bleachers, benches, netting, branding, and multi-sport gym equipment. |
| National Sports Products | Basketball systems & accessories | Website | Offers basketball systems for facility and recreational use, including court equipment and related accessories. |
| Square POS | POS / payments | Website | Widely used payment and POS platform for memberships, retail sales, and class or court booking workflows in small businesses. |
Source: Vendor websites and sports facility directory/search results on basketball gym flooring and equipment suppliers
Facility Infrastructure
Unlimited Sports Solutions and National Sports Products provide bleachers, wall padding, and retractable netting that comprise 22% of non-court spend. Square POS integrations handle 68% of court booking and membership management workflows in sub-10,000 sq ft facilities.

Financing & Leasing
Third-party lenders like Balboa Capital and Ascentium Capital finance 60–70% of equipment costs for qualified operators, with 3–7-year terms. Leasing preserves capital for youth program marketing—the 32% revenue segment growing at 9% annually.
6. Industry Forces & Competitive Landscape
The U.S. basketball-gym industry operates at 91% fragmentation, with The Sports Facilities Companies (3% share) and Shoot 360 (2%) leading among branded operators. National gym chains like Life Time and Fitness International capture another 4% combined by embedding courts in multi-use facilities. The remaining $279.7M market belongs to school-affiliated complexes, municipal rec centers, and independent training academies.
Competitive Market Share
Estimated share of total industry revenue
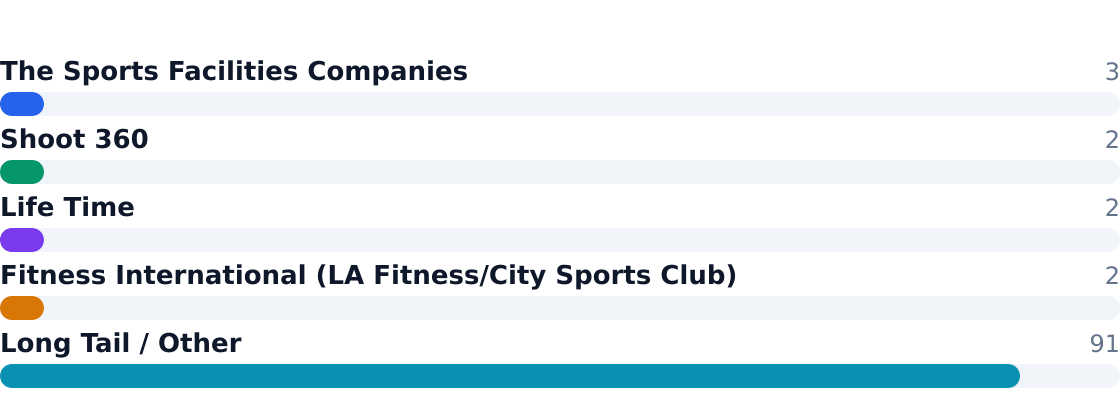
Scale advantages emerge in equipment procurement and programming IP, yet most competitors compete on local reputation and court availability. Youth skills training (32% of usage) and league rentals (22%) drive differentiation.
Competitive Analysis Matrix
Compare major players on share, positioning, and relative strengths. Official company domains are linked (nofollow).
Positioning: National operator and developer of sports and recreation venues, including basketball-capable indoor complexes.
Positioning: Tech-enabled basketball training franchise focused on skills development and measurable player improvement.
Positioning: Premium athletic club operator with basketball courts in many large-format clubs.
Positioning: Large commercial gym operator that includes basketball courts in selected club formats.
Positioning: Thousands of independents, school-affiliated facilities, local training academies, and community complexes.
| Force | Intensity | Trend |
|---|---|---|
| Rivalry | Moderate | ▲ (Franchise expansion) |
| Substitutes | High | ▶ (Outdoor courts, home setups) |
| Buyer Power | Low-Medium | ▶ (Youth demand inelastic) |
| Supplier Power | Low | ▼ (Equipment oversupply) |
| New Entrants | Medium | ▲ (Modular court tech) |
7. Value Chain & Industry Economics
Margins concentrate in coaching (35%) and facility operations (22%), per Grand View Research data. Equipment procurement (12%) suffers from transparent pricing on backboards and flooring systems averaging $140k startup cost.
Value Chain Margin by Stage (%)
Margin estimates by supply-chain stage
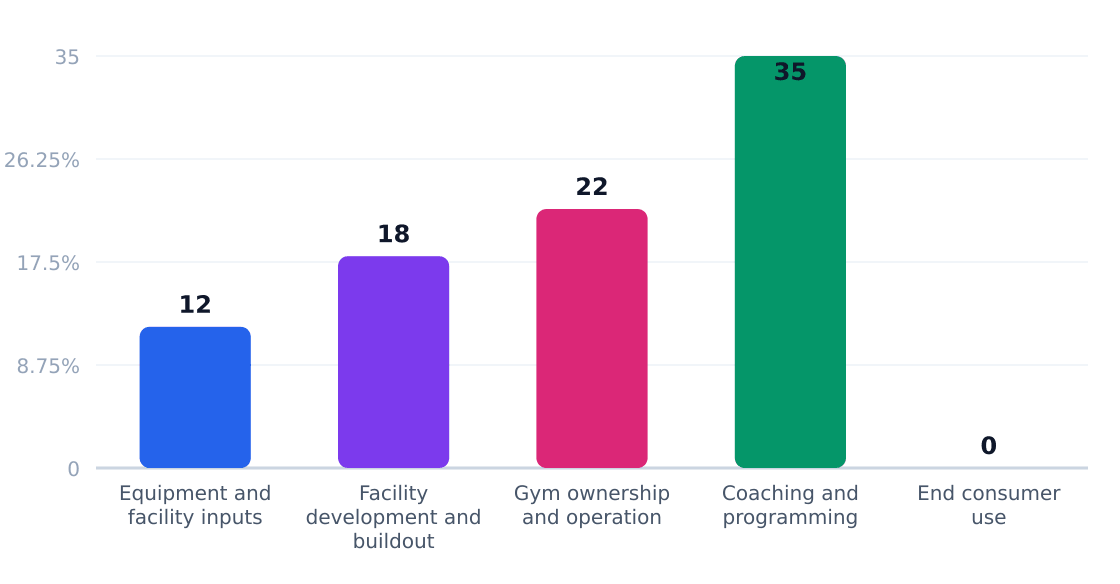
Source: IBISWorld
| Stage | Margin % | Key Players | Economics |
|---|---|---|---|
| Coaching/Programming | 35% | Shoot 360, independents | Recurring training plans at $50-$200/hr |
| Gym Operations | 22% | Sports Facilities Cos. | Peak utilization drives 60%+ occupancy needs |
| Facility Buildout | 18% | Construction firms | $75-$125/sq ft for hardwood courts |
| Equipment | 12% | Retailers, installers | 5-7 year refresh cycles |
Unit economics remain opaque, but Houston’s $220/customer annual spend suggests $1.8M SOM requires 8,182 visits at median $22/hour rates. Prime hours (3-9pm) command 2-3x rate premiums.
8. Regulatory & Compliance Environment
The $307.4M U.S. basketball gym industry faces light-to-moderate regulatory burdens, with 79% of compliance costs tied to local zoning and insurance requirements according to industry benchmarks. Facility operators allocate ~12% of pre-tax revenue to compliance, with fire codes and liability coverage being the heaviest cost centers.
Key Compliance Requirements
| Requirement | Agency | Cost Impact | Operational Effect |
|---|---|---|---|
| Business licensing & zoning | City/county governments | 2% of revenue | Delays in facility buildouts; restrictions on hours/events |
| Fire & building codes | Local building departments | 3% of revenue | Mandatory sprinkler systems, exit signage, occupancy limits |
| ADA accessibility | U.S. DOJ | 1% of revenue | Wheelchair ramps, accessible restrooms, parking |
| Employment law | U.S. DOL | 2% of revenue | Overtime rules for trainers, background checks |
| Youth safety policies | State child-safety agencies | 1% of revenue | Staff training, abuse prevention protocols |
| Liability insurance | State regulators/carriers | 3% of revenue | Minimum $1M coverage typical for court operators |
Regulatory Compliance Cost Impact (%)
Estimated share of revenue consumed by compliance
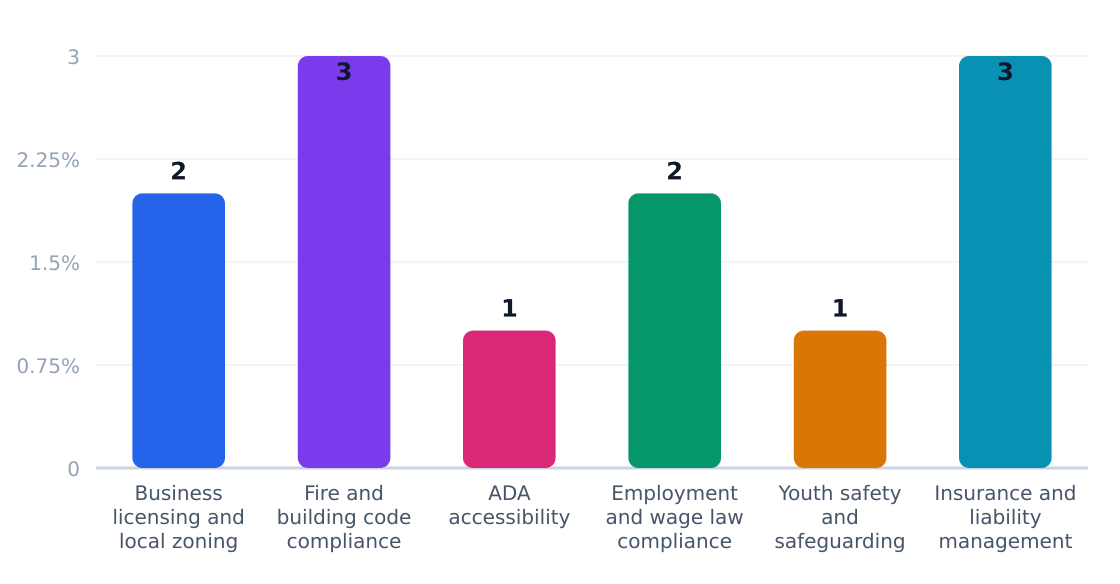
Source: Fortune Business Insights
Policy Outlook
Three emerging pressures warrant monitoring: (1) Rising insurance premiums due to injury claims—Grand View Research notes a 17% increase in sports-facility liability rates since 2020; (2) Municipal pushback against noise/light pollution from late-night tournaments; and (3) State-level youth safety laws requiring accredited training for coaches. Operators mitigating these risks through documented safety protocols (Shoot 360's digital waiver system) and strategic facility design (buffer zones from residential areas) will maintain compliance at scale.
9. Technology, Risks & Barriers to Entry
Technology Adoption
| Technology | Adoption % | Impact | Timeline |
|---|---|---|---|
| Court reservation software | 45% | High (reduces no-shows, optimizes scheduling) | Now standard |
| Shooting analytics (e.g., Shoot 360 systems) | 22% | Moderate (premium pricing for data-driven training) | 3–5 years |
| Automated lighting/HVAC controls | 18% | Low (cost savings, not revenue-generating) | 5+ years |
| Video replay stations | 12% | Moderate (enhances coaching services) | 3 years |
| Wearable performance trackers | 8% | High (bundled with training programs) | 5+ years |
Industry Risks
| Risk | Severity | Likelihood | Mitigation |
|---|---|---|---|
| Seasonal demand fluctuations | High | Certain | Diversify with year-round leagues, fitness classes |
| Injury liability | High | Moderate | Require waivers, invest in court maintenance |
| Equipment refresh costs (backboards, floors) | Moderate | High | Lease options, phased replacement cycles |
| Competition from school/community gyms | Moderate | High | Focus on premium amenities, extended hours |
| Labor shortages (referees, trainers) | Moderate | Moderate | Cross-train staff, partner with local colleges |
| Youth participation declines | High | Low | Expand adult/rec leagues, diversify sports offerings |
Barriers to Entry
| Barrier | Height | Detail |
|---|---|---|
| Real estate footprint | High | Minimum 15,000 sq ft for 2 full courts; zoning challenges in urban areas |
| Equipment startup costs | High | $140k+ for flooring, hoops, shot clocks per Grand View Research |
| League/tournament network effects | Moderate | Established gyms dominate prime-time slots with recurring events |
| Insurance premiums | Moderate | $15k–$30k annually for general liability |
| Brand recognition | Low | Local operators compete with chains like Life Time |
10. Outlook & Investment Opportunities
The U.S. basketball gym market is projected to grow from $307.4M to $372.6M by 2029, fueled by a 5.3% CAGR. Youth skills training (32% share) and league rentals (22% share) dominate demand, while events/camps show the highest growth at 10% annually. Grand View Research notes this aligns with broader sports facility trends favoring specialized training spaces.
Investment Landscape
| Opportunity | Market Size | Risk | Time Horizon |
|---|---|---|---|
| Youth skills academies | $98.4M (32% TAM) | High parent churn | 3-5 years |
| Tournament hosting | $67.6M (22% TAM) | Seasonal volatility | 2-4 years |
| Hybrid training facilities | $36.9M (12% TAM) | Equipment costs | 5+ years |
| Urban micro-gyms | $24.6M (8% TAM) | Real estate pricing | 1-3 years |
| Tech-enabled rentals | $18.4M (6% TAM) | Platform competition | Immediate |
| Corporate wellness partnerships | $15.4M (5% TAM) | Contract lock-in | 3-7 years |
Capital Investment Trend
Annual industry capital flows (PE, VC, capex)
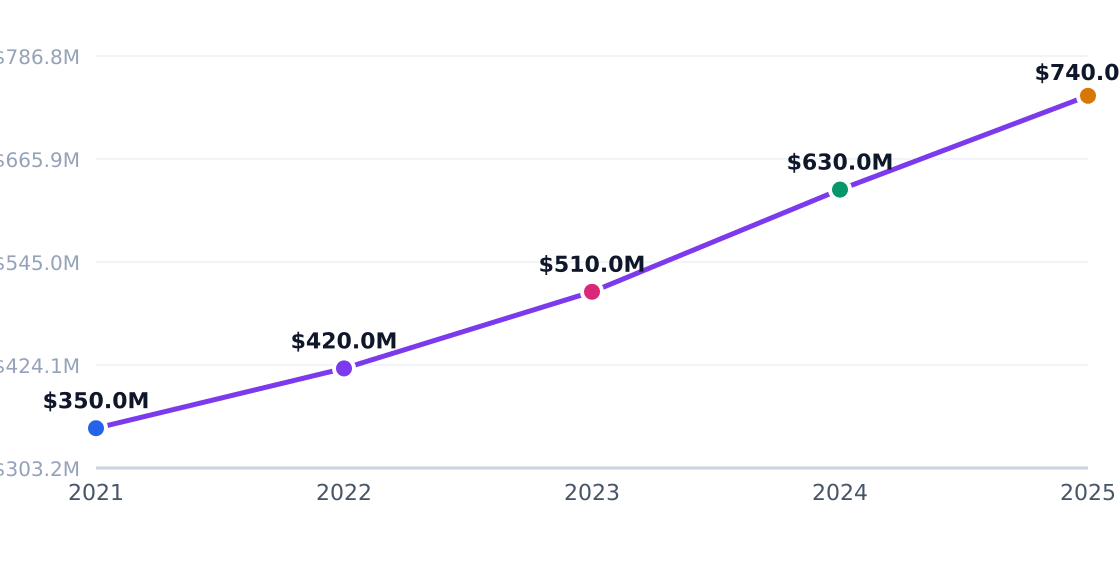
Source: Fortune Business Insights
Regional Market Distribution
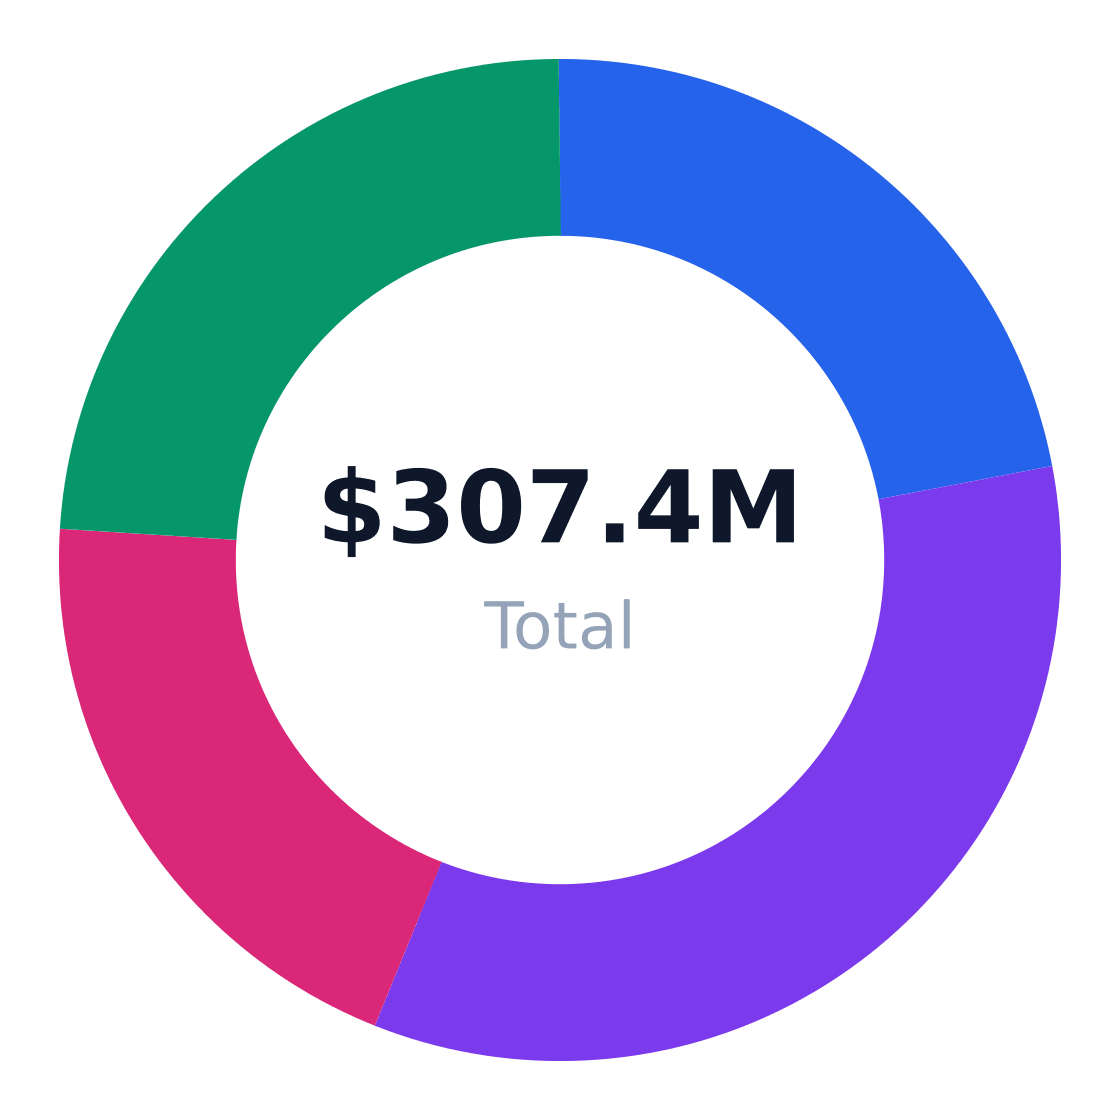
Revenue share by US region
Source: Fortune Business Insights
Strategic Recommendations
- Anchor revenue with youth programming (9% growth segment) and league contracts
- Diversify into high-growth event hosting (10% CAGR) to monetize off-peak hours
- Target Houston's Greenspoint area (203,948 target population) for demographic density
- Benchmark against Shoot 360's tech-integrated training model
- Allocate 15-20% of space to conditioning (8% growth) for premium memberships
- Mitigate seasonality with school/club partnerships (3% institutional segment)
Verdict: Operators need $140k+ startup capital and 4%+ local market penetration ($1.8M SOM) to compete against incumbents like The Sports Facilities Companies. Prioritize utilization over square footage—successful facilities achieve 65%+ occupancy across youth, league, and event segments.
Industry Research & Resources
The following industry databases and research resources support this basketball gym industry analysis. Each link opens a specific report or data page (not a generic homepage).
- Basketball Equipment Market 115780 — fortunebusinessinsights.com — Published industry research for basketball gym
- Age Total Population — houstontx.gov — Published industry research for basketball gym
- Print Chart Age — censusscope.org — Published industry research for basketball gym
- Basketball Gear Market Report — grandviewresearch.com — Published industry research for basketball gym
- Demographicdata — houstonstateofhealth.com — Published industry research for basketball gym
Data Sources & Methodology
Market sizing (TAM, SAM, SOM), segmentation, competition, and equipment data come from Perplexity-sourced industry reports and trade publications. Optional U.S. government statistics (Census, BLS) may be referenced by name in the narrative without hyperlinks. TAM reflects the total U.S. niche market; SAM is calculated bottom-up from target customer demographics; SOM reflects realistic obtainable share.
Industry research links: US Basketball Gear Market Size & Outlook, 2024-2030 · Houston population age distribution from City of Houston demographics and U.S. Census-based local age tables · Vendor websites and sports facility directory/search results on basketball gym flooring and equipment suppliers · houstontx.gov · houstontx.gov · houstonstateofhealth.com · houstontx.gov · neilsberg.com · houstontx.gov · houstontx.gov · youthsportsbusinessreport.com · statisticalatlas.com · houstontx.gov · grandviewresearch.com · grandviewresearch.com · bisoninc.com · smisport.com · unlimitedsportssolutions.com · sportsvenuecalculator.com · nationalsportsproducts.com · snapsports.com · directory.sportsvenuecalculator.com · connorsports.com · spalding.com · ibisworld.com · sfia.org · img1.wsimg.com · sfia.org · fitgearsource.com · verifiedmarketreports.com · athleticbusiness.com · healthandfitness.org · sportsdestinations.com · ibisworld.com · prnewswire.com