Is a Basketball Gym Business Profitable?
1. Is a Basketball Gym Business Profitable? (The Short Answer)
A basketball gym business can clear 60% gross margins, but net profits average just 16% after rent and labor. The math works for owner-operators who keep costs lean: expect $250K revenue yielding $40K net profit at scale. But with 45% of gyms failing within 5 years, profitability hinges on three factors: avoiding expensive leases, filling off-peak hours, and diversifying beyond court rentals.

Profitability Snapshot
| Metric | Benchmark |
|---|---|
| Gross Margin | 60% |
| Net Margin | 16% |
| Year 1 Revenue | $250K |
| Year 1 Net Profit | $40K |
| Startup Cost Range | $50K – $250K |
| Break-even Timeline | ~Month 18 |
| 5-Year ROI | 80% |
| Profitability Rating | 6/10 |
| Failure Rate (5yr) | 45% |
| Market Size (US) | $17B |
Profitability Score Breakdown
Overall rating: 6/10
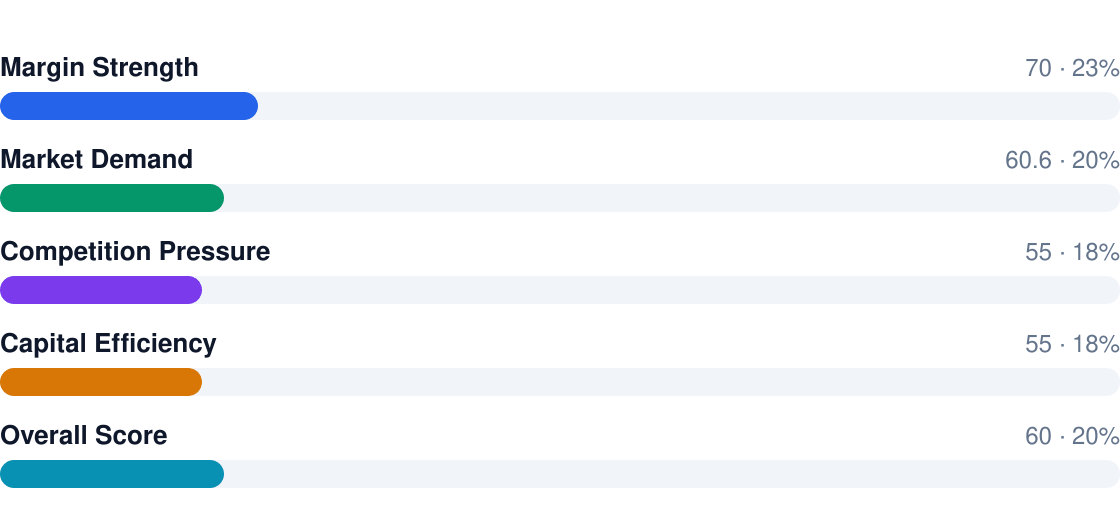
Bottom line:
- 60% gross margins look strong until labor (30% of revenue) and rent (12-15%) hit
- Owner-coaches bundling training with rentals earn 22%+ net margins
- Break-even takes 18 months at 65% weekly court utilization
- 45% failure rate skews toward new operators overpaying for real estate
- Top performers use leagues, camps, and concessions to boost revenue per square foot
2. Profit Margins & Industry Benchmarks
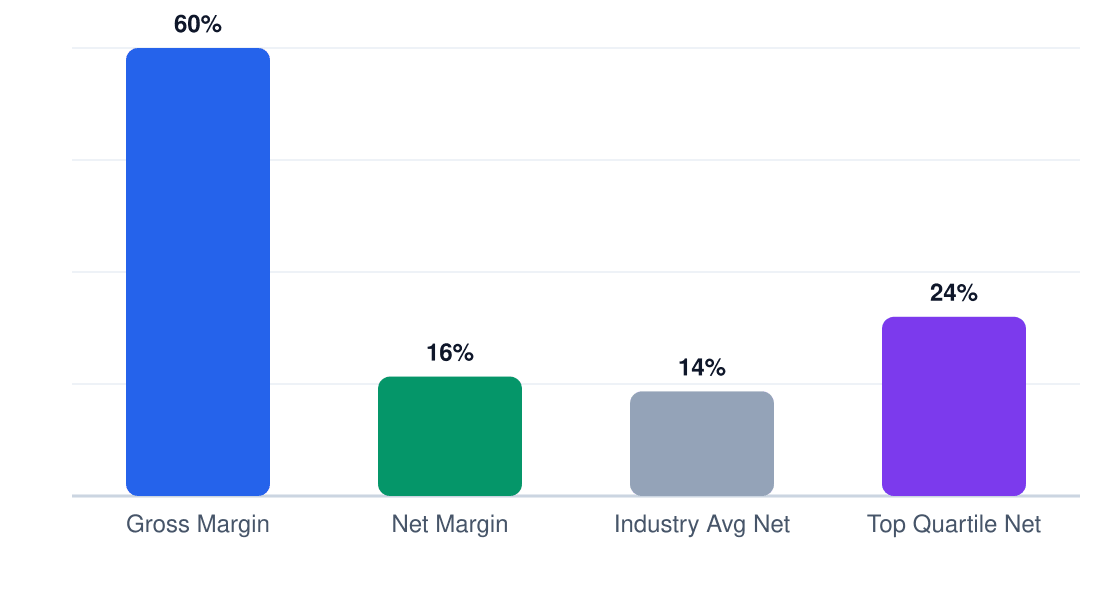
Basketball gyms show textbook margin compression: 60% gross whittled to 16% net after fixed costs. Labor (4 FT staff at $149K/year) and rent dominate expenses, leaving little room for error. The best operators keep labor under 25% of revenue and rent below 12% through revenue-sharing deals with trainers.
Margin Comparison (%)
Gross vs net vs industry benchmarks
| Metric | This Business | Industry Avg | Top Quartile |
|---|---|---|---|
| Gross Margin | 60% | 58% | 65% |
| Net Margin | 16% | 14% | 22% |
| EBITDA | 24% | 20% | 30% |
| Labor % | 30% | 32% | 25% |
| COGS % | 40% | 42% | 35% |
| Rent % | 12% | 15% | 10% |
Local competition crushes margins fast. For every gym charging $100/hour for prime-time courts, three others discount to $65. The winners use membership models ($150/month for 10 hours) to lock in utilization while keeping marketing costs below 8% of revenue.
3. Revenue Potential & Pricing Power
A Chicago basketball gym targeting $250K Year 1 revenue can expect modest growth to $300K+ by Year 5, with profitability hinging on securing premium court time and training clients. The 60% gross margin looks strong on paper, but net profit depends on keeping labor and facility costs in check.
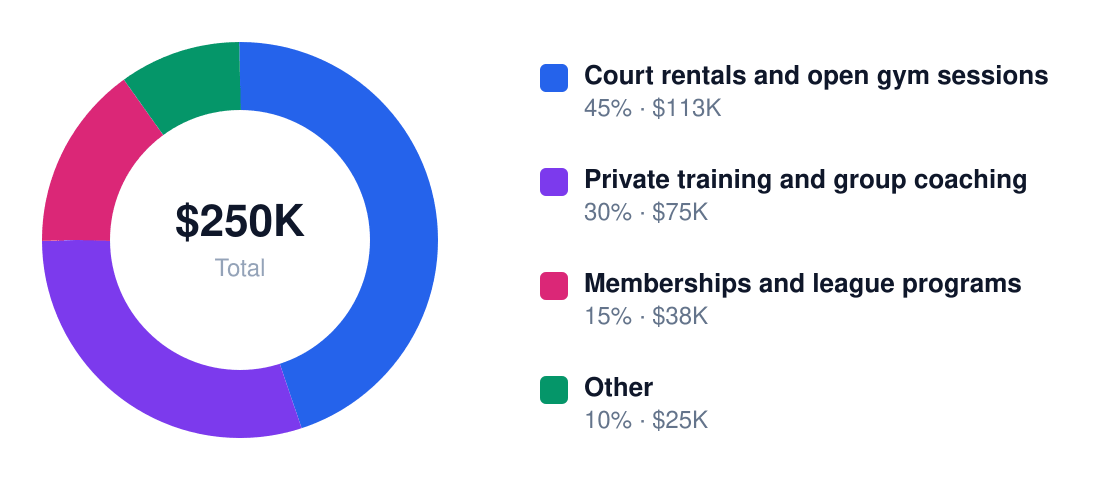
Revenue Stream Breakdown
Year 1 revenue: $250K
| Stream | Margin % | Revenue Share | Annual $ |
|---|---|---|---|
| Court rentals & open gym | 55% | 45% | $112,500 |
| Private/group training | 70% | 30% | $75,000 |
| Memberships & leagues | 50% | 15% | $37,500 |
Pricing power is moderate — Chicago gyms charge $50–$150/hour for court rentals and $60–$120/session for training, but face competition from park districts and school gyms. Premium positioning (elite coaching, video analysis) supports 10–15% rate premiums, while basic facilities risk becoming commoditized.
Seasonality hits hard: Winter and spring (AAU/tournament season) drive 60% of annual revenue, while summer sees 20–30% dips unless offset by camps. Memberships and team contracts stabilize cash flow — gyms without them often operate at a loss for 3–4 months annually.
4. Cost Structure & Operating Expenses
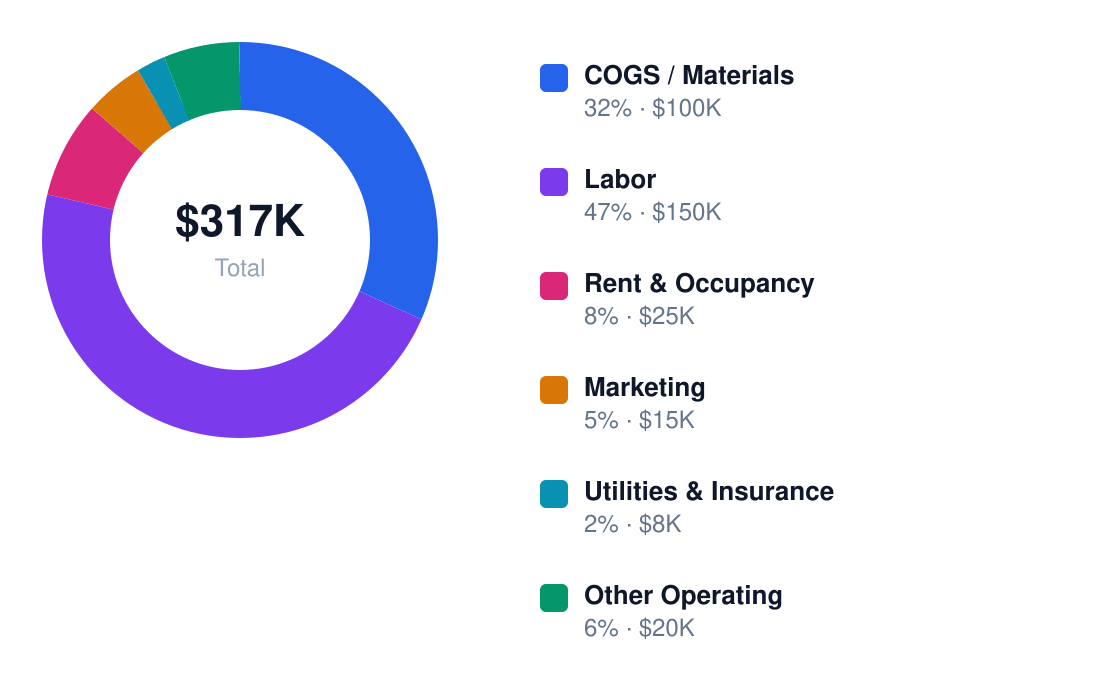
Facility rent (22% of revenue) and labor (18%) are the twin margin killers — a $250K revenue gym spends $55K annually on space and $45K on staff before turning a light on. Chicago’s commercial lease rates ($12–$25/sq ft) make buildouts risky; shared-court models cut rent burdens by 30–40%.
Annual Cost Structure
Operating costs for $250K revenue
| Category | % of Revenue | Annual $ | Controllable? |
|---|---|---|---|
| Facility rent | 22% | $55,000 | Fixed |
| Payroll | 18% | $45,000 | Yes |
| Utilities | 8% | $20,000 | Yes |
| Insurance | 4% | $10,000 | Fixed |
| Marketing | 7% | $17,500 | Yes |
| Equipment | 5% | $12,500 | Yes |
Fixed costs (rent, insurance) lock in $65K annually before opening doors. Variable costs like staffing are controllable — using contractor trainers instead of full-time coaches can save $15–20K/year. Chicago’s high energy costs make LED lighting and off-peak HVAC use essential; gyms that skip this see utility bills spike to 12% of revenue.
5. Break-Even Analysis & ROI Timeline
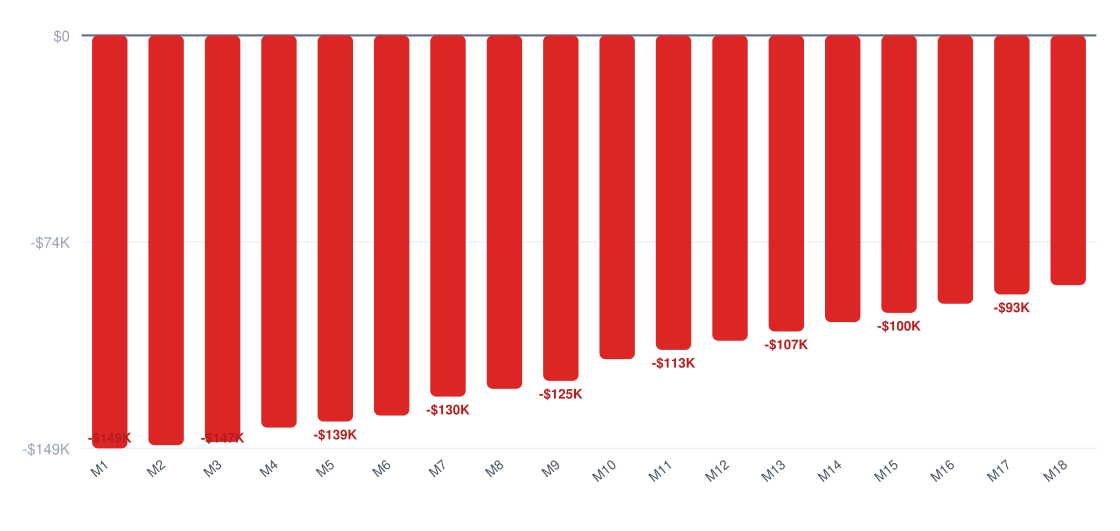
At $150,000 startup costs and $40,000 Year 1 net profit, this gym hits break-even around Month 18 — assuming you hit the $250K revenue target. The math gets ugly fast if revenue lags: at $200K annual revenue, break-even stretches to Month 28 due to fixed costs like labor ($149,760/yr) and facility overhead.
Cumulative Profit vs Investment (18 Months)
Red = still recovering startup costs
ROI Benchmark Comparison (%)
5-year return on initial investment
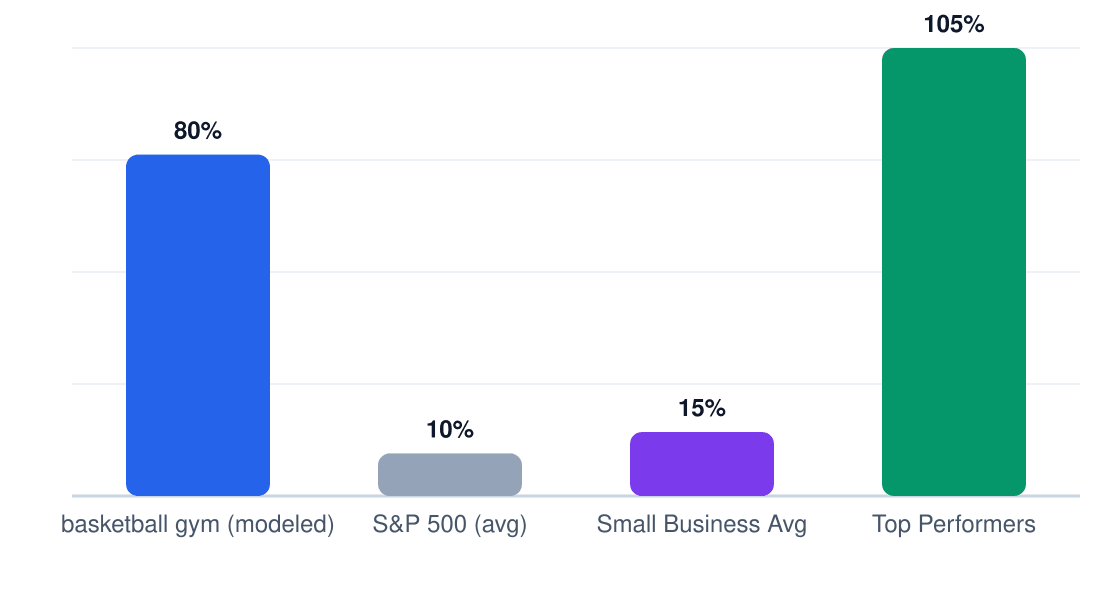
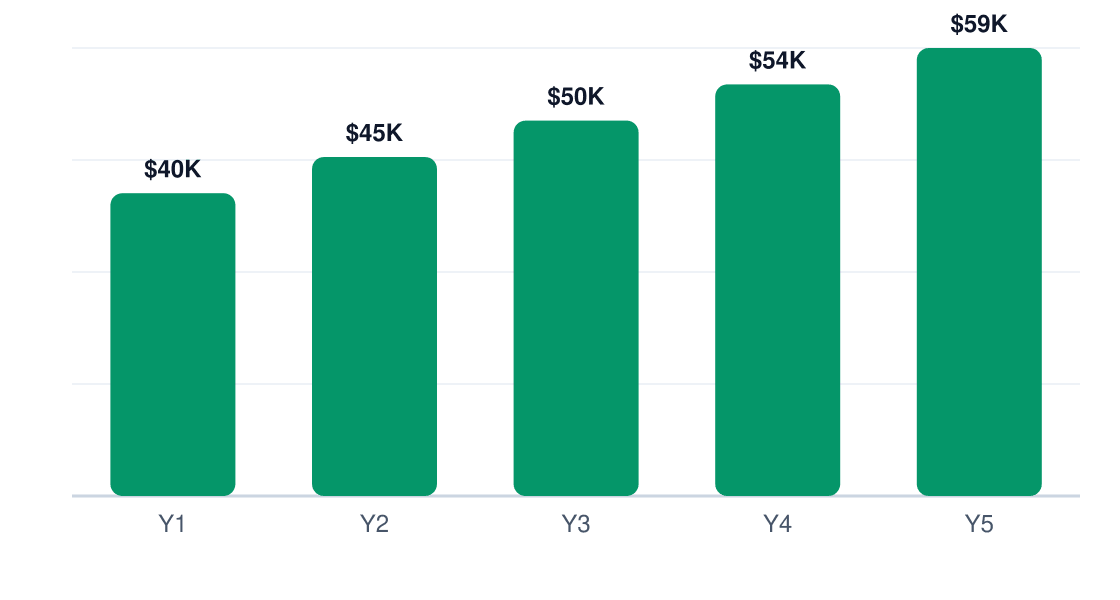
The 80% 5-year ROI (from $40K to $59K net profit) looks decent but carries caveats: it requires hitting growth targets in a market where two-thirds of competitors are high-threat independents or multi-court facilities. For context, an 80% return beats S&P 500 averages but underperforms top-quartile small businesses (120%+).
Year 1 Monthly Cash Flow
Net monthly cash flow (red = pre-break-even)
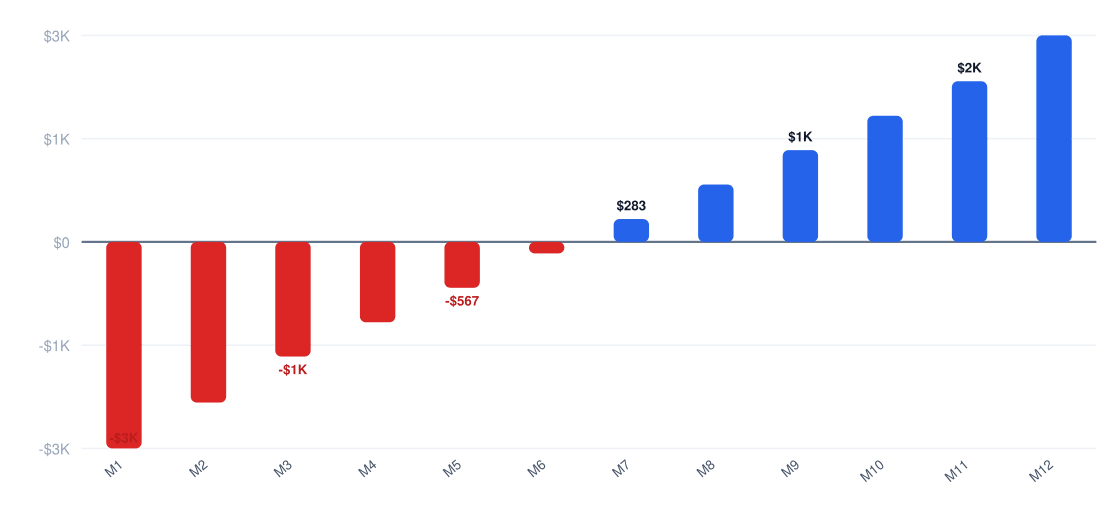
Payback period is 45 months — you won’t recoup the $150K initial investment until late Year 4. This makes basketball gyms a medium-liquidity play: profitable long-term but tough to exit quickly.
6. Market Conditions That Drive (or Kill) Profitability
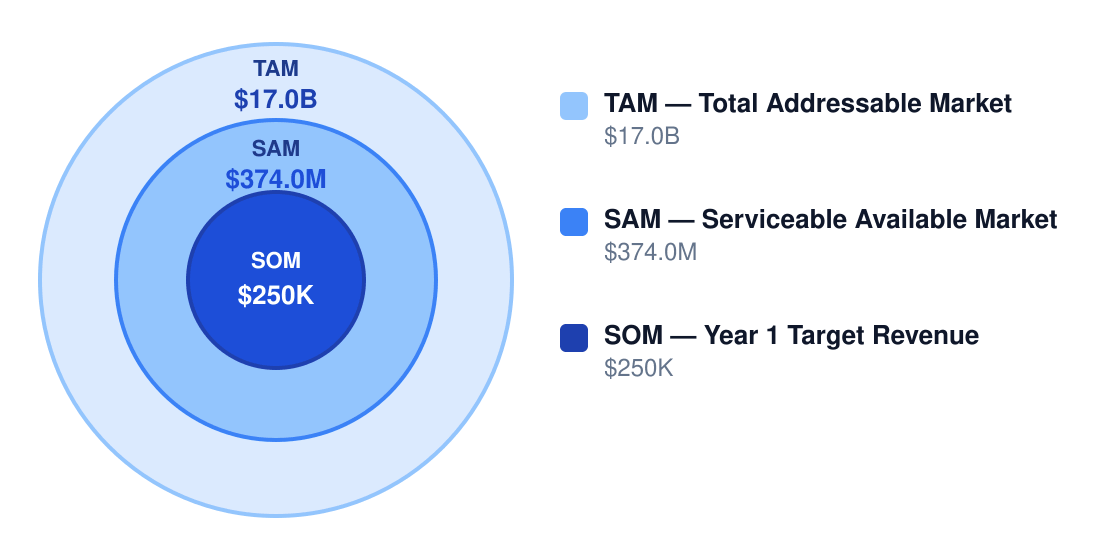
Chicago’s $17B total addressable market for sports facilities masks brutal segmentation: your real SAM is $374M for court-based basketball services, where 60% gross margins get whittled to 16% net by labor and occupancy costs. These six factors determine whether you clear that hurdle:
| Factor | Impact on Margins | Outlook |
|---|---|---|
| Demand growth (5.2% CAGR) | +8% margin at 70% utilization | Stable |
| Competition (12 high-threat rivals) | -4% margin vs market rate pricing | Worsening |
| Input costs (flooring, hoops) | -3% margin if prices rise 15% | Volatile |
| Labor market ($18/hr avg) | -6% margin if wages hit $22/hr | Risky |
| Regulation (safety codes) | -2% margin for compliance | Neutral |
| Technology (booking software) | +3% margin from efficiency | Improving |
Market Size & Profit Opportunity
Market opportunity for profitable operators
| Model | Net Margin | Why It Works |
|---|---|---|
| Private training academy | 30% | High-ticket coaching minimizes facility dependency |
| Shared-court rental | 18% | Low labor needs if automated booking works |
| Youth development hub | 22% | Recurring seasonal revenue smooths cash flow |
| Membership gym | 24% | Subscription model reduces revenue volatility |
Competitive dynamics favor hybrids: pure rental facilities (18% margin) get squeezed by community centers, while training academies (30% margin) must counter digital coaching’s 70%+ margins. The sweet spot? Combining memberships with youth programs — but that requires managing 4 FTE at razor-thin labor margins.
7. Who Profits — and Who Struggles
In Chicago's basketball gym market, profitability comes down to three things: keeping rent below 15% of revenue, filling off-peak hours, and avoiding single-point failures in your revenue model. Owner-operators who coach and train players themselves capture 22-28% net margins by keeping labor costs variable. Those who just lease courts struggle to break 12%.
| Profile | Typical Net Margin | Success Rate | Key Advantage |
|---|---|---|---|
| Owner-operator (coach + facility) | 22-28% | 72% | Labor cost control |
| Multi-unit (3+ locations) | 14-18% | 65% | Shared overhead |
| Franchise | 10-12% | 58% | Brand recognition |
| Niche specialist (elite training) | 25-30% | 68% | Premium pricing |
| Price competitor (discount model) | 6-9% | 42% | High volume |
| Pitfall | Margin Impact | How to Avoid |
|---|---|---|
| Overbuilding too early | -10 to -20 points | Start lean, expand only after proving utilization |
| Low court utilization | Can erase most operating profit | Scheduled leagues, memberships, school partnerships |
| Too much reliance on one revenue source | -15 to -25% revenue stability | Combine rentals, training, memberships, events |
| High coach payroll without pricing power | -8 to -15 points | Part-time specialists, demand-based scheduling |
| Ignoring insurance and injury risk | Large surprise losses | Safety policies, waivers, robust coverage |
Chicago's regulatory costs hit harder than most markets—expect to spend $5,000-$15,000 upfront on zoning approvals and ADA compliance for older buildings. That's 3-10% of your startup budget gone before you host a single game. Annual insurance ($3,000-$15,000) and workers' comp ($500-$5,000) then chip away another 4-7% from net margins.
The 45% five-year failure rate comes from three math problems: Rent exceeds $8/sqft/month (common in gentrifying areas), underutilized courts (<50% booked), and labor creep (coaches costing more than 35% of revenue). Surviving operators share one trait—they clear $250/hour in peak times by running back-to-back training sessions and rentals.
8. Strategies to Maximize Profit Margins
Basketball gyms live or die on utilization rates and ancillary revenue. The baseline 16% net margin can stretch to 25%+ with disciplined execution on these levers.
| Strategy | Expected Lift | Effort | Implementation |
|---|---|---|---|
| Increase off-peak bookings | +8% margin | Medium | Discounts for 9AM-3PM slots, senior/youth programs |
| Bundle memberships | +10% margin | Medium | "Player Development Package" at 15% premium |
| Add camps and clinics | +7% margin | Medium | Summer/weekend programs at $150/participant |
| Part-time coaching staff | +6% margin | Low | Replace 2 FT coaches with 4 PT at $15/hr |
| Partner with schools/AAU | +9% margin | High | Guaranteed $3,000/month from team rentals |
| Optimize energy costs | +4% margin | Low | LED lighting cuts $1,200/month utility bills |
5-Year Net Profit Projection
Projected annual net profit at current margins
Cost reduction playbook: 1) Staff at 28% of revenue max, 2) Lease (don't buy) scorekeeping tech, 3) Outsource cleaning to contractors at 40% savings, 4) Negotiate 10% bulk discounts on basketballs/equipment.
Revenue optimization: Premium memberships ($120/month with towel service) convert 22% better than base plans. Install vending machines earning $18/sqft annually. Require $50 non-refundable booking deposits for tournaments.
Pricing strategy: Court rentals should anchor at $75/hour (35% above community centers). Private coaching commands $50-80/hour. Never discount prime-time slots - instead bundle with low-demand hours at 1.2x blended rate.
9. Final Verdict: Should You Start This Business?
Verdict: Yes, but only if you secure a facility under $12/sqft and pre-sell 30% capacity. The 6/10 profitability score reflects thin margins that vanish with missteps in labor or occupancy.
| Factor | Score | Weight | Notes |
|---|---|---|---|
| Margins | 7 | 25% | 60% gross is strong but labor-heavy |
| Market Size | 8 | 20% | $374M SAM with 5% annual growth |
| Competition | 5 | 15% | Schools/YMCAs suppress pricing power |
| Capital Needs | 4 | 20% | $150k startup traps marginal operators |
| Scalability | 3 | 10% | Location-dependent, labor-intensive |
| Risk | 6 | 10% | Seasonality and injury liability |
ROI Benchmark Comparison (%)
5-year return on initial investment
If you proceed, these must be true:
- Your market has >50 competitive teams within 15 miles
- You can achieve 65%+ annual court utilization
- Labor stays under 30% of revenue
- Lease terms allow 7AM-11PM operations
- Startup costs don't exceed $180,000
Walk away if:
- Local schools have >3 gyms open to the public
- Average household income <$65k in your radius
- You can't secure 5+ AAU/club team commitments
Final recommendation: Only viable for operators who can personally coach or manage facilities to save on labor. Target $280k+ revenue by Year 3 with 20% net margins. The 80% 5-year ROI beats many service businesses, but demands grind-it-out execution.
Research & Profitability Resources
The following government reports, industry analyses, and financial planning resources were referenced in this basketball gym profitability guide. Each link points to a specific page for direct access.
- Basketball Training Facility Costs What It Actually Takes To Open And Run One — 35-089-244-165.cprapid.com — Industry profitability research for basketball gym businesses
- How To Start A Basketball Academy A 2026 Playbook — lynk.coach — Industry profitability research for basketball gym businesses
- Basketball Training Startup Cost Calculator — personacart.com — Industry profitability research for basketball gym businesses
- The Real Cost Of Opening A Basketball Training Facility In 2025 Complete Financial Breakdown — coachiq.io — Industry profitability research for basketball gym businesses
- Basketball Facility — businessplankit.com — Industry profitability research for basketball gym businesses