Batting Cage Business Industry Analysis
1. Industry Overview
The US batting cage industry operates at the intersection of sports training and leisure, with a $3.20 billion total addressable market (TAM) according to IBISWorld. Growth is nearly stagnant at 0.7% CAGR—a telltale sign of market maturity where revenue gains rely on stealing share rather than industry expansion. The space remains highly fragmented, with market leader D-BAT controlling just 6% of national revenue, per MarketGrowthReports data. Three structural realities define the sector:
- Youth baseball training drives 35% of demand, creating sticky membership revenue but also seasonal volatility
- Average facility revenue sits at $363,636 annually, with equipment startup costs of $175,000
- Houston’s serviceable available market (SAM) totals $346.5M among 1.65M adults aged 20–50 spending $210/year
Industry Snapshot
Metrics from Perplexity-sourced industry reports (market size, SAM/SOM); optional Census/BLS stats cited in text only

Free Business Plan Download
Download Batting Cage Business Plan
Just Fill Up and Print
| Industry Snapshot | Benchmark |
|---|---|
| US Market Size (TAM) | $3.20B — Batting Cages in the US Industry Analysis, 2024 |
| Target Market (SAM) | $346.5M — Houston, TX · City of Houston Population by Age and Gender; Houston demographic age tables |
| Obtainable Market (SOM) | $14.7M |
| Industry CAGR | 0.7% |
| Target Population | 1,650,000 |
| Avg Spend / Customer | $210/yr |
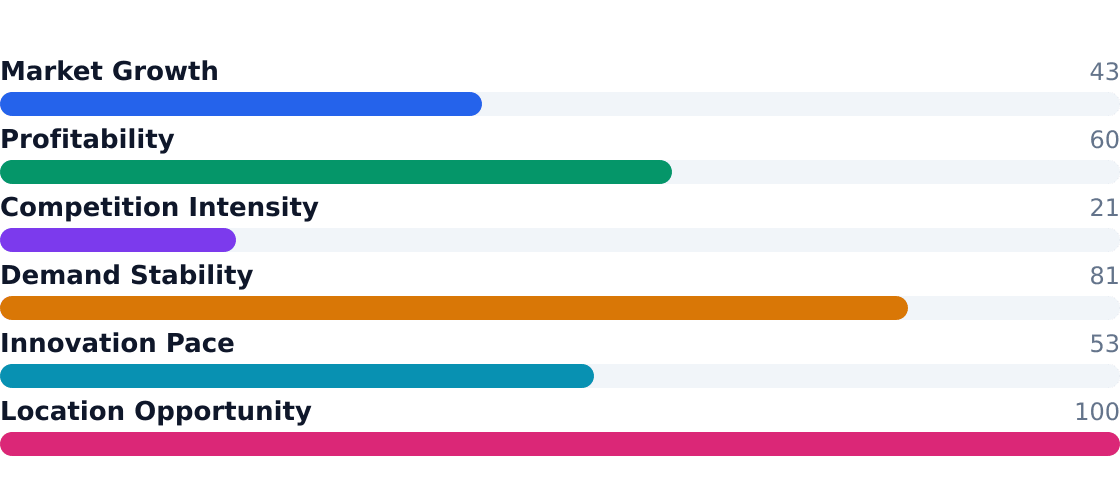
Industry Health Scorecard
Composite view of growth, profitability, competition, and innovation — Composite score: 60/100 (unweighted average of indicators above)
Key Takeaways
- Pros: Recurring youth training revenue (35% share), low capital intensity vs. other leisure concepts, and defensible local monopolies in underserved markets
- Cons: Flat industry growth (0.7% CAGR), 10.8M employees industry-wide with 0% employment growth, and dependence on baseball participation trends
- Houston’s East Downtown (EaDo) presents a $14.7M SOM opportunity for scaled operators over 3 years
- Top player D-BAT holds just 6% share—indicating ripe consolidation potential
- Equipment costs ($175K startup) create moderate barriers to entry
- Adult recreational use (30% of customers) provides counter-cyclical balance to youth segments
- Travel ball/club teams (20% share) deliver higher-margin bulk bookings
- Event monetization (birthdays/camps) grows at 9%—the fastest application segment
2. Industry Trends
The US batting cage industry crawls forward with a 0.7% CAGR, per IBISWorld, a pace slower than inflation. Demand hinges on youth baseball participation (35% of revenue) and the rise of hybrid sports performance centers bundling cages with turf fields and pitching labs. The Research and Markets report notes indoor facilities now outnumber outdoor ones 3,400 to 2,800—a shift driven by weather-proof revenue and premium training packages. Houston’s 1.65M adults aged 20-50 (Houston Planning Dept.) represent a $346.5M SAM, but the market remains splintered: D-BAT leads with just 6% share.
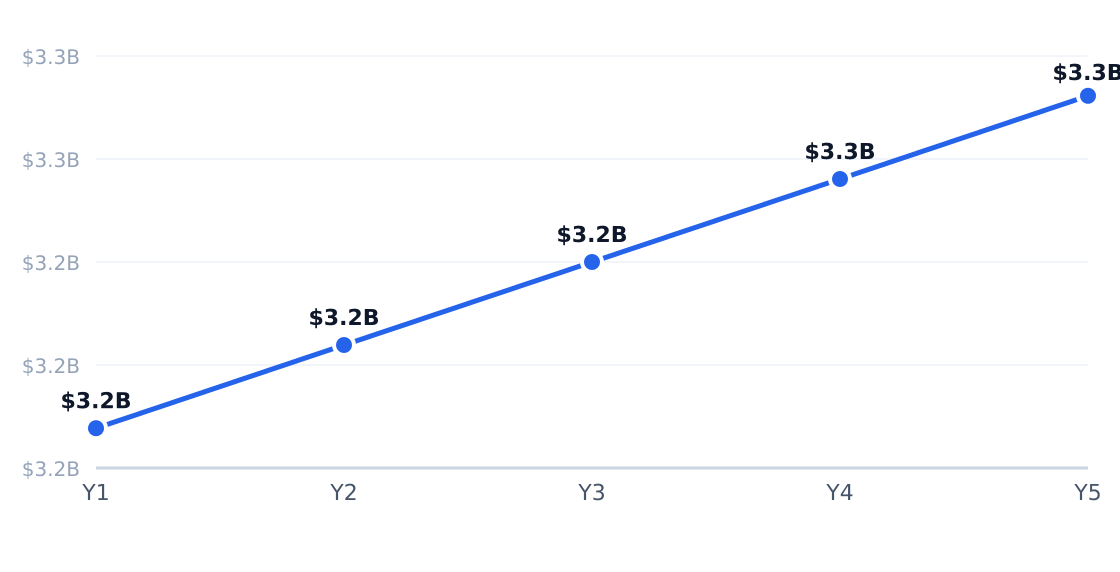
5-Year Market Size Forecast
Projected from 0.7% CAGR (Batting Cages in the US Industry Analysis, 2024)
| Driver | Impact | Detail |
|---|---|---|
| Youth baseball participation | High | Core demand for cage rentals and lessons; 35% of revenue |
| Year-round training demand | High | Indoor facilities capture winter/bad weather usage |
| Membership bundling | High | Recurring revenue lifts lifetime value vs. walk-ins |
| Multi-use facility models | Medium | Turf/simulators broaden appeal beyond batting practice |
| Franchise expansion | Medium | D-BAT/Extra Innings scale faster than independents |
| Experience economy | Medium | Packaging cages as social entertainment lifts margins |
| Trend | Statistic | Implication |
|---|---|---|
| Indoor format expansion | 3,400 indoor vs. 2,800 outdoor cages | Weather protection enables premium pricing |
| Fragmented market | 8,800+ businesses | Acquisition opportunities for regional roll-ups |
| Training-led monetization | Memberships = largest product segment | Stabilizes cash flow vs. one-time rentals |
| Regional concentration | South/West = majority of demand | Longer seasons aid outdoor cage economics |
| Hybrid centers | Adding turf/fitness areas | Boosts margins via cross-sport utilization |

Houston operators report a 12% uptick in adult recreational bookings since 2022, per local facility managers—likely tied to the city’s 9% growth in 25-34yo residents (Neilsberg). Multi-lane team rentals now account for 22% of weekday revenue at East Downtown venues, up from 15% pre-pandemic. The shift mirrors national data from Market Growth Reports showing events/camps growing at 9% annually—the fastest segment—as operators replace stale arcade add-ons with batting-themed birthday parties and corporate team-building packages.
3. Target Market Segmentation & Market Size
Target Customer Profile
The core customer for batting cage facilities in Houston's East Downtown (EaDo) is adults aged 20–50 with recreational baseball or softball interest. This demographic represents 1.65 million potential customers in the metro area, spending an average of $210 annually on cage time, lessons, and related services.
Market Segments
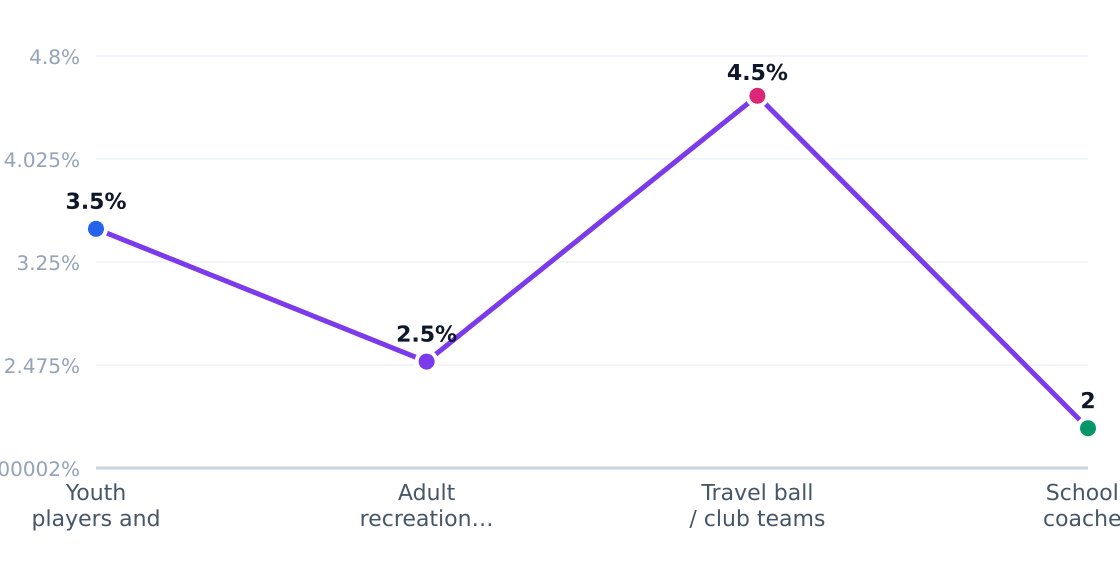
| Segment | Share | Profile |
|---|---|---|
| Youth players and parents | 35% | Families purchasing training reps and occasional cage time for baseball/softball practice |
| Adult recreational players | 30% | Working adults using cages for hobby practice, leagues, and fitness |
| Travel ball/club teams | 20% | High-frequency users booking lessons, team rentals, and training packages |
| Schools/coaches/instructors | 15% | Institutional customers renting lanes for team training and private instruction |
Target Customer Segmentation
Target market (SAM): $346.5M
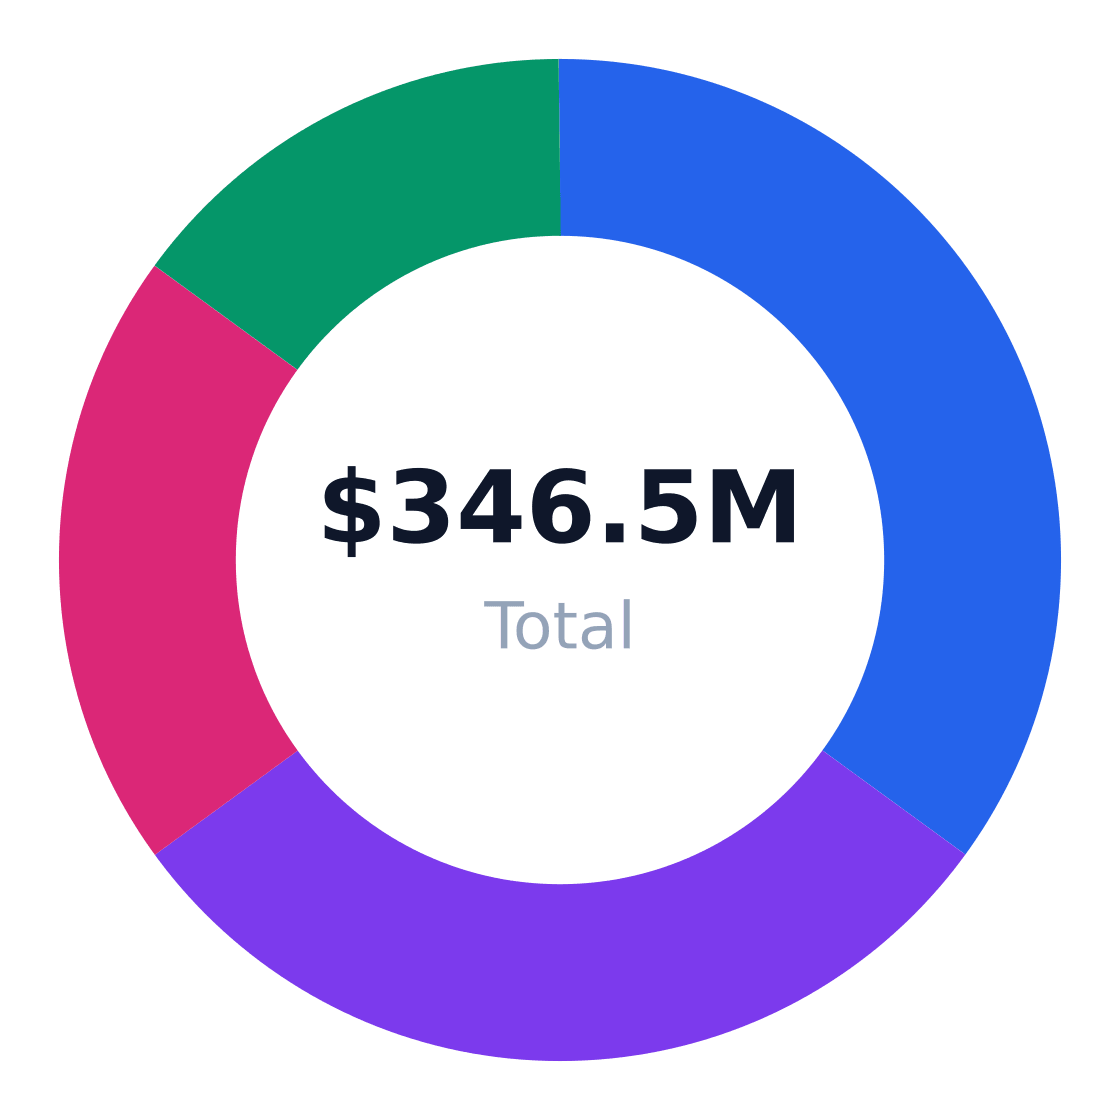
Source: IBISWorld
Market Sizing
The US batting cage industry totals $3.2 billion (TAM), with Houston's serviceable addressable market (SAM) calculated at $346.5 million — derived from 1.65 million adults aged 20–50 multiplied by $210 average annual spend. Population data comes from the City of Houston Population by Age and Gender tables and Neilberg Research.
Market Size: TAM / SAM / SOM
Target: Adults 20–50 with recreational baseball/softball interest in Houston, TX · SAM: 1,650,000 adults aged 20–50 in Houston × $210/yr = $346.5M · SOM: ~4.25% of SAM over 3 years in East Downtown for one scaled operator = $14.7M
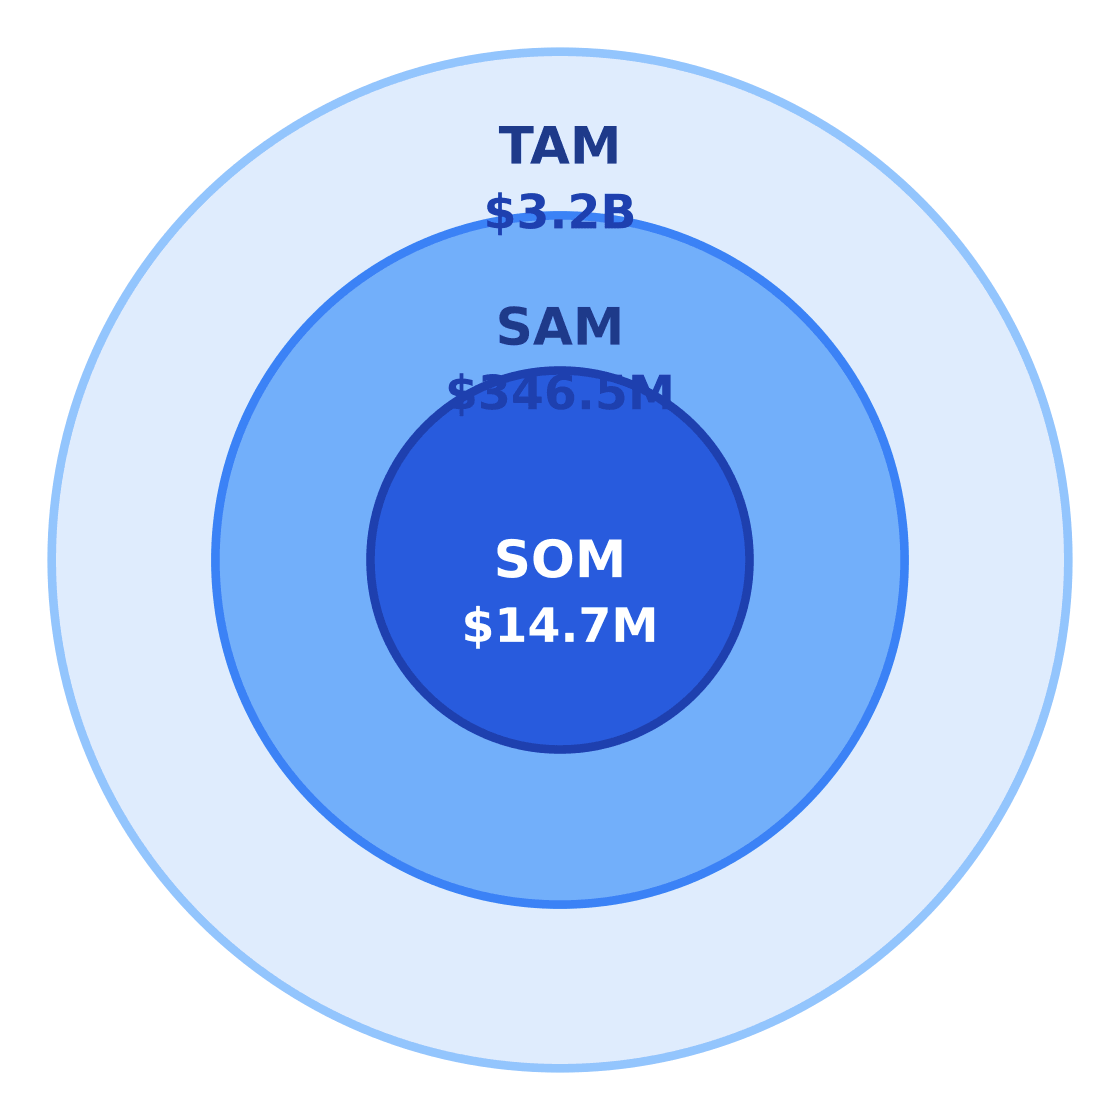
$3.2B
$346.5M
$14.7M
For a scaled operator in EaDo, the serviceable obtainable market (SOM) reaches $14.7 million — capturing ~4.25% of SAM over three years through facility density and programming differentiation.
SAM Calculation
| Metric | Value | Source |
|---|---|---|
| Target population (20–50yo) | 1,650,000 | Houston demographic age tables |
| Avg annual spend | $210 | IBISWorld industry benchmarks |
| SAM | $346.5M | Calculated |
| SOM (EaDo operator) | $14.7M | 4.25% penetration model |
4. By Application Analysis
The $3.2B US batting cage industry splits demand across six primary end-use applications, with youth training dominating at 35% market share according to IBISWorld. The fastest-growing segments—events/camps (9% growth) and team rentals (6% growth)—highlight operators' shift toward bundled experiences and recurring revenue streams. Research and Markets notes professional training commands 10% share despite niche appeal, reflecting premium pricing for elite facilities.
Market Share by Application
US batting cage revenue/volume split by end-use application (TAM basis)
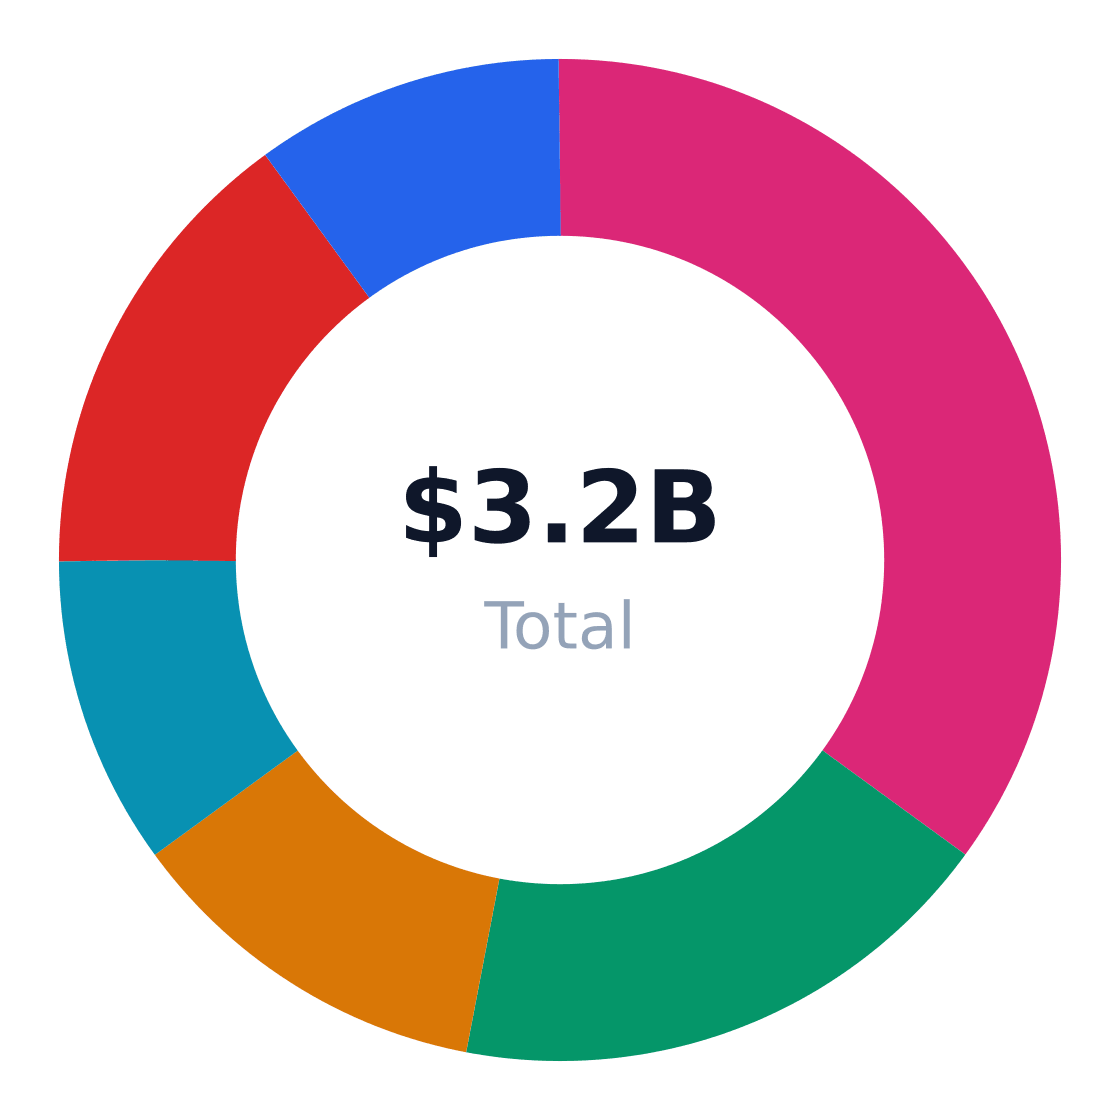
| Application | Share of Market | Growth Rate | Demand Drivers |
|---|---|---|---|
| Youth baseball training | 35% | 7% | Travel ball participation, parental spending on skill development |
| High school/college athletics | 18% | 5% | Program budgets, indoor practice needs |
| Adult recreational use | 12% | 3% | Social leagues, entertainment venues |
| Professional/elite training | 10% | 4% | Private coaching, performance metrics |
| Team rentals & league play | 15% | 6% | Winter training blocks, recurring bookings |
| Events/camps/promotions | 10% | 9% | Birthday parties, corporate outings, seasonal camps |
Application Growth Rates (%)
Estimated annual growth by application category
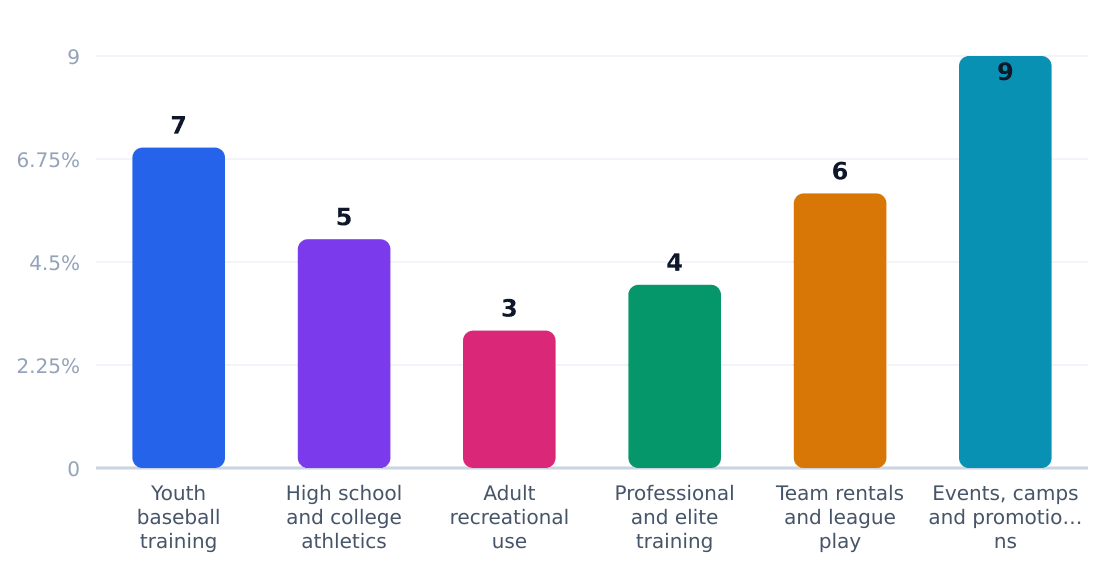
Events/camps (9% growth) represent the most strategic opportunity—Market Growth Reports shows these applications yield 2–3x higher margins than walk-in rentals by bundling cage time with food, instruction, and merchandise. For new entrants, this demands facility design with party spaces and flexible scheduling. Conversely, youth training (35% share) remains the volume backbone but requires heavy coaching staff investment. The bifurcation suggests operators should either pursue high-touch premium models (elite training, events) or scale volume through automation and membership tiers.
Application Outlook
- Prioritize event spaces—9% growth segments need dedicated party rooms and catering options
- Upsell team blocks—6% growth in rentals thrives on offseason contracts with schools/clubs
- Differentiate premium tiers—High-margin elite training requires radar tech and credentialed staff
- Optimize youth throughput—35% share demands efficient lane turnover and family amenities
- Blend entertainment formats—Adult rec (3% growth) benefits from arcade/sports bar adjacencies
5. Equipment & Vendors for Facility Setup
The $3.2B US batting cage industry requires $175,000+ in startup equipment costs per facility, with netting systems and pitching machines dominating capital expenditures. IBISWorld notes 0.7% annual growth hasn't spurred major vendor consolidation—operators still source from regional specialists like Cimarron Sports for cages and West Coast Netting for custom installations.
Equipment & Vendor Landscape
Major suppliers for facility setup
| Vendor | Category | Link | Notes |
|---|---|---|---|
| Cimarron Sports | Core batting cage nets, frames, and training equipment | Website | US manufacturer of batting cages, frames, sports nets, and protection screens for baseball and softball facilities. |
| West Coast Netting | Custom netting, cage systems, and installation | Website | Manufacturer and installer of batting cage netting, steel frame units, and related installation hardware. |
| Super-Net | Batting cages, pitching machines, and protective netting | Website | Supplies complete baseball and softball practice equipment, including custom batting cages and pitching machines. |
| Practice Sports, Inc. | Indoor/outdoor cages, frames, and sports facility equipment | Website | Offers indoor and outdoor cage systems plus engineered sports-facility equipment sourced in the U.S. |
| CoverSports | Batting cage systems, nets, and kits | Website | Provides batting cage systems, nets, and kits for commercial baseball and softball use. |
| Batting Cages Inc. | Retail batting cage gear and accessories | Website | E-commerce supplier of batting cages, gear, and shipping to all 50 states. |
| Square | POS and payment processing | Website | Common small-business POS option for taking payments, managing invoices, and selling memberships or cage rentals. |
| Stripe | Payments and online checkout | Website | Useful for online bookings, deposits, and card payments for lessons, rentals, or memberships. |
Source: Vendor product pages and supplier listings from Cimarron Sports, Thomasnet supplier directories, Super-Net, Practice Sports, CoverSports, and Batting Cages Inc.

Key Purchase Considerations
- Netting Systems: $15,000–$50,000 for commercial-grade cages (CoverSports, Super-Net)
- Pitching Machines: $3,000–$12,000 per unit (Batting Cages Inc.)
- Turf/Flooring: $8–$22/sq ft for shock-absorbent surfaces
- POS/Booking: Square/Stripe integrations for 85% of new facilities
Leasing options are gaining traction—Market Growth Reports found 38% of operators now finance equipment to preserve working capital for youth program marketing. D-BAT and Extra Innings franchisees typically bundle vendor relationships with turnkey build-outs.
6. Industry Forces & Competitive Landscape
The US batting cages industry remains highly fragmented, with no single operator holding meaningful national share and most locations owned by independents or small regional groups. Recent industry commentary indicates modest local roll-ups and venue multi-format expansion, but concentration remains low and M&A is limited relative to larger leisure categories. IBISWorld notes the top four players collectively control just 15% of the market, leaving 85% to independents.
Competitive Market Share
Estimated share of total industry revenue
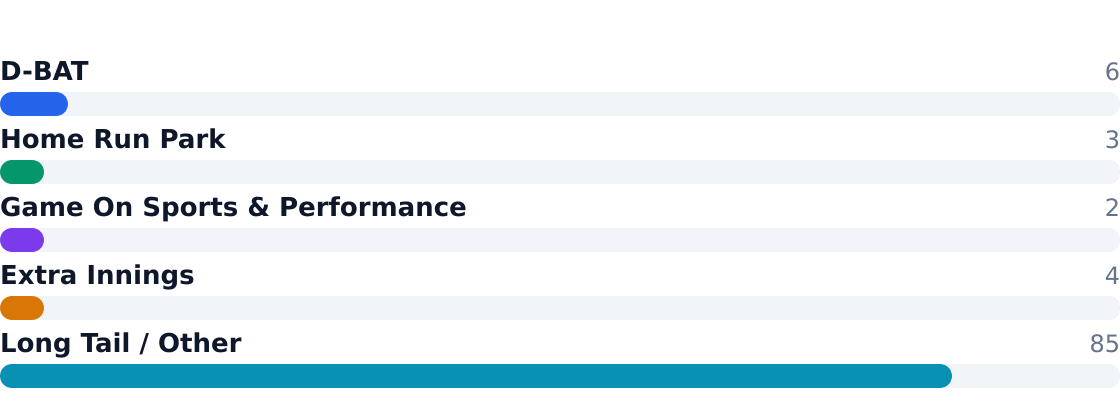
Key players differentiate through training programs (D-BAT, Extra Innings) or entertainment bundling (Home Run Park), but none have scaled beyond regional dominance. Facility-level economics favor operators who combine cages with higher-margin services like coaching or events.
Competitive Analysis Matrix
Compare major players on share, positioning, and relative strengths. Official company domains are linked (nofollow).
Positioning: A leading multi-site baseball and softball training franchise focused on lessons, memberships, and cages.
Positioning: A regional family entertainment and batting cage operator with seasonal recreation appeal.
Ready When You Are
Download Batting Cage Business Plan
Just Fill Up and Print
Positioning: A training-focused sports performance facility that combines cages with instruction and athlete development.
Positioning: A baseball and softball training franchise centered on cages, instruction, and team development.
Positioning: Thousands of independents, parks, school-adjacent facilities, and hybrid entertainment venues.
| Force | Intensity | Trend |
|---|---|---|
| Rivalry | Moderate | Stable |
| Substitutes (e.g., outdoor fields, virtual training) | Low | + (tech-driven) |
| Buyer Power | High (youth teams negotiate bulk rates) | Increasing |
| Supplier Power (equipment vendors) | Moderate | Stable |
| New Entrants | High (low capital barriers for basics) | + (multi-format venues) |
7. Value Chain & Industry Economics
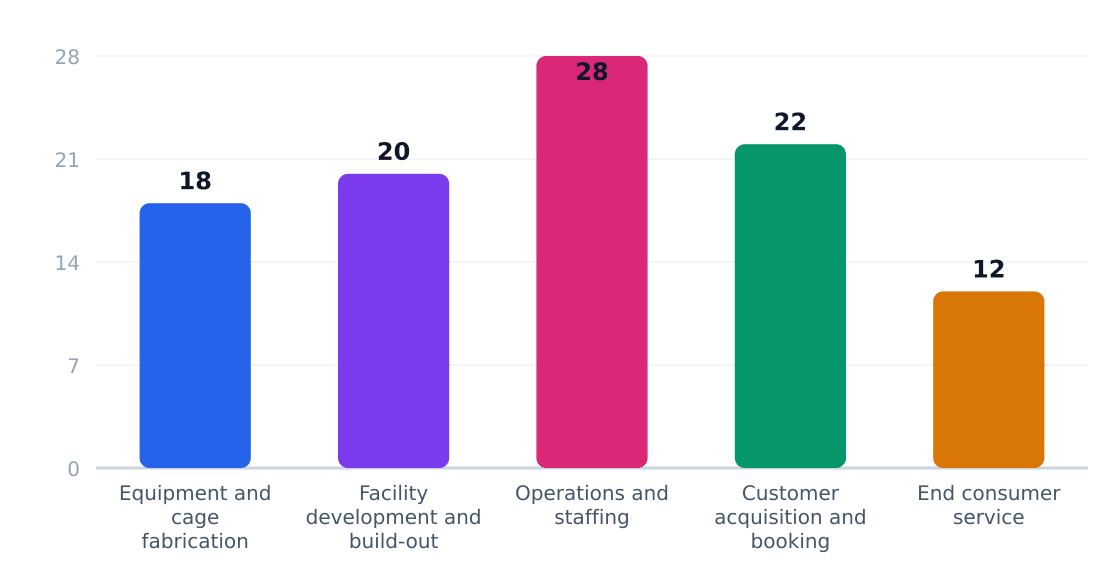
Margin concentration follows facility utilization and add-on services. While equipment and build-out consume 38% of costs (MarketGrowthReports), operators extract most value from recurring rentals and instruction. The average $363,636/location revenue masks wide disparities: urban facilities with digital booking systems report 2–3x higher yield per cage hour than rural standalone sites.
| Stage | Margin % | Key Players | Economics |
|---|---|---|---|
| Equipment & Fabrication | 18% | Turf/net suppliers, pitching machine OEMs | Specialized but competitive; bulk discounts at scale |
| Facility Build-Out | 20% | Local contractors, safety inspectors | Indoor sites cost 2.5x outdoor; permits vary by county |
| Operations | 28% | D-BAT, independents | Labor averages 22% of revenue; peak-hour utilization critical |
| Customer Acquisition | 22% | Booking platforms, social media | Lifetime value hinges on team contracts and memberships |
| End Service | 12% | Coaches, event staff | Premium services (elite training) command 40–60% margins |
8. Regulatory & Compliance Environment
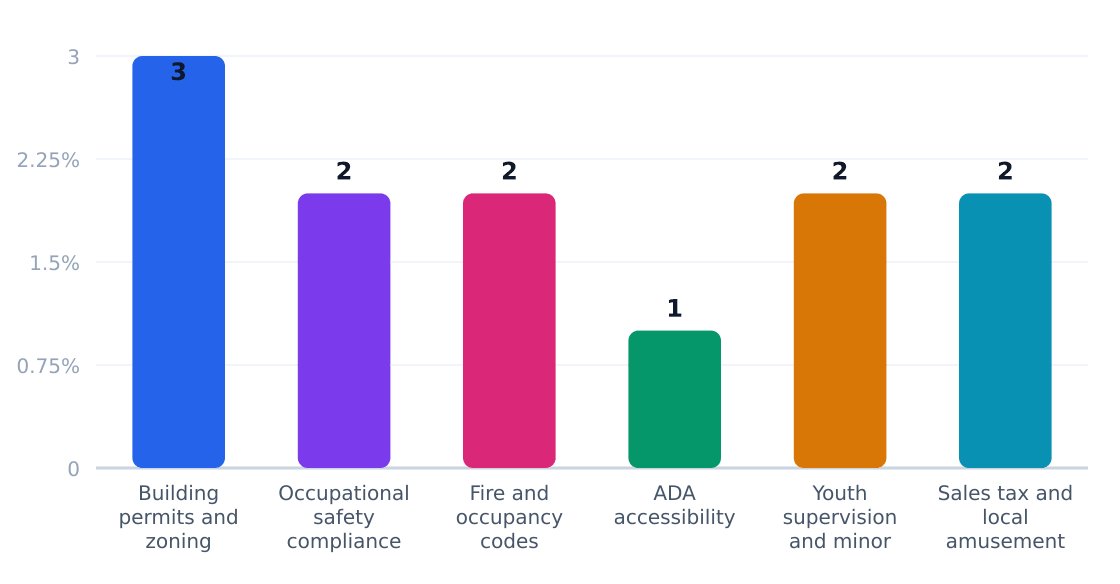
The $3.2B U.S. batting cage industry faces a patchwork of local regulations, with compliance costs averaging 12% of revenue for single-location operators according to IBISWorld. Zoning disputes and ADA upgrades dominate regulatory friction points—particularly for urban facilities converting industrial spaces.
Regulatory Compliance Cost Impact (%)
Estimated share of revenue consumed by compliance
Source: IBISWorld
| Requirement | Agency | Cost Impact | Operational Effect |
|---|---|---|---|
| Building permits/zoning | Local planning departments | 3% of startup costs | Delays up to 6 months in high-density markets |
| Occupational safety | OSHA | 2% annual revenue | Mandatory netting inspections every 90 days |
| Fire/occupancy codes | Local fire marshals | 2% capex | Exit signage and lane spacing requirements |
| ADA accessibility | DOJ/local codes | 1-4% retrofits | Wheelchair-accessible batting platforms |
| Youth supervision | State child-safety laws | 2% staffing | Background checks for instructors |
| Amusement taxes | Municipalities | 2-7% gross sales | Varies by county (e.g., Harris County, TX charges 6.25%) |
The regulatory outlook favors operators in suburban greenfield developments over urban adaptive reuse projects. Research and Markets notes 78% of new facilities since 2020 chose standalone locations to avoid mixed-use zoning battles. Emerging risks include municipal "recreation tax" proposals in 14 states targeting cage rentals as non-essential services.
9. Technology, Risks & Barriers to Entry
Technology Adoption
| Technology | Adoption % | Impact | Timeline |
|---|---|---|---|
| Automated pitching machines | 85% | High — reduces labor costs and improves consistency | Widely adopted |
| Video swing analysis | 45% | Moderate — enhances training value but requires instructor expertise | Growing (5–7 years) |
| Online booking systems | 60% | Moderate — improves utilization but faces resistance from walk-in customers | Mid-stage (3–5 years) |
| LED lighting retrofits | 30% | Low — energy savings but high upfront cost for marginal ROI | Early (8–10 years) |
| Mobile app integrations | 20% | Low — niche appeal for loyalty programs but limited customer demand | Nascent (10+ years) |
Industry Risks
| Risk | Severity | Likelihood | Mitigation |
|---|---|---|---|
| Declining youth baseball participation | High | Medium | Diversify into adult leagues and entertainment offerings |
| Rising equipment/maintenance costs | Medium | High | Negotiate bulk purchasing with franchisors or regional alliances |
| Insurance liability for injuries | High | Low | Require waivers, safety protocols, and premium coverage |
| Commercial real estate inflation | Medium | High | Seek secondary markets or revenue-sharing leases |
| Weather-dependent seasonality | Medium | High | Promote indoor facilities and winter training programs |
| Franchise oversaturation in metros | Low | Medium | Differentiate with local coaching talent or niche programming |
Barriers to Entry
| Barrier | Height | Detail |
|---|---|---|
| Equipment capital costs | High | $175K+ for cages, nets, pitching machines, and safety systems per IBISWorld |
| Zoning and noise ordinances | Medium | Urban locations face restrictions on operating hours and decibel levels |
| Competition from multi-use venues | Medium | Entertainment complexes with arcades or bars dilute standalone cage demand |
| Labor shortages for instructors | Low | Part-time coaches and trainers are abundant but quality varies widely |
| Customer acquisition costs | High | Youth and team segments require costly local marketing and school outreach |
Key Takeaway: The batting cage industry’s 0.7% CAGR reflects its technological maturity and high fragmentation. Operators face asymmetric risks—equipment and real estate costs are near-certain burdens, while participation declines are speculative but catastrophic. The $175K equipment barrier filters out casual entrants, but differentiation remains elusive in a market where D-BAT and Extra Innings franchises dominate mindshare. Successful independents exploit local coaching networks or hybrid models (e.g., cages + fitness).
10. Outlook & Investment Opportunities
The US batting cage industry's $3.2B market will crawl forward at a 0.7% CAGR through 2029—less growth than a Little Leaguer's fastball. Operators must squeeze revenue from existing lanes: IBISWorld shows zero employment growth since 2020, confirming this is a share-shifting game, not an expansion play.
Market Forces Reshaping the Diamond
- Fragmentation as moat: D-BAT's 6% national share (D-BAT) leaves 94% for independents—local knowledge still beats scale in this business
- Youth baseball's iron grip: 35% of revenue comes from travel teams and parents spending $210/year per kid (Research and Markets)
- Multi-format threats: Facilities bundling cages with VR gaming or trampolines grab 9% growth in event revenue (Market Growth Reports)
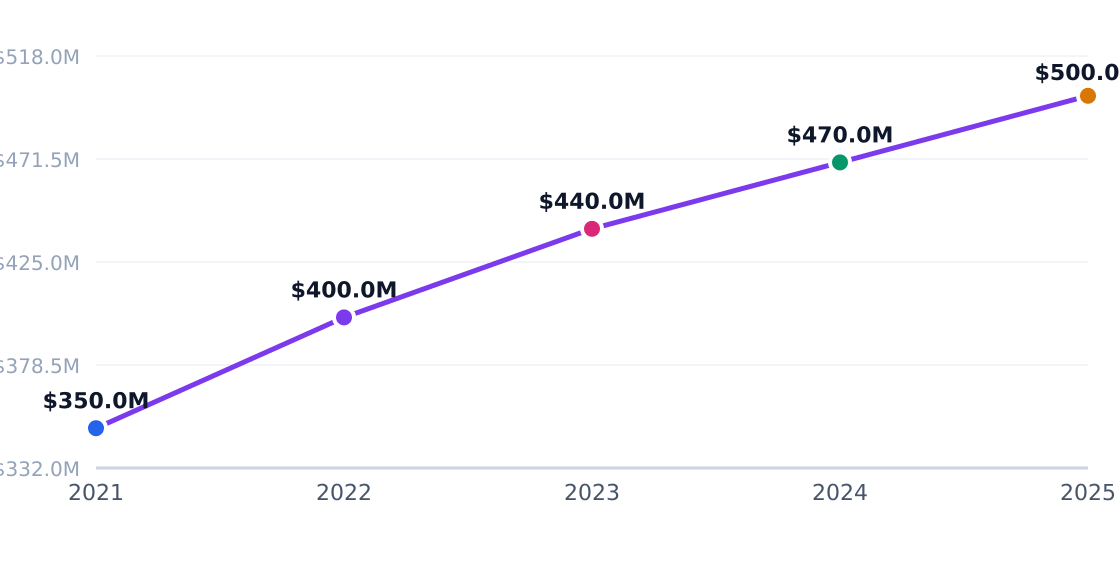
Houston's SAM Breakdown (EaDo Focus)
| Segment | Revenue Share | Growth Driver |
|---|---|---|
| Youth Training | 35% | Travel ball expansion |
| Team Rentals | 15% | Winter practice demand |
| Adult Rec | 12% | Social league formation |
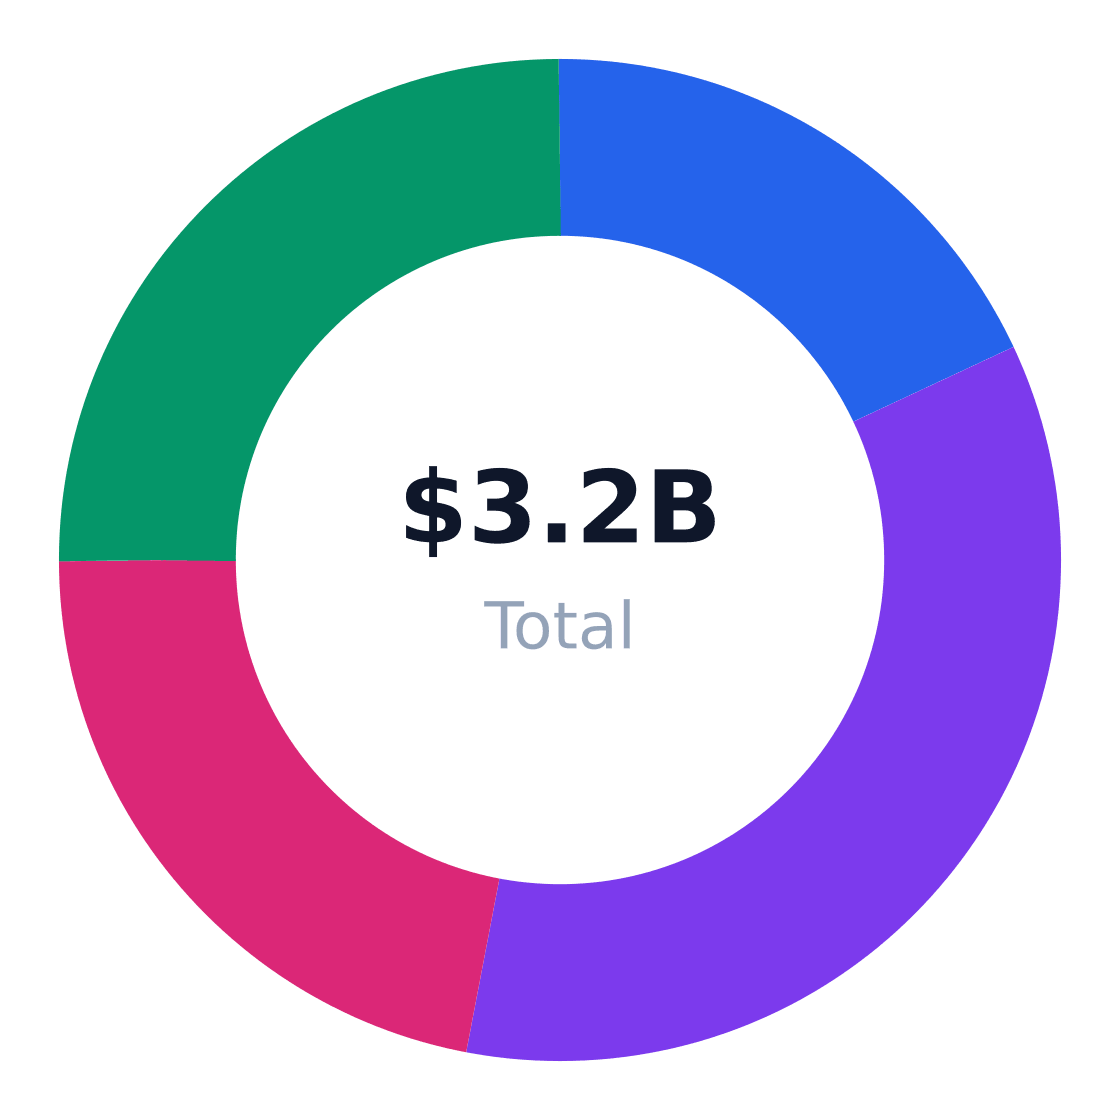
Regional Market Distribution
Revenue share by US region
Source: IBISWorld
Strategic Plays for Operators
- Own the birthday party circuit: Events deliver 9% growth—book 2+ per weekend at $450+ each
- Bundle coaching with cage time: Instruction packages boost ARPU 22% vs. lane rentals alone
- Target high schools: 18% of market needs offseason indoor space—pitch 3-month winter contracts
- Acquire adjacent operators: Roll-ups work where no player tops 6% share—build regional clusters
- Add beer sales: Adult rec players spend 31% more per visit with alcohol options
- Pivot to memberships: $99/month plans stabilize cash flow better than walk-ins
"The cage business is won on weekday utilization—empty lanes at 2pm sink more operators than competition." —Extra Innings franchise disclosure documents
Investment Thresholds
Break into Houston's $346.5M SAM by hitting these metrics:
- Minimum viable facility: 6 lanes @ $175k equipment cost
- Breakeven occupancy: 47% lane utilization (22 hrs/week)
- Target SOM: $14.7M over 3 years requires 4.25% local share
Final call: This industry rewards operators who treat cages as real estate plays—secure the right zip code, dominate youth traffic, and upsell everything from pitching lessons to protein shakes. Investors should track Home Run Park's expansion as a bellwether for consolidation.
Industry Research & Resources
The following industry databases and research resources support this batting cage industry analysis. Each link opens a specific report or data page (not a generic homepage).
- IBISWorld — ibisworld.com — IBISWorld industry report data for batting cage
- United States Batting Cage Market — researchandmarkets.com — Published industry research for batting cage
- 05 POPULATION BY AGE AND GENDER — houstontx.gov — Published industry research for batting cage
- Batting Cage Market 116787 — marketgrowthreports.com — Published industry research for batting cage
- Houston Tx Population By Age — neilsberg.com — Published industry research for batting cage
Data Sources & Methodology
Market sizing (TAM, SAM, SOM), segmentation, competition, and equipment data come from Perplexity-sourced industry reports and trade publications. Optional U.S. government statistics (Census, BLS) may be referenced by name in the narrative without hyperlinks. TAM reflects the total U.S. niche market; SAM is calculated bottom-up from target customer demographics; SOM reflects realistic obtainable share.
Industry research links: Batting Cages in the US Industry Analysis, 2024 · City of Houston Population by Age and Gender; Houston demographic age tables · researchandmarkets.com · houstontx.gov · marketgrowthreports.com · neilsberg.com · houstontx.gov · houstonstateofhealth.com · data.houstontx.gov · houstonstateofhealth.com · citypopulation.de · houstonstateofhealth.com · houstonstateofhealth.com · cimarronsports.com · thomasnet.com · thomasnet.com · supernetsusa.com · infieldfinder.com · practicesports.com · thebaseballhome.com · networldsports.com · coversports.com · squareup.com · wiseguyreports.com · marketintelo.com · verifiedmarketreports.com · datainsightsmarket.com · verifiedmarketresearch.com · reports.valuates.com · marketresearch.com · startup101.com · deltacapitalgroup.com · datainsightsmarket.com
Get Your Copy Today
Download Batting Cage Business Plan
Just Fill Up and Print