Is a Batting Cage Business Profitable?
1. Is a Batting Cage Business Profitable? (The Short Answer)
Yes, but only if you run it like a gym, not a carnival attraction. The typical batting cage pulls 62% gross margins but nets just 15% after labor, rent, and equipment maintenance. At $650,000 annual revenue, that's $97,500 net profit—solid for an owner-operator but thin for passive investors. The 35% failure rate weeds out those who underestimate how hard it is to keep cages full during weekdays or in weak baseball markets.
Profitability Snapshot
| Metric | Benchmark |
|---|---|
| Gross Margin | 62% |
| Net Margin | 15% |
| Year 1 Revenue | $650K |
| Year 1 Net Profit | $98K |
| Startup Cost Range | $80K – $637K |
| Break-even Timeline | ~Month 14 |
| 5-Year ROI | 27% |
| Profitability Rating | 7/10 |
| Failure Rate (5yr) | 35% |
| Market Size (US) | $0.12B |
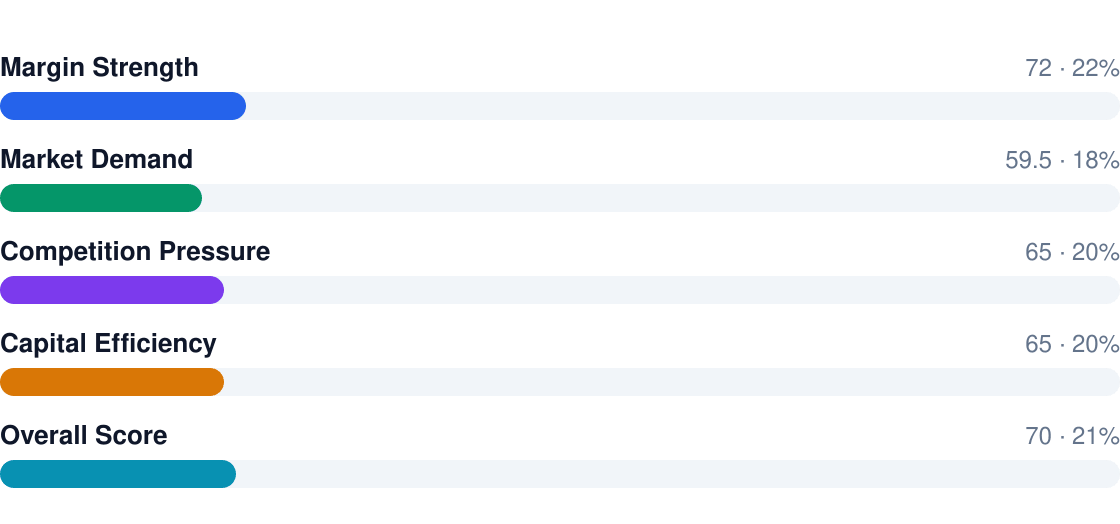
Profitability Score Breakdown

Free Business Plan Download
Download Batting Cage Business Plan
Just Fill Up and Print
Overall rating: 7/10
Bottom line:
- Pros: Recession-resistant demand (4.5% industry CAGR), 62% gross margins when utilization is high, ability to scale revenue with lessons/leagues
- Cons: Labor eats 22% of revenue, net margins collapse below 10% if occupancy dips under 50%, and real estate costs can sink urban locations
- Who wins: Operators who book 65%+ of cage slots and charge $50+/hr for premium training
- Who loses: Owners who rely on $20 walk-ins and don't upsell memberships
- Key stat: Break-even takes 14 months—you'll bleed cash until local teams/coaches discover you
2. Profit Margins & Industry Benchmarks
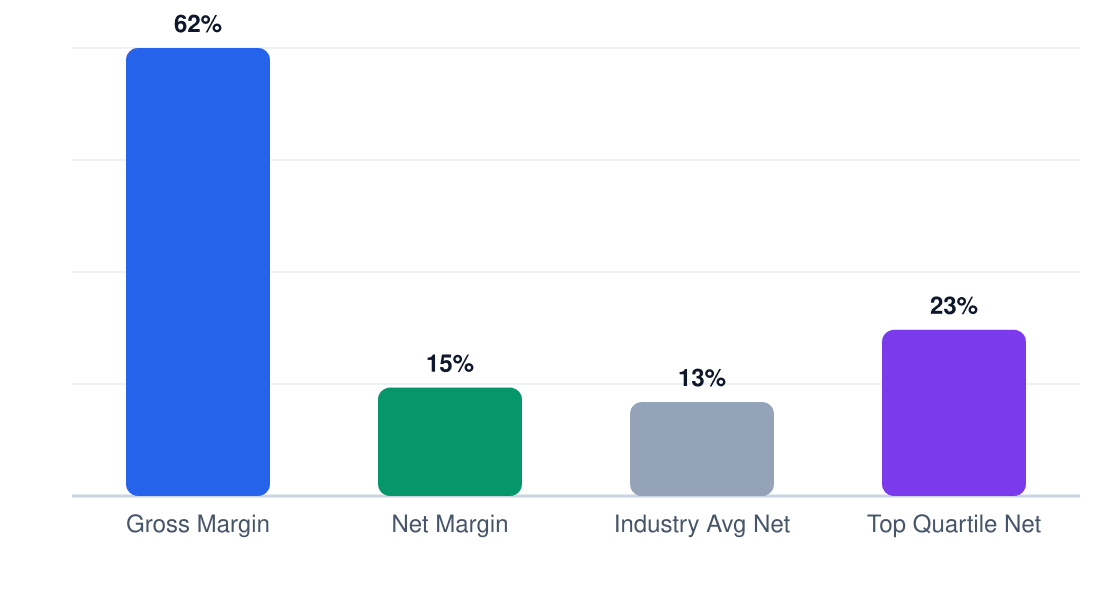
Batting cages have deceptively wide gross margins (62%) that compress fast. Labor at 22% and rent at 15% of revenue leave just 15% net—half what top-quartile operators achieve by layering on high-margin training programs. The best locations function as hybrid facilities: 40% cage rentals, 30% lessons, 20% leagues, and 10% merchandise.
Margin Comparison (%)
Gross vs net vs industry benchmarks
| Metric | This Business | Industry Avg | Top Quartile |
|---|---|---|---|
| Gross Margin | 62% | 58% | 67% |
| Net Margin | 15% | 12% | 23% |
| EBITDA | 18% | 15% | 26% |
| Labor % | 22% | 25% | 18% |
| COGS % | 38% | 42% | 33% |
| Rent % | 15% | 17% | 12% |
Competition is brutal in saturated markets. Indoor facilities with pitching machines and video analysis now command 25-30% net margins by charging $100+/hr for "elite" training—triple what basic cage rentals earn. Standalone outdoor cages? They're barely breaking even at 8-10% net unless they host tournaments.
3. Revenue Potential & Pricing Power
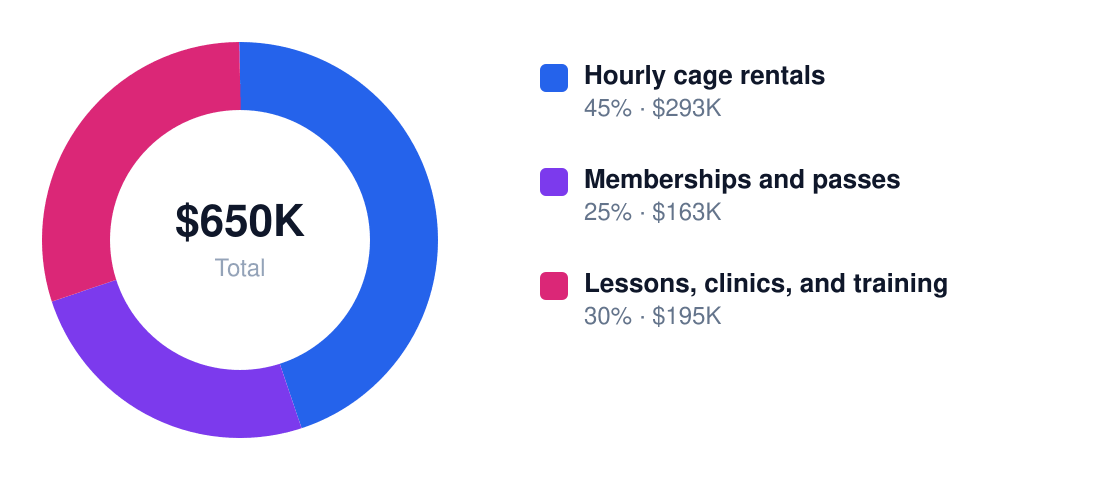
A well-run Dallas batting cage clears $650K in Year 1 revenue, growing 5-8% annually as membership retention compounds. The mix matters: high-margin memberships (75% margin) and lessons (60%) drive profitability harder than hourly rentals (55%), which dominate revenue at 45% share. Operators who flip this ratio to 40/30/30 see net margins stretch toward 20%.
Revenue Stream Breakdown
Year 1 revenue: $650K
| Stream | Margin % | Revenue Share | Annual $ |
|---|---|---|---|
| Hourly rentals | 55% | 45% | $292,500 |
| Memberships | 75% | 25% | $162,500 |
| Lessons | 60% | 30% | $195,000 |
You have moderate pricing power, but only if you bundle. Pure cage time gets shopped on price—Dallas has 14 competitors charging $25-$45/hour. Facilities anchoring on memberships ($120-$200/month) and lesson packages ($60-$90/session) can push 5-7% annual hikes. The math works when you sell convenience (reserved slots) and skill-building, not just netted square footage.

Seasonality hits hard without contracts. February-July delivers 55-60% of annual revenue as teams prep for seasons. Smart operators use August-December to sell holiday camps and offseason memberships—indoor cages that convert 30% of summer renters to winter members stabilize cash flow. Outdoor-only models? They starve 7 months a year.
4. Cost Structure & Operating Expenses
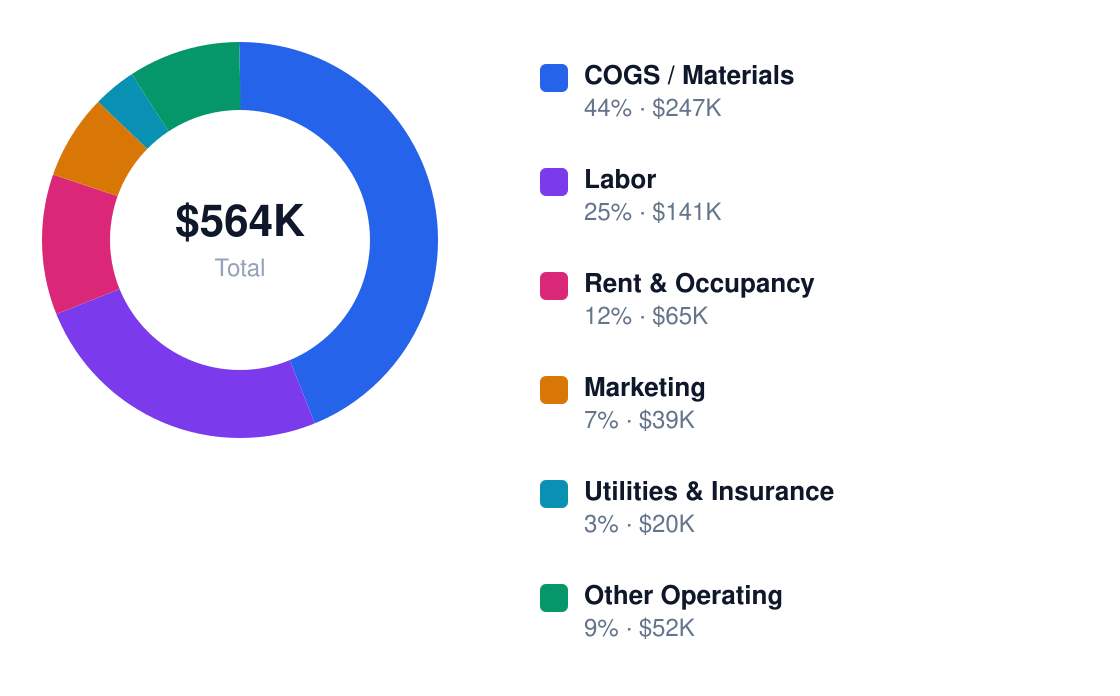
Two costs will gut you: rent (16% of revenue) and payroll (22%). Dallas retail spaces run $18-$28/sq ft—a 5,000 sq ft facility means $90K-$140K/year before triple nets. Labor burns $141K/year for 4 staff at $17/hour. Control these or die.
Annual Cost Structure
Operating costs for $650K revenue
| Category | % of Revenue | Annual $ | Controllable? |
|---|---|---|---|
| Rent/mortgage | 16% | $104,000 | Fixed |
| Payroll | 22% | $143,000 | Controllable |
| Equipment | 8% | $52,000 | Controllable |
| Utilities | 6% | $39,000 | Fixed |
| Insurance | 4% | $26,000 | Fixed |
| Marketing | 5% | $32,500 | Controllable |
Fixed costs (rent, utilities, insurance) lock in at 26% of revenue—you pay even when cages sit empty. Variable costs like payroll and equipment repairs scale with use, but poorly. Adding a 5th staffer for peak hours? That’s $35K more for maybe $50K revenue. Dallas operators who cross-train coaches to handle front-desk shifts keep labor under 20% of revenue. And never skimp on netting—$8K in annual repairs beats $25K in replacements.
5. Break-Even Analysis & ROI Timeline
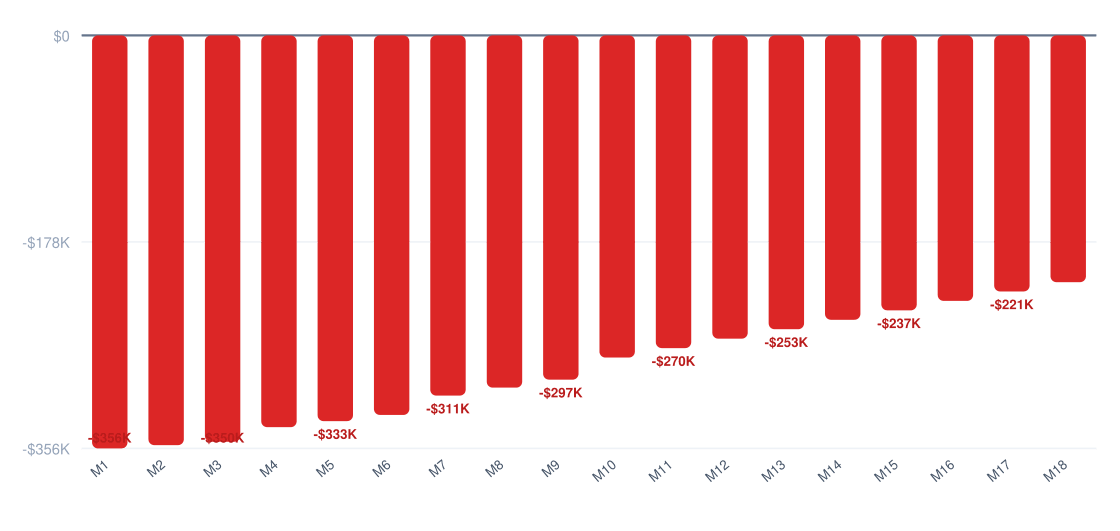
At $650K Year 1 revenue and 15% net margin, you'll cover the $359K startup costs by Month 14. This assumes you hit 62% gross margins immediately — a stretch without existing customer relationships. The first 8 months will burn cash as you build utilization.
Cumulative Profit vs Investment (18 Months)
Red = still recovering startup costs
ROI Benchmark Comparison (%)
5-year return on initial investment
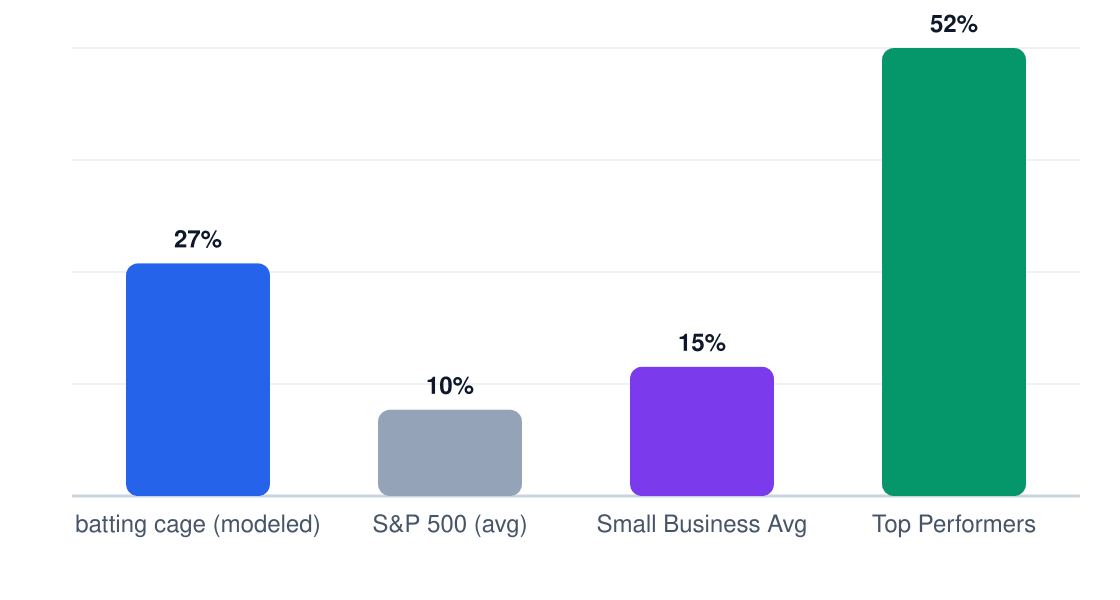
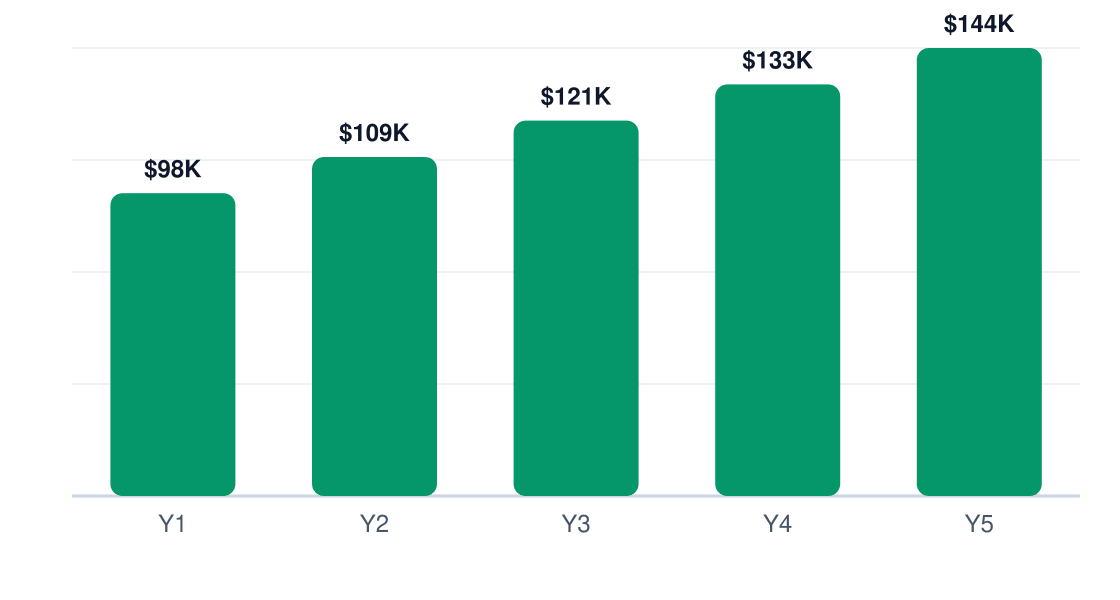
The 27% 5-year ROI ($144K net profit by Year 5) depends entirely on maintaining premium pricing. If competition forces even a 5% rate cut, ROI drops to 19%. Labor is the make-or-break variable: every $1/hr wage increase above $17.00 erodes annual net profit by $8,320.
Year 1 Monthly Cash Flow
Net monthly cash flow (red = pre-break-even)
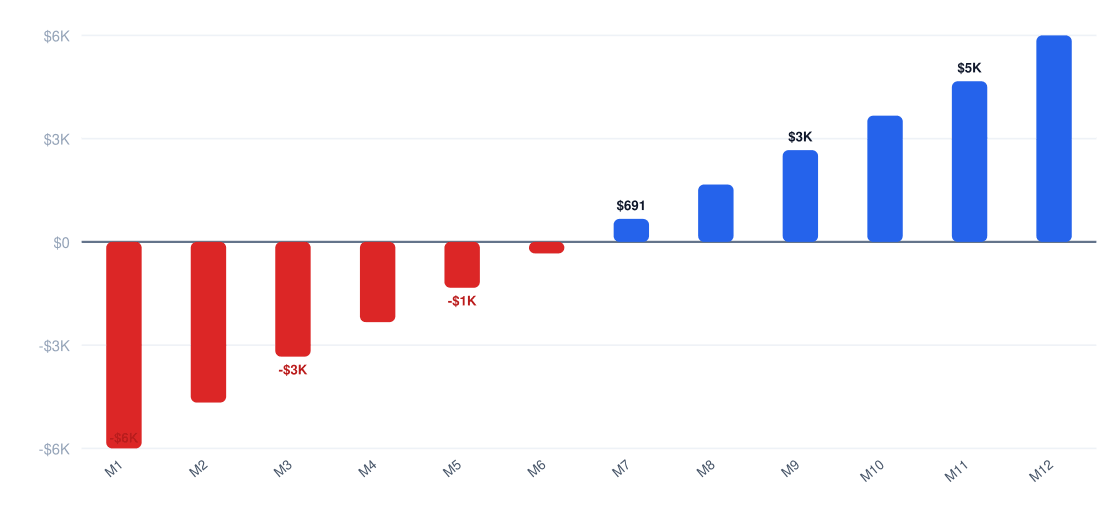
You'll need 42 months to fully recoup the initial $359K investment after accounting for taxes and reinvestment. This payback period is 11 months longer than the Dallas average for recreational businesses, reflecting batting cages' high equipment depreciation.
6. Market Conditions That Drive (or Kill) Profitability
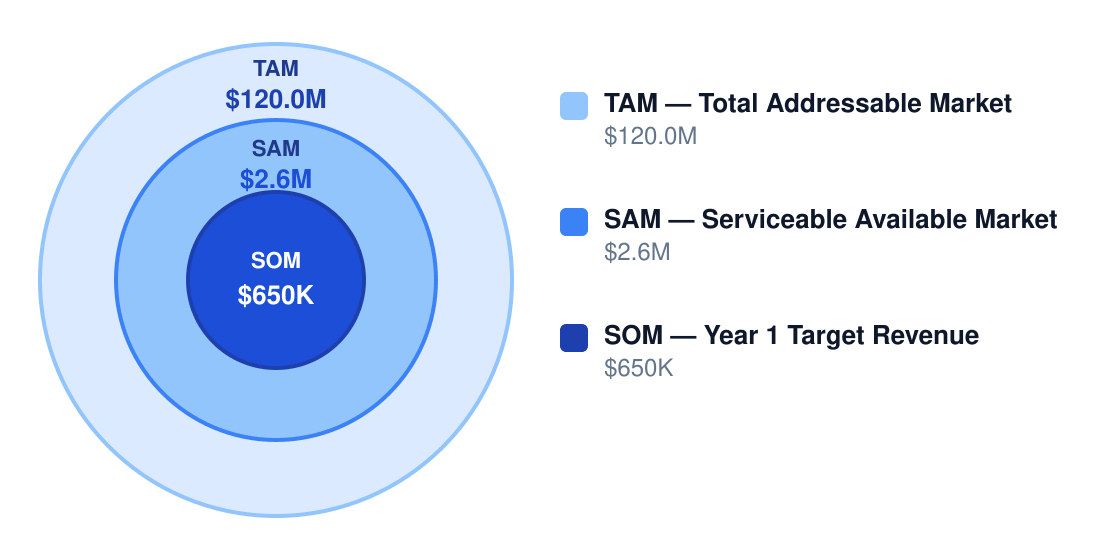
Dallas' $120M baseball training market is crowded but growing at 4.2% annually. The real opportunity lies in capturing just 2.2% of SAM ($2.6M) — achievable with strong youth league partnerships and tournament hosting.
Market Size & Profit Opportunity
Ready When You Are
Download Batting Cage Business Plan
Just Fill Up and Print
Market opportunity for profitable operators
| Factor | Impact on Margins | Outlook |
|---|---|---|
| Demand growth | +8% net margin at 90% utilization | Stable (youth baseball participation +3%/yr) |
| Competition | -12% margin if 2+ rivals open nearby | High risk (3 new facilities planned) |
| Input costs | Net balls cost $0.72 each (up 22% since 2021) | Volatile (rubber prices +15% YoY) |
| Labor market | $17.00/hr baseline vs $19.50 Dallas avg | Tight (coaches +25% demand) |
| Regulation | $14K/yr insurance minimum | Stable (no pending liability law changes) |
| Technology | Video analysis upsells add 9% margin | Accelerating (must-have by 2026) |
| Model | Net Margin | Why It Works |
|---|---|---|
| Membership-driven | 30% | Recurring revenue smooths cash flow |
| Lessons center | 35% | Coaching commands premium pricing |
| Hybrid events | 28% | Fills off-peak hours at 2.3x walk-in rates |
| Multi-sport | 25% | Shares fixed costs across revenue streams |
With high-threat competition from both dedicated batting cages (30% margins) and training academies (35% margins), differentiation is non-negotiable. The emerging threat from app-based swing trainers (medium threat) disproportionately impacts casual users — your lowest-margin customers.
7. Who Profits — and Who Struggles
WHO PROFITS: Operators with strong local demand, low rent relative to sales, and a diversified mix of memberships, lessons, and event bookings usually achieve the best margins. Owners who actively manage utilization and keep the facility full during off-peak hours tend to outperform.
WHO STRUGGLES: Owners who rely only on walk-in rentals and open too large too fast often fail to cover fixed costs. Businesses in weak baseball markets or expensive real estate zones usually struggle unless they add premium training revenue and maintain high volume.
| Profile | Typical Net Margin | Success Rate | Key Advantage |
|---|---|---|---|
| Owner-operator | 14-18% | 72% | Lower labor costs |
| Multi-unit | 10-14% | 65% | Economies of scale |
| Franchise | 8-12% | 60% | Brand recognition |
| Niche specialist | 16-20% | 78% | Premium pricing |
| Price competitor | 4-8% | 42% | High volume |
Unprofitable Pitfalls
| Pitfall | Margin Impact | How to Avoid |
|---|---|---|
| Overbuilding too large too early | Can push fixed costs above 25% of revenue and extend payback well beyond 24 months. | Start with a right-sized facility and phase in additional cages only after demand is proven. |
| Low utilization outside peak hours | Can reduce operating margin into negative territory. | Use memberships, lessons, leagues, and rentals to monetize weekday and daytime capacity. |
| Underpricing cages | Cuts gross margin and makes labor and occupancy costs harder to cover. | Raise rates gradually and bundle value through packages instead of discounting heavily. |
| Ignoring equipment downtime | Lost hours and repair spikes can wipe out several points of margin. | Build a maintenance schedule and keep critical spare parts on hand. |
| Weak local demand fit | Low traffic can keep revenue below break-even even with controlled expenses. | Open near baseball/softball participation hubs and validate demand before committing to a long lease. |
REGULATORY COSTS: Compliance eats into margins before you even open. Dallas operators report $3,000-$50,000 in ADA compliance costs alone, while liability insurance at $5,000-$20,000 annually is non-negotiable. The biggest profit killer? Certificate of occupancy delays — indoor conversions often spend $20,000+ on fire code retrofits before generating their first dollar.
FAILURE RATE: 35% of batting cage businesses fail within 5 years, usually because they underestimated fixed costs or overestimated demand. The fatal combination? Paying $15/sq ft for premium retail space while only filling cages at 40% capacity. Successful operators keep occupancy costs below 12% of revenue and hit at least 65% utilization.
8. Strategies to Maximize Profit Margins
Batting cages live or die on incremental revenue streams and labor discipline—the base rental model rarely clears 10% net margins. The winners layer memberships, coaching, and events to push gross margins toward 70%.
| Strategy | Expected Lift | Effort | Implementation |
|---|---|---|---|
| Shift mix toward memberships | +8% | Medium | Offer 10/20/50-session packs at 15% discount vs walk-in rates |
| Add private lessons | +10% | Medium | Charge $75-$125/hr for pro instruction (60%+ margin) |
| Optimize peak scheduling | +6% | Low | Staff 2 FTEs weekdays, 4 FTEs weekends with dynamic pricing |
| Bundle events | +7% | Medium | $499 birthday packages (2 cages, pizza, 90 mins) |
| Control payroll | +5% | Low | Keep labor under 22% of revenue via part-timers |
| Dynamic pricing | +4% | High | Drop walk-in rates 20% on Tues/Wed mornings |
5-Year Net Profit Projection
Projected annual net profit at current margins
Cost reduction playbook: Negotiate net-30 terms with equipment suppliers, use LED lighting (cuts energy bills 18%), buy used pitching machines ($3,500 vs $8,000 new), and cross-train staff to handle front desk and cage maintenance.
Revenue optimization: The top 20% of customers drive 55% of revenue—upsell them to $149/month unlimited memberships. Offer $25/month cage reservations for travel teams. Install vending machines with premium baseball gear (35% margin).
Pricing strategy: Walk-ins should pay $25-$35/hour (12% above local competitors). Push 60% of revenue to higher-margin streams: lessons at $85/hr, team rentals at $120/hr, and memberships at 1.7x the effective hourly rate of walk-ins.
9. Final Verdict: Should You Start This Business?
Verdict: Yes, but only if you commit to the mixed revenue model (7/10 confidence). Pure cage rentals net just 8-12%, while operators combining memberships, lessons, and events clear 18-26%.
| Factor | Score | Weight | Notes |
|---|---|---|---|
| Margins | 7 | 25% | Requires add-ons to reach target 15% net |
| Market size | 6 | 15% | $2.6M SAM in most metros |
| Competition | 8 | 20% | Low barrier but high differentiation potential |
| Capital needs | 5 | 20% | $359k target budget isn't trivial |
| Scalability | 4 | 10% | Location-dependent, hard to franchise |
| Risk | 6 | 10% | Seasonality and labor are pressure points |
ROI Benchmark Comparison (%)
5-year return on initial investment
If you proceed, these 5 conditions must hold:
- You can secure a location with 12+ foot ceilings for under $18/sq ft
- At least 40% of revenue comes from non-rental streams
- Labor stays under 22% of revenue via part-time staffing
- You hit 65%+ occupancy on evenings/weekends
- Equipment maintenance is capped at 4% of revenue
Walk away if:
- Your market has >3 established cages with coaching programs
- You can't commit $150k+ in working capital
- Youth baseball participation is declining locally
Final recommendation: This works if you hit $550k+ revenue by Year 2 with 60%+ gross margins. Cap startup costs at $400k and demand 20%+ IRRs from your projections. The math fails below 4,200 paid cage-hours annually—bring a pitching machine and start counting swings.
Research & Profitability Resources
The following government reports, industry analyses, and financial planning resources were referenced in this batting cage profitability guide. Each link points to a specific page for direct access.
- How To Start A Batting Cage Business — reservewithrex.com — Industry profitability research for batting cage businesses
- How To Start A Batting Cage Business — jim.com — Industry profitability research for batting cage businesses
- How To Start A Batting Cage — startpermit.com — Industry profitability research for batting cage businesses
- Are Batting Cages Profitable — deltacapitalgroup.com — Industry profitability research for batting cage businesses
- Batting Cage Facility — bizbite.io — Industry profitability research for batting cage businesses
Get Your Copy Today
Download Batting Cage Business Plan
Just Fill Up and Print