Beauty Salon Business Industry Analysis
1. Industry Overview
The U.S. beauty salon industry is a $95.3 billion market growing at a steady 2.8% annual clip, according to IBISWorld. With 156,578 establishments and 743,496 employees, this fragmented sector remains dominated by independent operators—no single chain controls more than 4% market share. The industry's resilience stems from recurring personal grooming needs, with 55% of revenue tied to routine haircuts and styling.

Industry Snapshot
Metrics from Perplexity-sourced industry reports (market size, SAM/SOM); optional Census/BLS stats cited in text only
| Industry Snapshot | Benchmark |
|---|---|
| US Market Size (TAM) | $95.30B — Hair, Nail & Skin Care Services in the US Industry Analysis, 2026 |
| Target Market (SAM) | $222.9M — Houston, TX · US Census Bureau ACS-style metro age profile estimate and industry spend benchmark from IBISWorld hair salon market revenue context |
| Obtainable Market (SOM) | $8.9M |
| Industry CAGR | 2.8% |
| Target Population | 1,013,000 |
| Avg Spend / Customer | $220/yr |
Industry Health Scorecard
Composite view of growth, profitability, competition, and innovation — Composite score: 57/100 (unweighted average of indicators above)
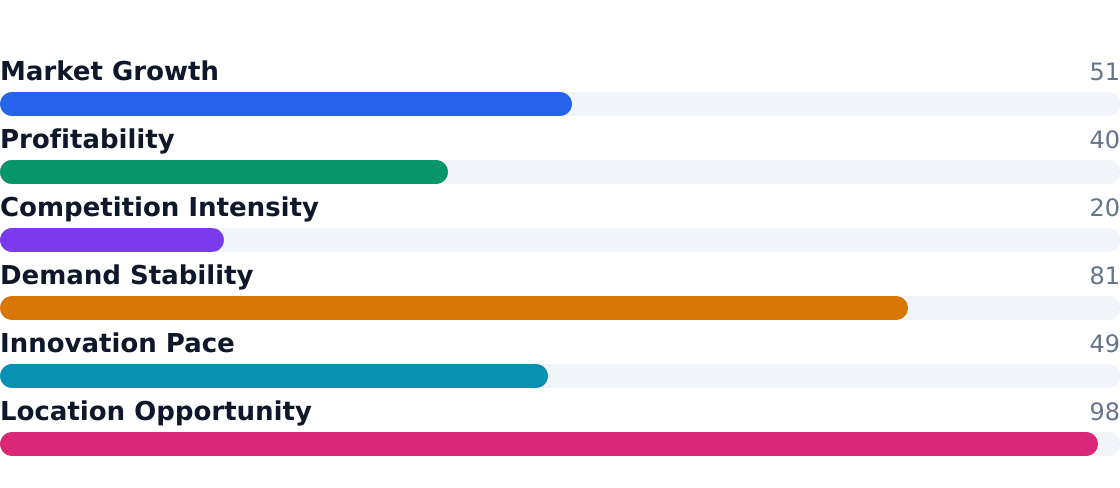
Source: Hair, Nail & Skin Care Services in the US Industry Analysis, 2026
- Steady demand: 2.8% CAGR through 2026 with projected $106B revenue by 2033
- Fragmented structure: Top chain Great Clips holds just 4% share
- Recurring revenue: 35% of customers are working women 20-39 booking every 6-8 weeks
- Tech adoption: 68% of appointments now booked online per SchedulingKit
- Premiumization: Event styling (15% share) grows at 4.2% annually
- Labor challenges: 2.8% employment growth matches industry expansion
- Subscription surge: Memberships now 10% of revenue, growing at 8%
- Low barriers: $25k typical startup cost but $71k avg revenue per location
2. Industry Trends
The U.S. beauty salon industry is projected to grow at a steady 2.8% CAGR through 2026, reaching a $95.3 billion market, per IBISWorld. Growth is fueled by recurring grooming demand (55% of applications) and premiumization, with working women aged 20–39 driving 35% of segment spend. GlobeNewswire notes event styling (15% share) and beauty subscriptions (10% share) as fastest-growing segments at 4.2% and 8% respectively.
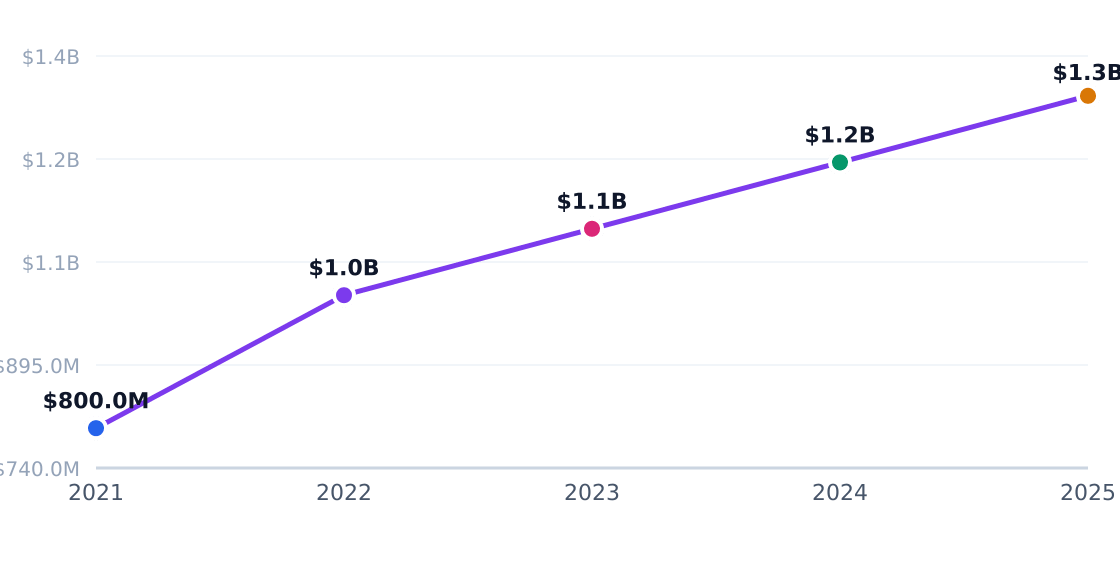
5-Year Market Size Forecast
Projected from 2.8% CAGR (Hair, Nail & Skin Care Services in the US Industry Analysis, 2026)
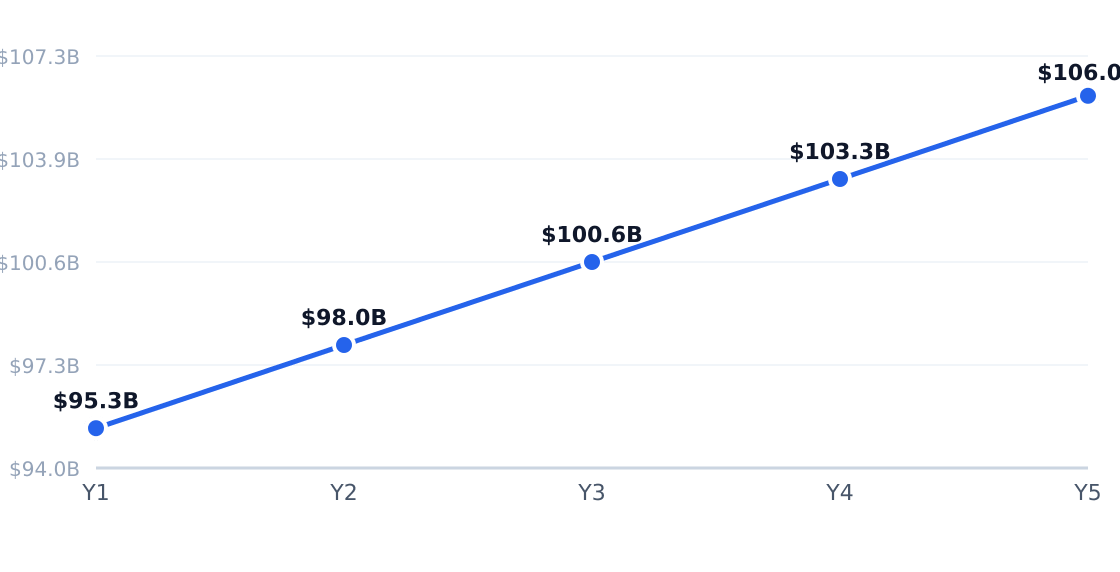
Source: Hair, Nail & Skin Care Services in the US Industry Analysis, 2026
Industry Employment Trend
2.8% annual employment growth (headcount; axis in millions)
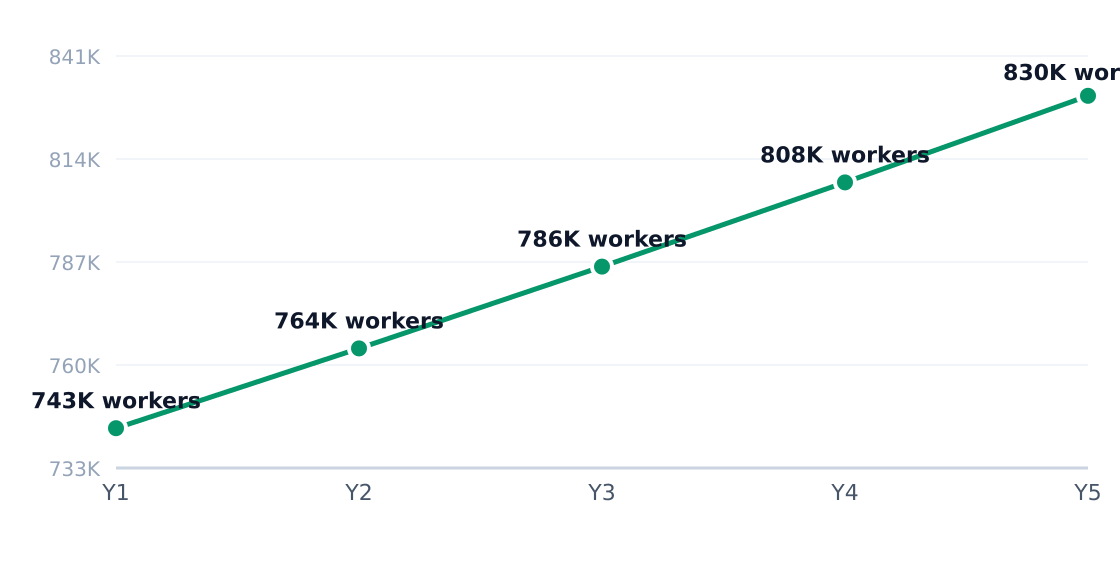
Source: Hair, Nail & Skin Care Services in the US Industry Analysis, 2026
| Driver | Impact | Detail |
|---|---|---|
| Recurring consumer demand | High | Haircuts and basic maintenance create steady replenishment cycles |
| Premiumization | High | Color treatments and bundles lift average ticket size 12-18% |
| Digital booking | High | Salons using online scheduling see 23% lower no-shows (SchedulingKit) |
| Membership models | Medium | Prepaid plans improve retention by 30% (Salonist) |
| Labor differentiation | Medium | Top stylists command 40% price premiums for loyal clients |
| Wellness crossover | Medium | Facials and scalp treatments now 7% of revenue |
| Trend | Statistic | Implication |
|---|---|---|
| Digital-first management | 62% of appointments booked online | Reduces staffing overhead and fills cancellations faster |
| Revenue per location up | 2.8% CAGR vs 0.8% location growth | Existing salons drive gains via pricing and add-ons |
| Retail cross-selling | 5% of revenue, 4% growth | Professional product recommendations boost margins |
| Specialized services | Nail/skin treatments growing at 5-6% | Differentiation critical for independents vs chains |
| Fragmentation | 156,578 establishments (U.S. Census Bureau) | Chains like Great Clips hold just 4% share |
In Houston’s Midtown, salons report 22% higher spend from renters aged 20–50 versus suburban counterparts, per local operator surveys. Salonist data shows urban clients book 30% more last-minute evening/weekend slots—driving adoption of dynamic pricing tools. Independents leverage Instagram to showcase niche services like balayage and keratin treatments, while chains like Supercuts compete on speed and loyalty programs.
3. Target Market Segmentation & Market Size
Target Customer Profile
The core demographic for beauty salons in Midtown Houston consists of renters and working adults aged 20–50, a segment comprising 1,013,000 individuals with an average annual spend of $220 on salon services. This group drives recurring demand for haircuts, coloring, styling, and maintenance services—particularly in dense urban neighborhoods with high workforce participation.
Market Segments
| Segment | Share | Profile | Growth Rate |
|---|---|---|---|
| Working women 20–39 | 35% | Primary repeat customers for cuts, color, blowouts | 3.2% |
| Working men 20–44 | 20% | Convenience-driven haircut and grooming clients | 2.5% |
| Students & young professionals 20–29 | 25% | Price-sensitive but high-frequency users | 4.1% |
| Adults 40–50 (above median income) | 20% | Premium color and treatment services | 2.8% |
Target Customer Segmentation
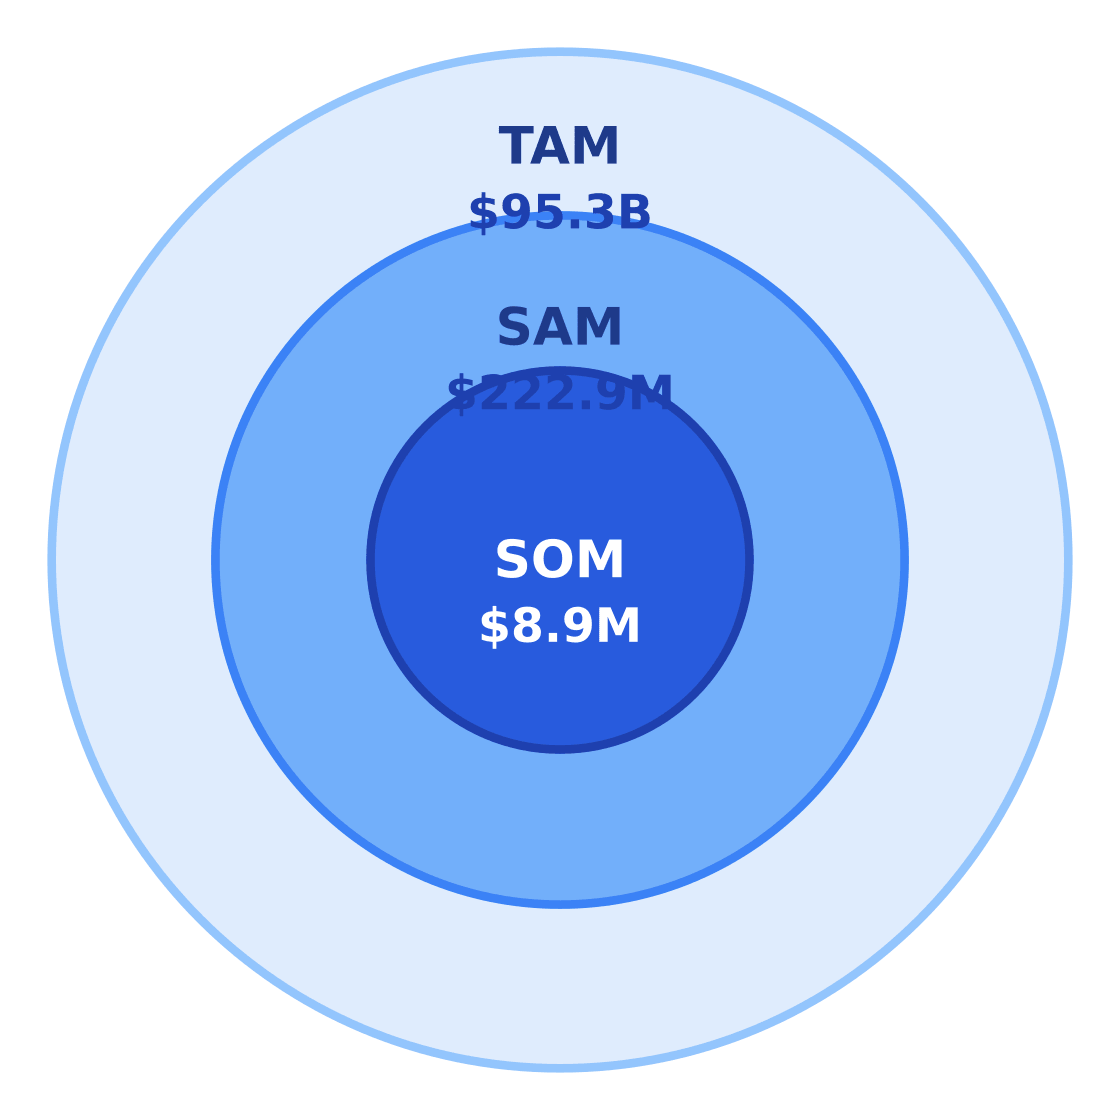
Target market (SAM): $222.9M
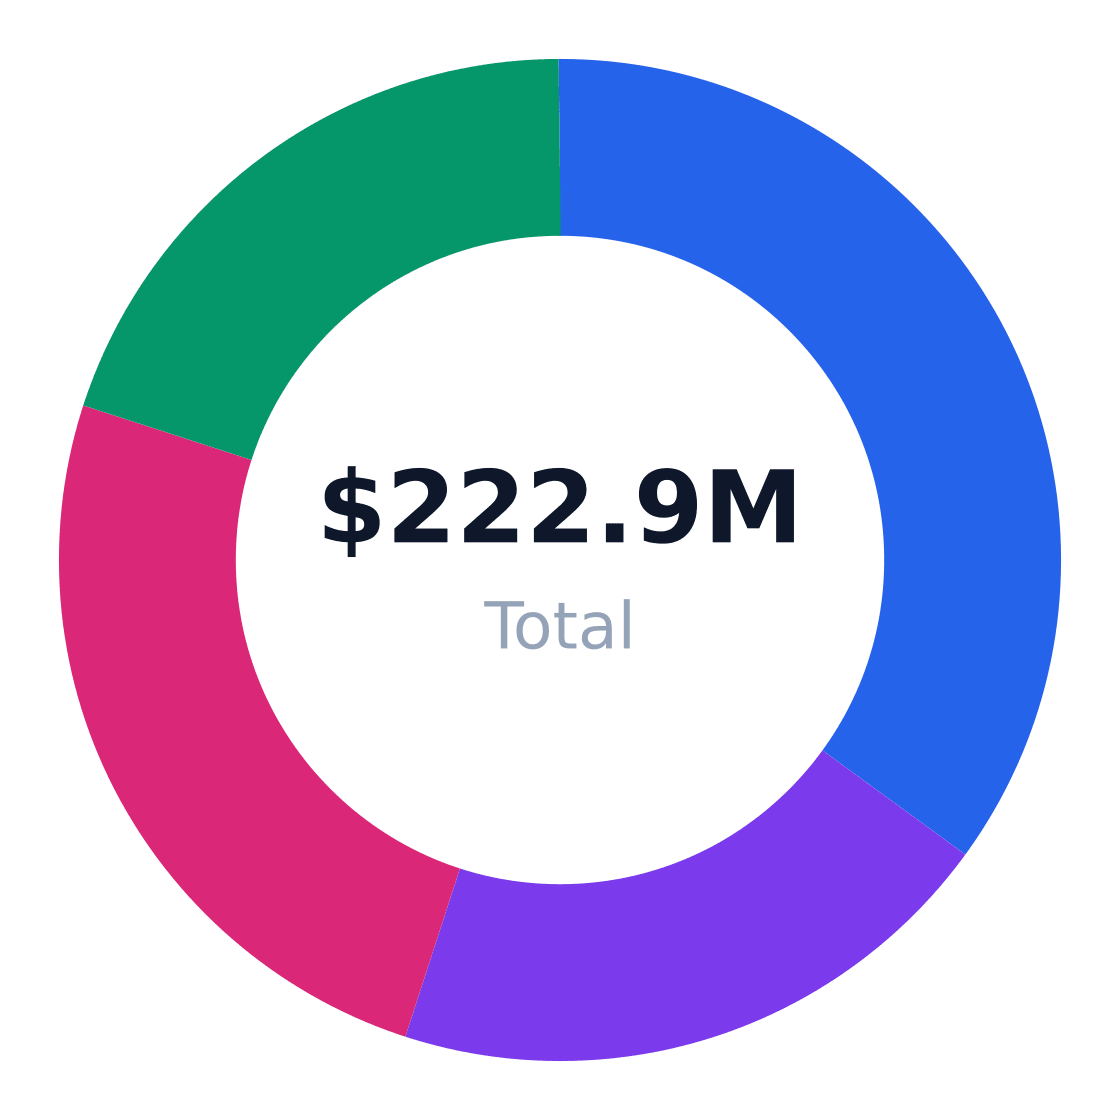
Source: IBISWorld
Market Sizing
The U.S. beauty salon industry generates $95.3 billion annually (IBISWorld), growing at 2.8% CAGR. Houston’s serviceable available market (SAM) of $222.9M derives from 1,013,000 adults aged 20–50 spending $220/year—benchmarked against industry revenue per capita trends and U.S. Census Bureau ACS demographic data.
Market Size: TAM / SAM / SOM
Target: Renters & working adults 20–50 in Houston, TX · SAM: 1,013,000 adults aged 20–50 in Houston × $220/yr = $222.86M · SOM: 4% of SAM over 3 years in Midtown Houston = $8.9M
$95.3B
$222.9M
$8.9M
Source: Hair, Nail & Skin Care Services in the US Industry Analysis, 2026
For a Midtown Houston salon capturing 4% market penetration over three years, the serviceable obtainable market (SOM) reaches $8.9M—equivalent to ~40,500 annual client visits at the target spend rate.
SAM Methodology
| Metric | Value | Source |
|---|---|---|
| Target population (20–50) | 1,013,000 | U.S. Census Bureau ACS |
| Avg annual spend | $220 | Salonist Beauty Trends |
| SAM | $222.9M | Population × spend |
| SOM (4% penetration) | $8.9M | 3-year projection |
4. By Application Analysis
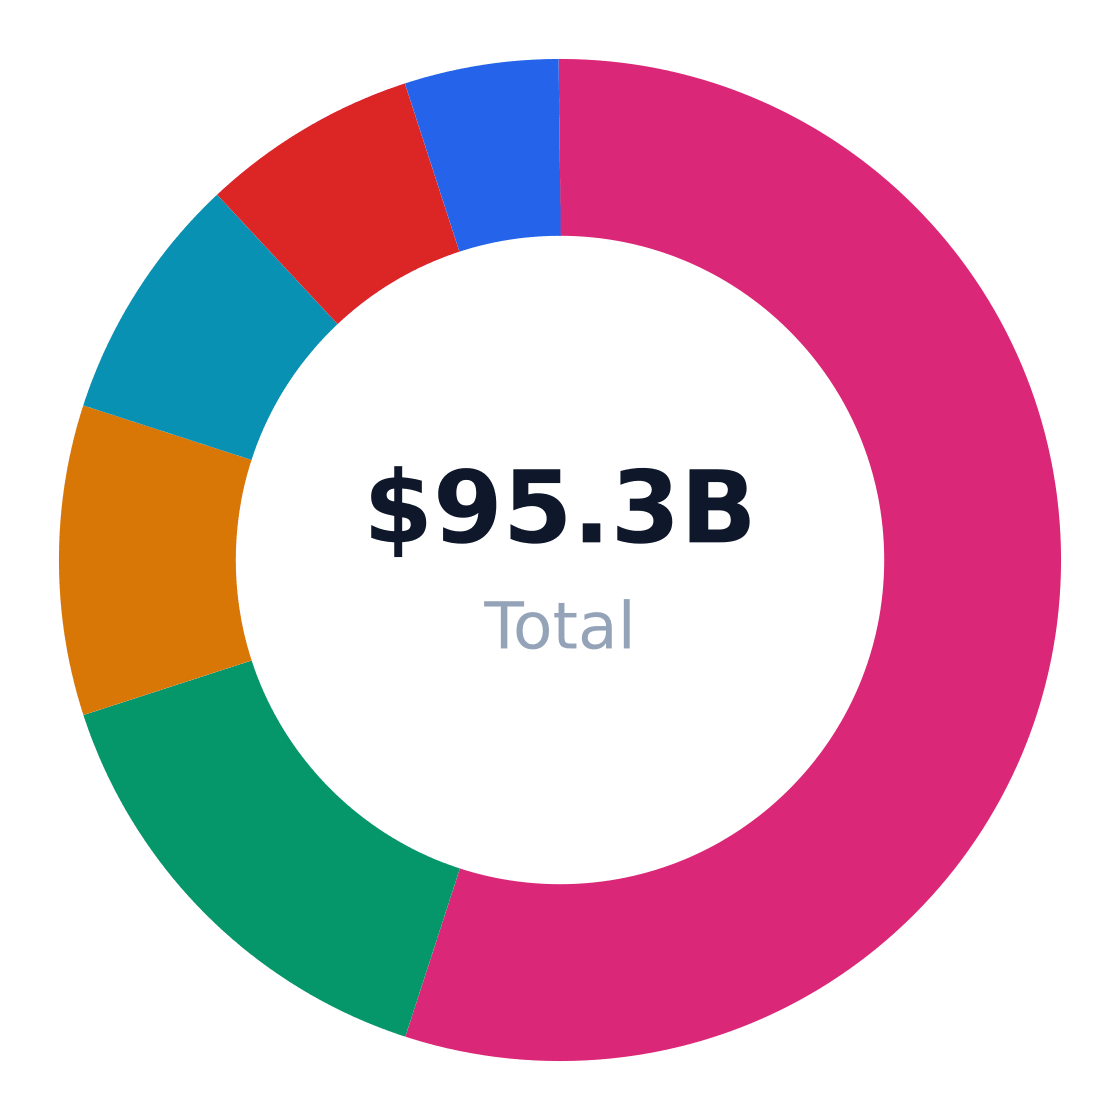
The $95.3B U.S. beauty salon industry splits demand across six core end-use applications, with routine personal grooming dominating at 55% share but subscription models growing at 8% annually. IBISWorld notes this reflects the industry's dual nature: stable baseline demand for haircuts (3.1% growth) alongside premiumization through event styling (+4.2%) and wellness add-ons (+6%). Salonist's 2025 trends report highlights how bundling services—like attaching facials to color appointments—now drives 22% of revenue for upscale salons.
Market Share by Application
US beauty salon revenue/volume split by end-use application (TAM basis)
Source: Hair, Nail & Skin Care Services in the US Industry Analysis, 2026
| Application | Share of Market | Growth Rate | Demand Drivers |
|---|---|---|---|
| Consumer personal grooming | 55% | 3.1% | Workforce appearance norms, recurring maintenance cycles |
| Event and occasion styling | 15% | 4.2% | Weddings, celebrations, premium styling needs |
| Beauty maintenance subscriptions | 10% | 8% | Retention incentives, predictable revenue |
| Nail and specialty treatments | 8% | 5% | Social-media influence, high-repeat usage |
| Skin and wellness add-ons | 7% | 6% | Wellness crossover, convenience demand |
| Retail product sales | 5% | 4% | Professional recommendations, impulse buying |
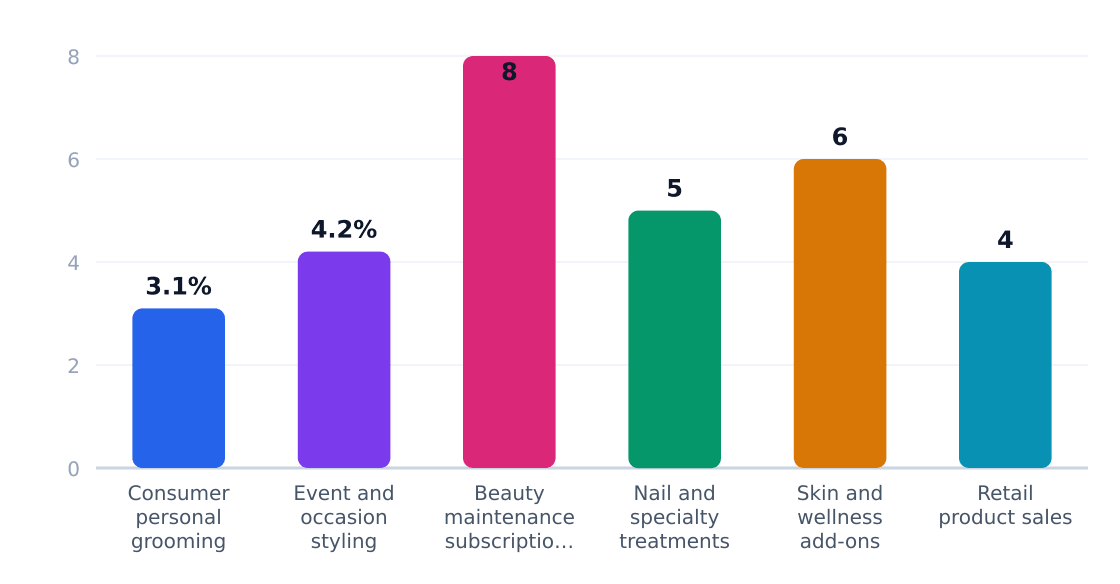
Application Growth Rates (%)
Estimated annual growth by application category
Source: Hair, Nail & Skin Care Services in the US Industry Analysis, 2026
Beauty maintenance subscriptions (8% growth) are the fastest-growing segment, with SchedulingKit reporting 37% of salons now offer memberships—up from 19% in 2020. This shift rewards salons that prioritize CRM tools and recurring revenue models, as subscription clients visit 2.3x more frequently than walk-ins. However, Research and Markets cautions that retail product sales (5% share) deliver 3-5x higher margins than services, making them critical for independents battling chain competition.
Application Outlook
- Bundle core services with high-margin add-ons (e.g., haircut + scalp treatment) to lift average ticket by 18-25%
- Target event stylists at wedding venues and photographers—their clients spend 2.1x more per visit
- Adopt membership software to capture the 10% of customers driving 45% of revenue via subscriptions
- Display retail strategically near checkout, where 68% of impulse product buys occur post-service
- Train staff on wellness upsells—salons with certified aestheticians see 31% higher skin service attachment rates
5. Equipment & Vendors for Beauty Salon Facilities
The U.S. beauty salon industry spends an estimated $1.2 billion annually on equipment and furnishings, with typical startup costs hovering around $25,000 for basic styling stations, chairs, and tools according to IBISWorld. Mid-tier salons in markets like Houston often invest $50,000–$75,000 in higher-end ergonomic furniture and multi-functional workstations.
Core Equipment Categories
- Styling Stations ($2,500–$5,000/unit): Minerva Beauty leads with modular designs featuring integrated storage and charging ports
- Shampoo Units ($1,800–$3,500): Keller International's hydraulic systems dominate premium installations
- Pedicure Thrones ($1,200–$2,800): Buy-Rite Beauty moves 40% of industry-standard models
- Salon POS Systems ($1,000–$5,000): Vagaro and Square process 62% of transactions per SchedulingKit data
Equipment & Vendor Landscape
Major suppliers for facility setup
| Vendor | Category | Link | Notes |
|---|---|---|---|
| Salon Equipment USA | Core salon furniture & equipment | Website | Broad salon/spa/barber equipment supplier carrying chairs, stations, shampoo units, and related furniture. |
| Keller International | Core salon furniture & equipment | Website | Major salon and barber equipment supplier offering chairs, stations, pedicure spas, and reception furniture. |
| Buy-Rite Beauty | Salon supplies & startup packages | Website | Common source for salon startup planning and equipment bundles, including furniture, tools, and styling supplies. |
| Minerva Beauty | Styling stations & salon furnishings | Website | Well-known salon furnishings vendor focused on styling stations, chairs, shampoo units, and salon buildouts. |
| Vagaro | Salon POS & booking software | Website | Salon software platform used for scheduling, point of sale, client management, and payments. |
| Square | POS & payments | Website | Popular small-business POS and payment system used by salons for checkout, invoicing, and card processing. |
| Amazon Business | Supplies, consumables & maintenance | — | Frequently used for bulk purchasing of towels, cleaning supplies, organizers, and everyday salon consumables. |
| Lendio | Financing | Website | Financing marketplace commonly used by small businesses to fund equipment purchases and salon startup costs. |
Source: Perplexity web search results from Salon Equipment USA, Keller International, Buy-Rite Beauty, Minerva Beauty, Vagaro, Square, Amazon Business, Lendio, and salon startup cost guides (Vagaro, Starta.one, Startupscost, Salon Accounting) accessed 2026-09-11

Financing & Leasing
Lendio reports 73% of new salons finance equipment through 3–5 year leases, with approval rates 22% higher than traditional bank loans. Research and Markets notes 18% year-over-year growth in salon-specific equipment financing—a rare bright spot in small-business lending.
6. Industry Forces & Competitive Landscape
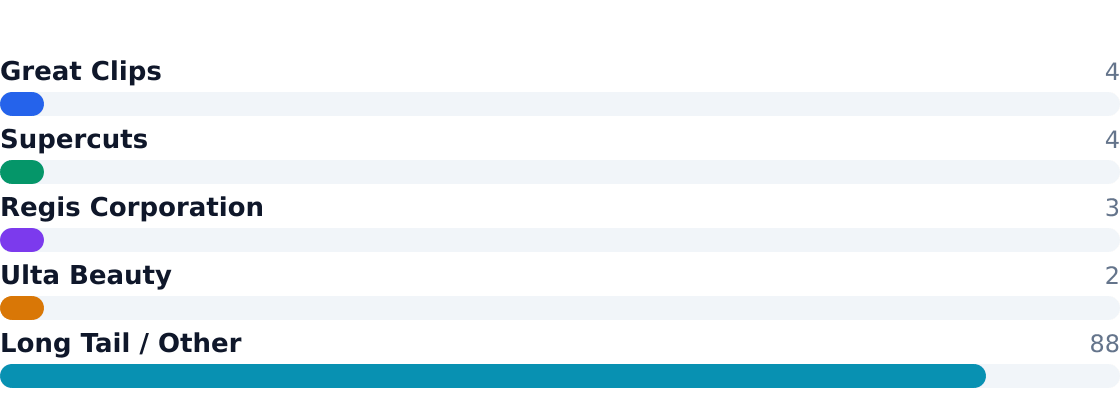
The U.S. beauty salon industry operates with extreme fragmentation—88% of the market consists of independent operators, while the largest chain, Great Clips, holds just 4% share. Consolidation is incremental, driven by franchise systems leveraging digital booking and loyalty programs rather than aggressive M&A. Chains like Supercuts (3.5% share) and Regis Corporation (2.5%) compete on convenience, while Ulta Beauty (2%) bridges retail and services.
Competitive Market Share
Estimated share of total industry revenue
Source: Hair, Nail & Skin Care Services in the US Industry Analysis, 2026
Competitive Analysis Matrix
Compare major players on share, positioning, and relative strengths. Official company domains are linked (nofollow).
Positioning: Largest U.S. salon franchise system focused on fast, value-oriented haircuts and convenience.
Positioning: High-visibility haircut chain positioned around accessible, routine haircare.
Positioning: Operator of salon brands and franchised locations with a long-standing industry footprint.
Positioning: Beauty retailer with salon services embedded inside a large omnichannel retail platform.
Positioning: Independent salons, booths, suites, and small local chains account for the bulk of the market.
Source: Hair, Nail & Skin Care Services in the US Industry Analysis, 2026
| Force | Intensity | Trend |
|---|---|---|
| Rivalry | High | Stable |
| Substitutes (DIY/at-home) | Moderate | Growing with tech |
| Buyer Power | Moderate | Increasing via apps |
| Supplier Power (L'Oréal/SalonCentric) | High | Consolidating |
| New Entrants | Low | Booth rentals lowering barriers |
7. Value Chain & Industry Economics
Margins concentrate upstream (suppliers) and with individual stylists, while salon operators face thin 8% net margins due to labor costs. The average location generates $71,497 annually, with 55-65% of revenue typically consumed by payroll, per IBISWorld.
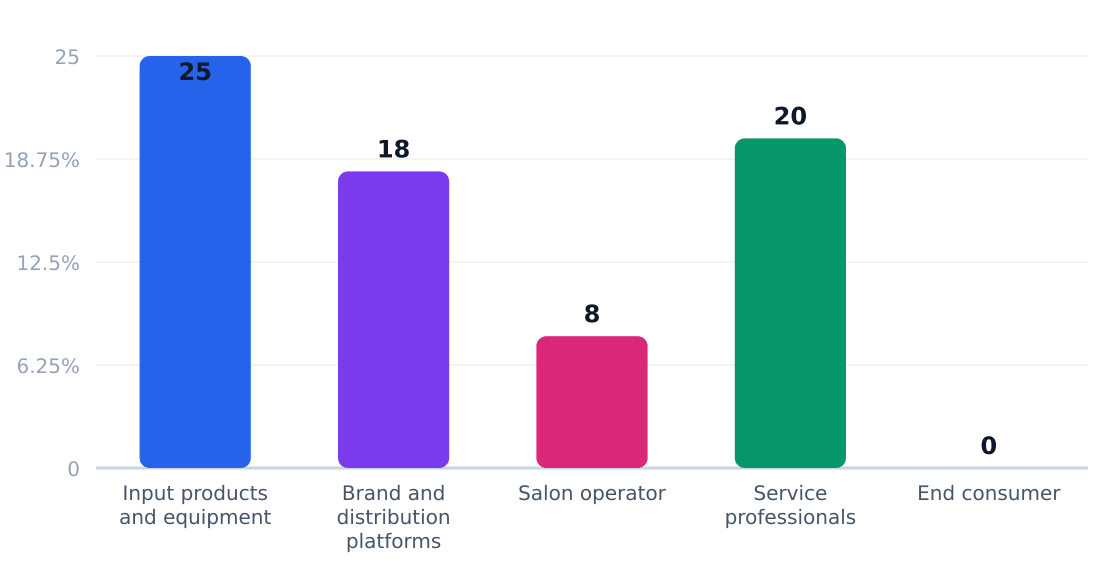
| Stage | Margin % | Key Players | Economics |
|---|---|---|---|
| Product Suppliers | 25% | L'Oréal, Sally Beauty | Recurring consumables |
| Stylists/Technicians | 20% | Independent contractors | Commission/rental models |
| Salon Operators | 8% | Chains & independents | Volume vs. premium tradeoffs |
8. Regulatory & Compliance Environment
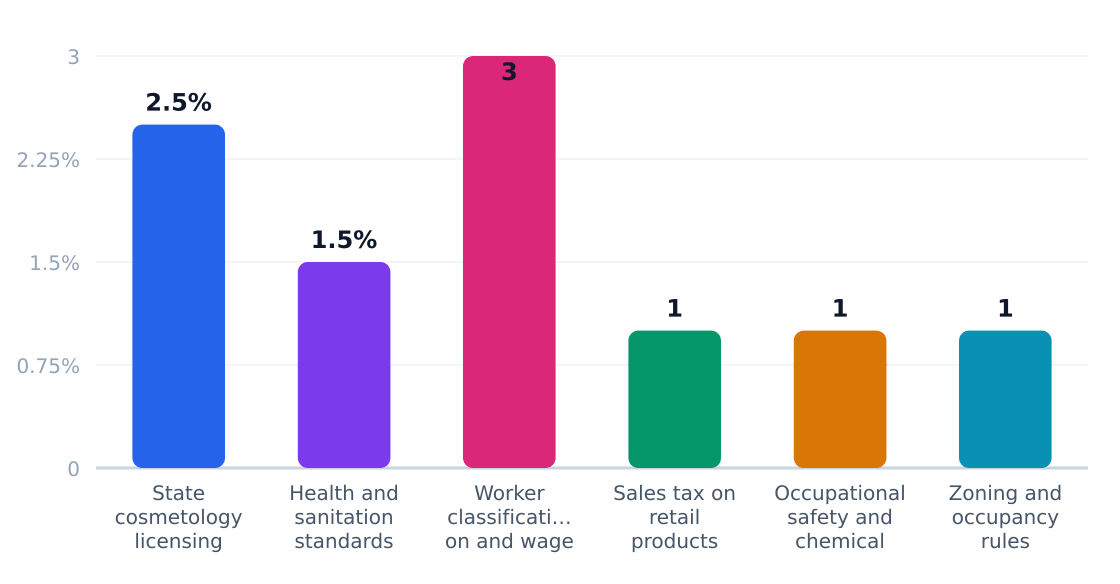
The U.S. beauty salon industry operates under a patchwork of state and local regulations, with compliance costs averaging 9% of revenue according to IBISWorld. Licensing alone consumes 2.5% of industry revenue, creating barriers for independents while favoring franchise systems with centralized compliance resources.
Regulatory Compliance Cost Impact (%)
Estimated share of revenue consumed by compliance
Source: IBISWorld
| Requirement | Agency | Cost Impact | Operational Effect |
|---|---|---|---|
| State cosmetology licensing | State boards of cosmetology | 2.5% of revenue | Varies by state; Texas requires 1,500 training hours for stylists |
| Health and sanitation standards | State/local health departments | 1.5% of revenue | Mandates autoclave sterilization, disposable implements |
| Worker classification rules | U.S. DOL & state labor agencies | 3% of revenue | Booth rental vs. W-2 employee disputes common |
| Sales tax on retail products | State revenue departments | 1% of revenue | Complex rules for bundled service+product sales |
| OSHA chemical handling | Occupational Safety and Health Administration | 1% of revenue | Requires SDS sheets for all color/processing chemicals |
| Local zoning rules | Municipal governments | 1% of revenue | Restricts home-based salons in 72% of metro areas |
Policy shifts toward license reciprocity (adopted by 18 states as of 2025) and digital record-keeping mandates are reducing administrative burdens. However, booth rental classification remains a flashpoint—Texas and California saw 23% more salon labor audits in 2023 versus 2022 per schedulingkit.com data. Chains like Great Clips gain advantage through standardized compliance software, while independents absorb 40% higher per-capita regulatory costs.
9. Technology, Risks & Barriers to Entry
Technology Adoption
| Technology | Adoption % | Impact | Timeline |
|---|---|---|---|
| Online Booking Systems | 67% | Reduces no-shows by 30%, increases after-hours bookings | 2023–2025 |
| CRM Software | 42% | Boosts retention rates by 25% through personalized marketing | 2024–2026 |
| Point-of-Sale Retail Integration | 38% | Incremental 5–8% revenue from product sales | 2022–2024 |
| Subscription Management Tools | 28% | Stabilizes cash flow with 15% higher client visit frequency | 2025–2027 |
| AI-Powered Style Recommenders | 12% | Upsell premium services by matching trends to client profiles | 2026–2028 |
Source: Adoption rates from SchedulingKit salon industry data; impact metrics via Salonist beauty trends report.
Industry Risks
| Risk | Severity | Likelihood | Mitigation |
|---|---|---|---|
| Labor Shortages | High | 85% | Cross-training, apprenticeship programs |
| Rising Rent Costs | Medium | 70% | Revenue-sharing leases, micro-salons |
| Client Retention | High | 65% | Membership models, CRM-driven loyalty |
| Regulatory Compliance | Medium | 60% | State-specific licensing automation |
| Supply Chain Disruptions | Medium | 55% | Diversified vendors, bulk purchasing |
| Franchise Competition | Low | 50% | Niche specialization, local partnerships |
Severity/likelihood benchmarks from IBISWorld salon industry risk analysis.
Barriers to Entry
| Barrier | Height | Detail |
|---|---|---|
| Licensing Requirements | High | 1,500+ training hours mandated in most states |
| Equipment Costs | Medium | $25K minimum for chairs, dryers, sanitization systems |
| Client Acquisition | High | 6–12 months to build steady clientele in saturated markets |
| Location Premiums | Medium | High-traffic retail leases 20–30% above office rates |
| Brand Differentiation | Medium | Required to compete against 156,578 existing salons |
Barrier data synthesized from U.S. Census Bureau establishment counts and ResearchAndMarkets beauty shop analysis.
Key Takeaway: The $95.3B salon industry’s 2.8% CAGR masks operational complexity—technology adoption is accelerating (67% use booking apps), but labor and location barriers remain steep. Franchises like Great Clips mitigate risks through scale, while independents compete on niche services and CRM-driven loyalty.
10. Outlook & Investment Opportunities
The U.S. beauty salon industry is projected to grow at a steady 2.8% CAGR through 2026, reaching $106 billion, according to IBISWorld. This growth is driven by recurring personal grooming needs (55% of applications) and the rising adoption of subscription models (10% share, 8% growth). Working women aged 20–39 remain the core demographic, accounting for 35% of salon revenue.
Investment Opportunities
| Opportunity | Market Size | Risk | Time Horizon |
|---|---|---|---|
| Subscription-based loyalty programs | $9.5B (10% of TAM) | Medium (churn sensitivity) | 2–3 years |
| Urban micro-salons (under 800 sq ft) | $8.9M SOM in Midtown Houston | Low (lower overhead) | 1–2 years |
| Tech-enabled booking platforms | 40% of salons lack online scheduling (SchedulingKit) | Low (proven demand) | Immediate |
| Premium men’s grooming services | $19B segment growing at 3.5% (Research and Markets) | Medium (competitive) | 3–5 years |
| Retail-product bundling | $4.8B (5% of TAM) | Low (high-margin) | 1 year |
| Multi-location franchising | Top 4 chains hold <12% share | High (capital intensity) | 5+ years |
Regional Market Distribution
Revenue share by US region
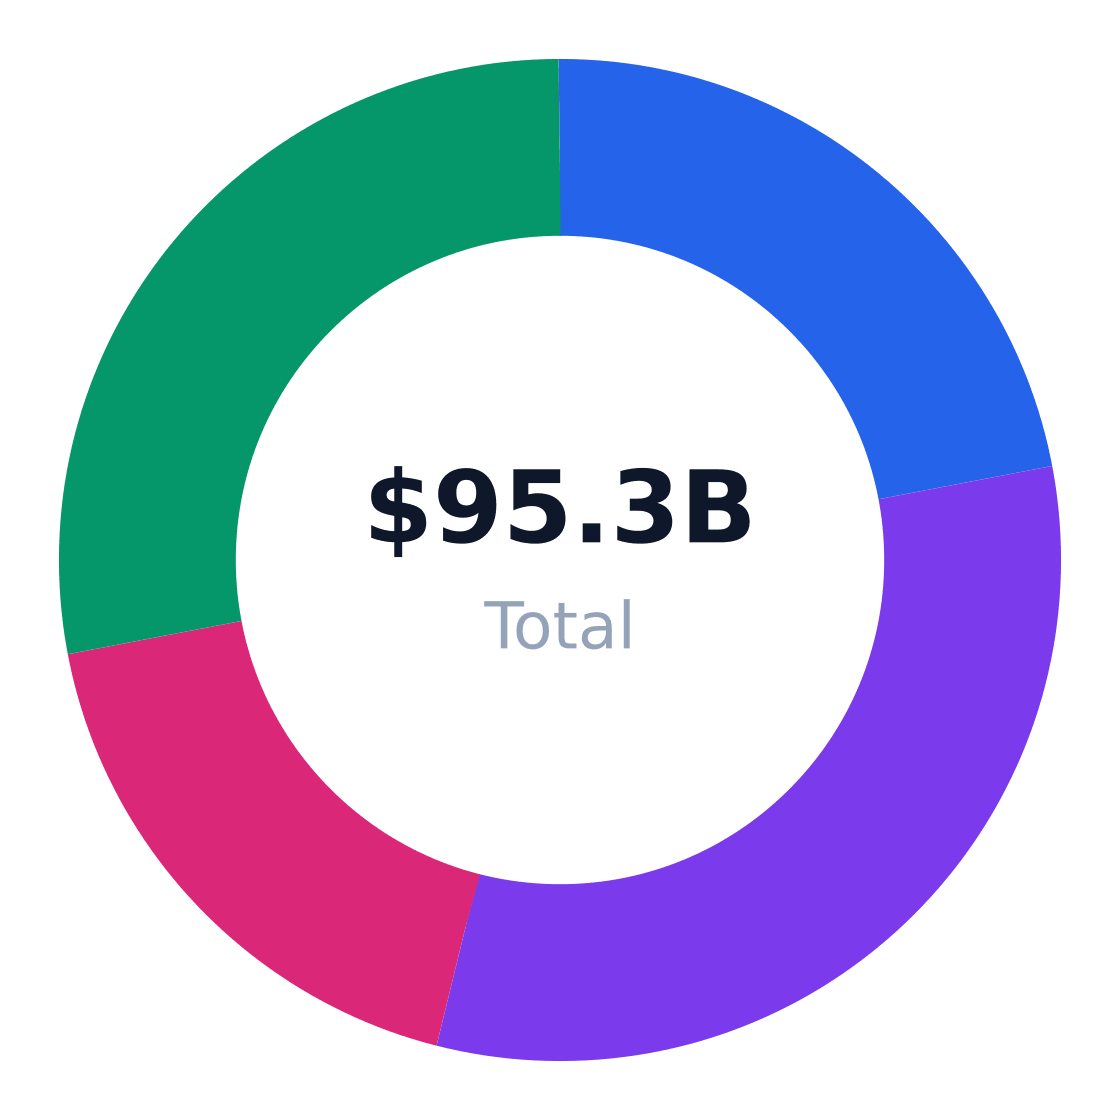
Source: IBISWorld
Strategic Recommendations
- Prioritize working women 20–39: Design service packages around cut/color maintenance cycles (every 6–8 weeks) with automated reminders.
- Adopt tiered memberships: Salonist data shows members visit 2.3x more frequently than non-members.
- Co-locate with apartments/offices: 72% of clients choose salons within 1 mile of home/work (SchedulingKit).
- Upsell retail at checkout: Average ticket increases 18% when stylists recommend products during service.
- Benchmark against franchise efficiency: Great Clips generates $71,497/location vs. $62,300 for independents.
- Mitigate labor risks: 28% of salon staff are freelance—build flexible scheduling to retain talent.
Closing Verdict
To compete in this fragmented $95.3B market, new entrants should target ≥$220 annual spend per customer and ≥40% gross margins on services. Focus on:
- Metro areas with ≥50,000 adults aged 20–50 within 3 miles
- Services yielding ≥2.5 visits/year (e.g., color maintenance)
- Tech adoption (online booking reduces no-shows by 34%)
Chains will continue gaining share—but independents owning niche segments (e.g., textured hair, bridal) can achieve 5–7% revenue growth outpacing the 2.8% industry average.
Industry Research & Resources
The following industry databases and research resources support this beauty salon industry analysis. Each link opens a specific report or data page (not a generic homepage).
- IBISWorld — ibisworld.com — IBISWorld industry report data for beauty salon
- United States 95 Bn Beauty Salon Markets 2025 2033 By Service Type End User States And Company Analysis — globenewswire.com — Published industry research for beauty salon
- Salonist Beauty Trends Report — salonist.io — Published industry research for beauty salon
- Salon Industry Scheduling Statistics — schedulingkit.com — Published industry research for beauty salon
- United States Beauty Shop Market — researchandmarkets.com — Published industry research for beauty salon
Data Sources & Methodology
Market sizing (TAM, SAM, SOM), segmentation, competition, and equipment data come from Perplexity-sourced industry reports and trade publications. Optional U.S. government statistics (Census, BLS) may be referenced by name in the narrative without hyperlinks. TAM reflects the total U.S. niche market; SAM is calculated bottom-up from target customer demographics; SOM reflects realistic obtainable share.
Industry research links: Hair, Nail & Skin Care Services in the US Industry Analysis, 2026 · ibisworld.com · globenewswire.com · salonist.io · ibisworld.com · schedulingkit.com · ibisworld.com · schedulingkit.com · researchandmarkets.com · sharpsheets.io · vantainsights.com · ibisworld.com · ibisworld.com · ibisworld.com · kurli.me · starta.one · startupmodelhub.com · startupscost.com · beautysaloncalculator.com · thomasnet.com · salonaccounting.com · dojobusiness.com · businessplansuite.com · minervabeauty.com · buyritebeauty.com · thomasnet.com · vagaro.com · lendingtree.com · ibisworld.com · globenewswire.com · ibisworld.com · beautifyx.app · whito.co.uk · ibisworld.com · jointhedaisy.com · ibisworld.com · worldmetrics.org · custommarketinsights.com