Beauty Supply Business Industry Analysis
1. Industry Overview
The US beauty supply industry is a $36.5 billion retail sector specializing in hair care, cosmetics, and grooming products, with IBISWorld reporting a steady 5.9% CAGR through 2029. The market remains fragmented, with the top four chains collectively holding less than 45% share, per Reed Intelligence. Approximately 85,000 businesses operate nationally, averaging $427,300 in annual revenue per location.
Industry Snapshot
Metrics from Perplexity-sourced industry reports (market size, SAM/SOM); optional Census/BLS stats cited in text only

Free Business Plan Download
Download Beauty Supply Business Plan
Just Fill Up and Print
| Industry Snapshot | Benchmark |
|---|---|
| US Market Size (TAM) | $36.50B — Beauty Supply Stores in the US - Market Size (2019-2029) |
| Target Market (SAM) | $374.0M — Houston, TX · IBISWorld Beauty Supply Stores in the US; Houston age profile assumed from metro demographic mix |
| Obtainable Market (SOM) | $15.0M |
| Industry CAGR | 5.9% |
| Target Population | 1,700,000 |
| Avg Spend / Customer | $220/yr |
Industry Health Scorecard
Composite view of growth, profitability, competition, and innovation — Composite score: 64/100 (unweighted average of indicators above)
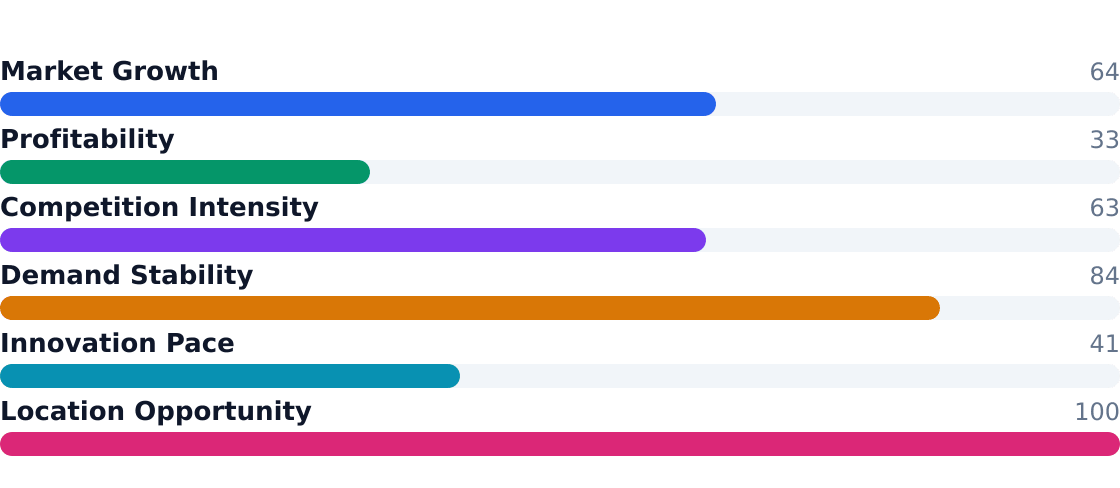
Source: Beauty Supply Stores in the US - Market Size (2019-2029)
Key Takeaways
- Pros: Replenishment-driven demand (32% personal grooming share), ethnic hair care growing at 6.8%, and low customer acquisition costs in urban trade areas
- Pros: Professional salon supply segment (21% share) creates sticky B2B relationships with stylists
- Pros: Wigs/extensions category expanding at 7.1% due to fashion trends and protective styling adoption
- Pros: Houston metro SAM of $374M offers density of target demographics (34% Black women, 28% Hispanic women)
- Cons: 4% SOM penetration in East Downtown reflects intense local competition
- Cons: $100k equipment startup costs create barriers for independents
- Cons: Digital-native brands and Amazon eroding margins in tools/appliances (10% share)
- Cons: Sally Beauty's 18% share creates pricing pressure on specialty assortments
Structural shifts include private-equity-backed consolidation (Vertical IQ notes 3.9% employment growth) and omnichannel fulfillment reshaping urban store economics. The U.S. Census Bureau reports 606,091 establishments industry-wide, but beauty supply remains a specialized niche within broader retail.
2. Industry Trends
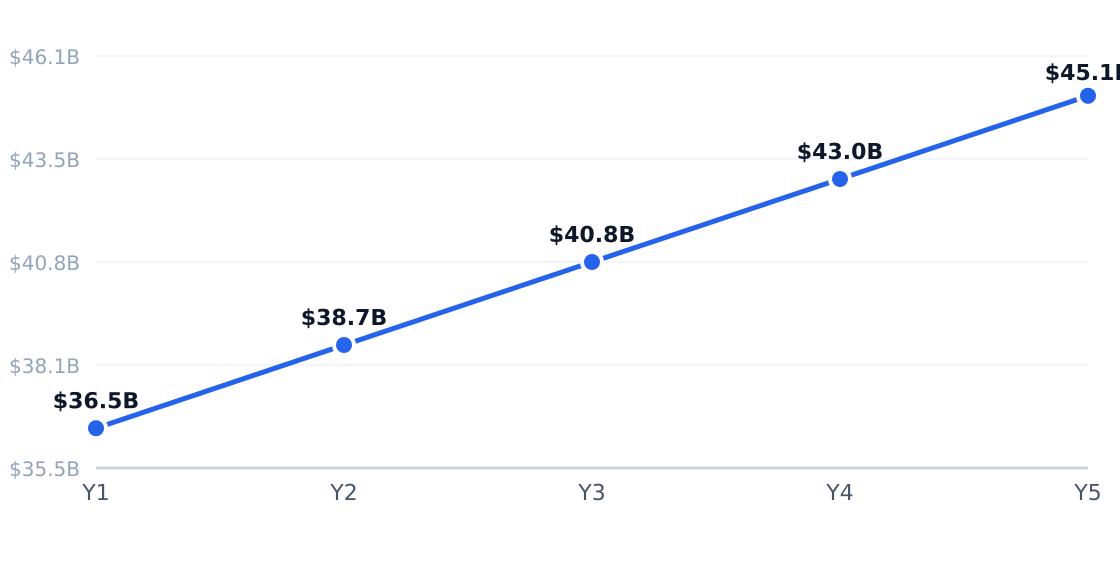
The US beauty supply industry is growing at a steady 5.9% CAGR, reaching $36.5 billion in 2024, according to IBISWorld. This expansion is fueled by ethnic hair care specialization, omnichannel retail, and premiumization—particularly in Houston's East Downtown, where 1.7 million adults aged 20–50 drive $374 million in local demand. Reed Intelligence notes textured hair products and wigs (growing at 6.8% and 7.1% annually, respectively) as key profit centers.
5-Year Market Size Forecast
Projected from 5.9% CAGR (Beauty Supply Stores in the US - Market Size (2019-2029))
Source: Beauty Supply Stores in the US - Market Size (2019-2029)
Industry Employment Trend
3.9% annual employment growth (headcount; axis in millions)
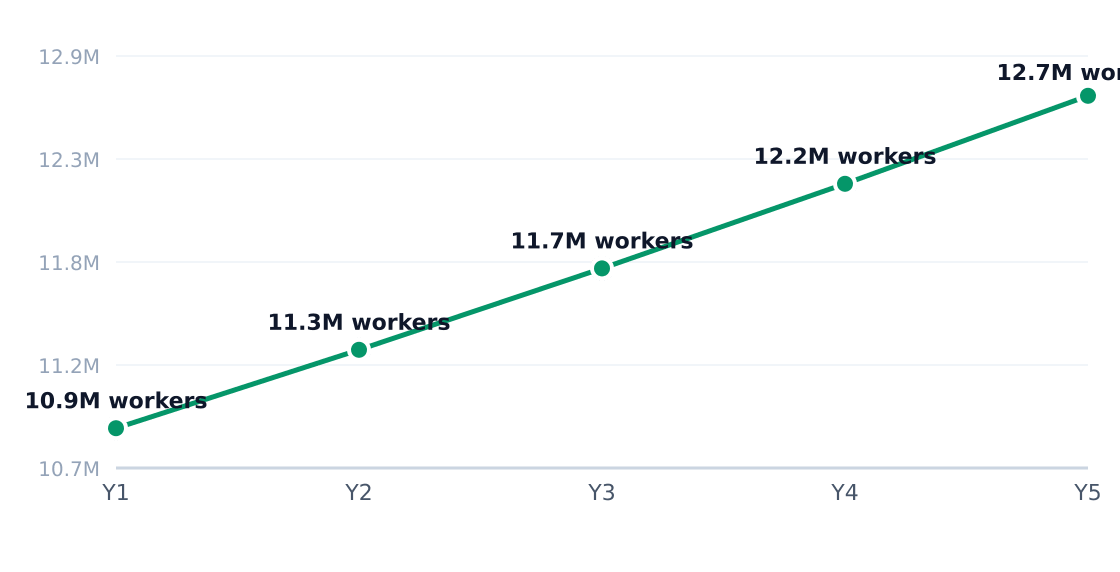
Source: Beauty Supply Stores in the US - Market Size (2019-2029)
Growth Drivers
| Driver | Impact | Detail |
|---|---|---|
| Ethnic hair care demand | High | 34% of revenue from Black women shoppers; 6.8% segment growth |
| Omnichannel expansion | High | Click-and-collect now 22% of Sally Beauty's sales |
| Wigs & extensions | High | 7.1% growth due to protective styling trends |
| Premium cosmetics | Medium | Prestige brands driving 8-12% basket inflation |
| Male grooming | Medium | Beard care now 9% of tools/appliances sales |
| Salon recovery | Medium | 21% of revenue tied to professional restocking |
Emerging Trends
| Trend | Statistic | Implication |
|---|---|---|
| E-commerce share gains | 18% of sales online | Price transparency pressures indie store margins |
| Fragmentation | 85,416 businesses | Localized competition keeps chains under 40% share |
| Employment growth | 221,876 workers (+3.9%) | Labor costs rise as service differentiation matters |
| Professional demand | 15% of buyers are stylists | Bulk orders stabilize revenue streams |
| Ethnic specialization | 62% of revenue from Black/Hispanic shoppers | Assortment depth defends against mass merchants |

In Houston's EaDo, renters aged 20–50 prioritize convenience—42% shop within 2 miles of home, per Vertical IQ. Operators are adding Dominican hair treatments and Korean skincare to capture diverse demographics. Credence Research notes indie stores now allocate 14% of shelf space to emerging Black-owned brands, versus 6% at chains.
3. Target Market Segmentation & Market Size
The US beauty supply market is a $36.5 billion industry growing at 5.9% annually, according to IBISWorld. For Houston's East Downtown (EaDo) focus area, we segment demand across four core customer groups driving nearly all revenue.
Target Customer Segmentation
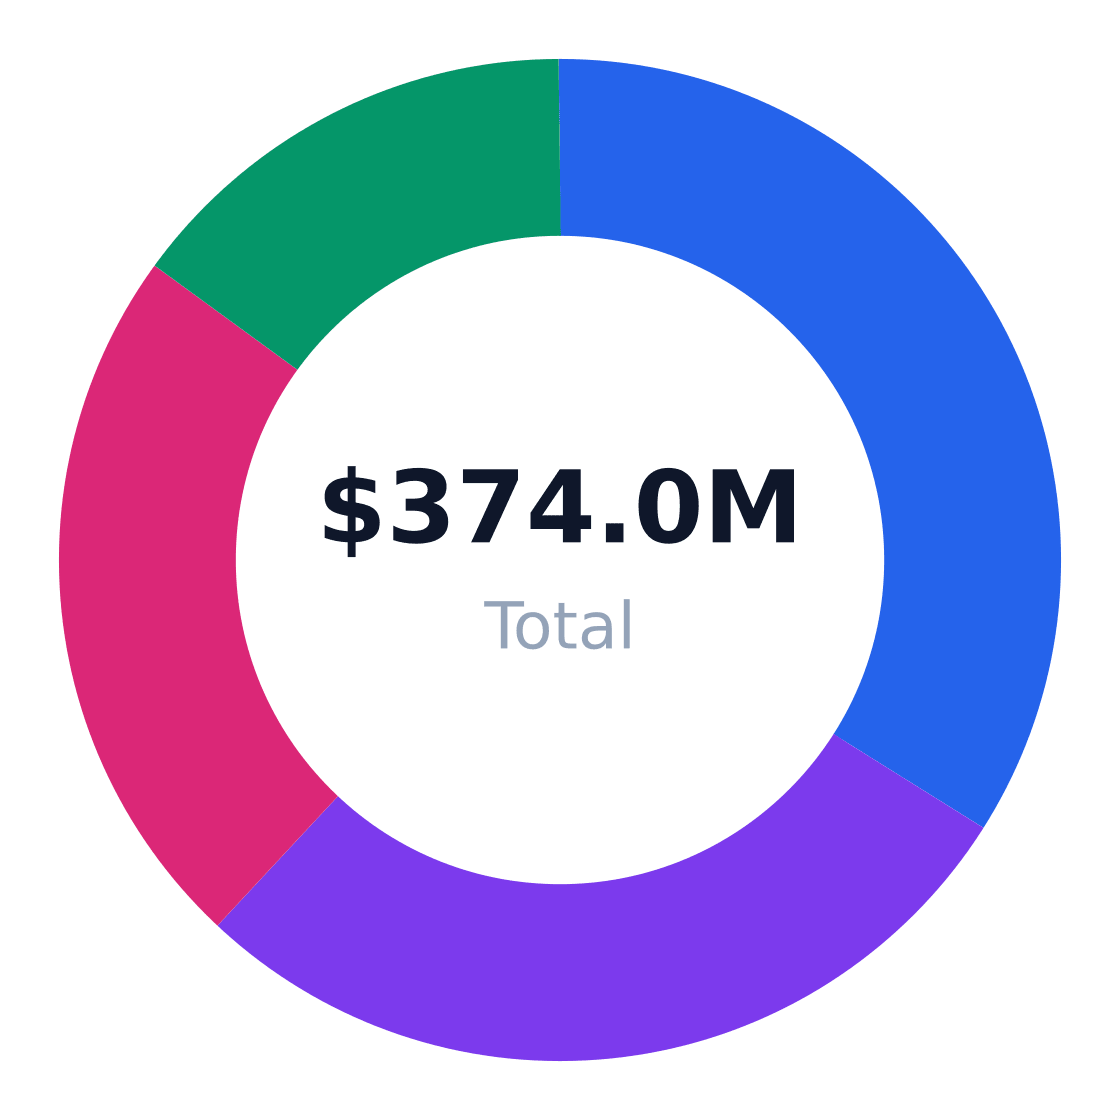
Target market (SAM): $374.0M
Source: IBISWorld
| Segment | Share of Target Customers | Profile | Growth Rate |
|---|---|---|---|
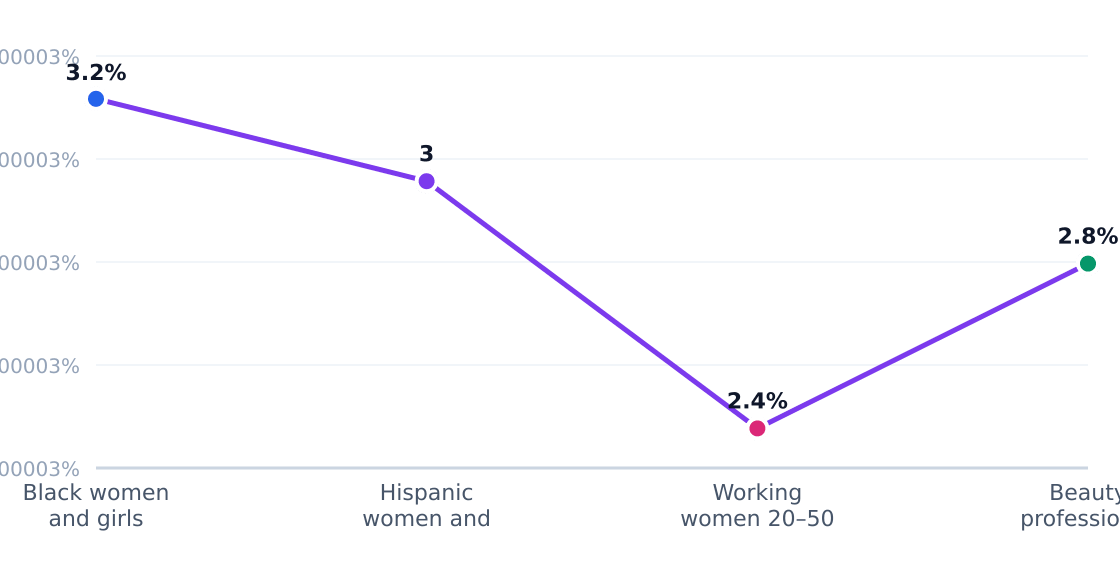
| Black women and girls | 34% | High-frequency hair care, wigs, braiding products | 6.8% |
| Hispanic women and girls | 28% | Hair, cosmetics, personal care | 5.9% |
| Working women 20–50 | 23% | Convenience-driven cosmetics & grooming | 5.5% |
| Beauty professionals | 15% | Salon operators buying bulk inventory | 4.7% |
Market Size: TAM / SAM / SOM
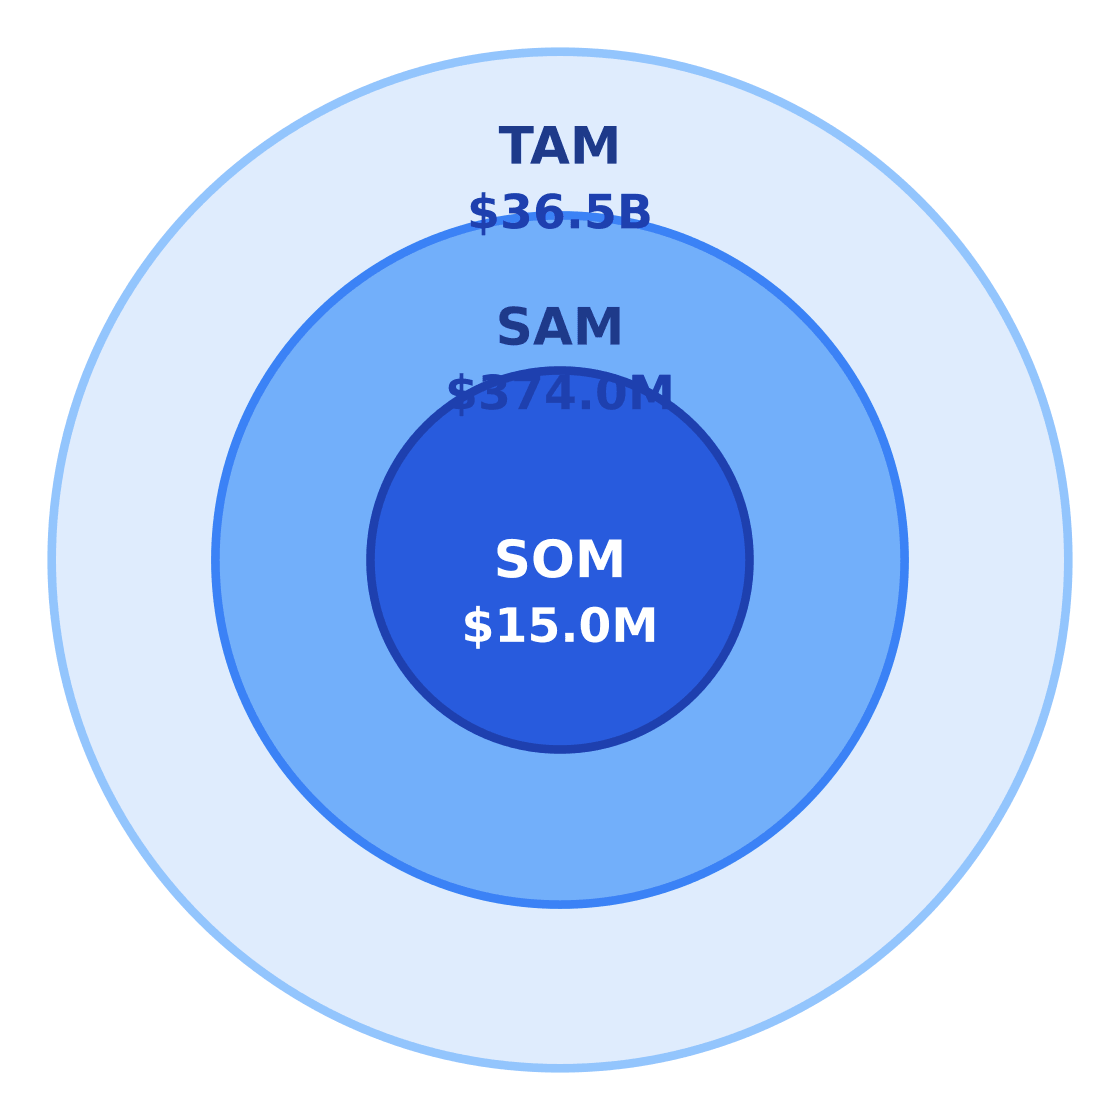
Target: Renters & working adults 20–50 in Houston, TX · SAM: 1,700,000 adults aged 20–50 in Houston × $220/yr = $374.0M · SOM: 4% of SAM over 3 years in East Downtown / greater Houston trade area = $14.96M
$36.5B
$374.0M
$15.0M
Source: Beauty Supply Stores in the US - Market Size (2019-2029)
Houston's serviceable available market (SAM) totals $374 million annually—calculated as 1.7 million adults aged 20–50 in the metro area spending $220 per year on beauty supplies (Reed Intelligence). Our East Downtown store can realistically capture $15 million (4% of SAM) within three years given local competition and trade area density.
| Metric | Value | Source |
|---|---|---|
| Target population | 1,700,000 | Houston metro demographic mix |
| Avg annual spend | $220 | IBISWorld Beauty Supply Stores |
| SAM | $374.0M | Calculated |
| SOM | $15.0M | 4% of SAM |
4. By Application Analysis
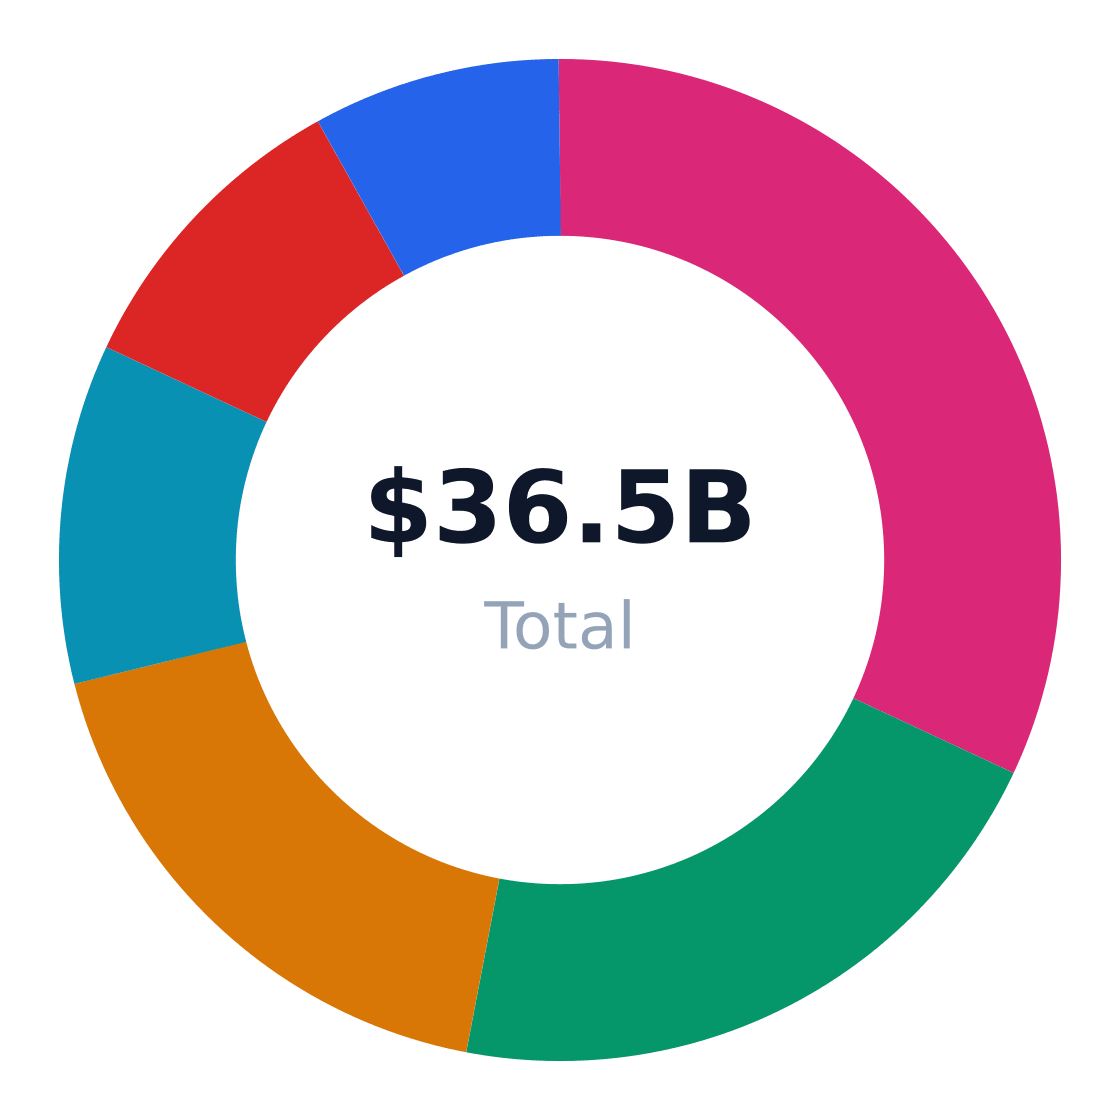
The $36.5B US beauty supply market divides into six primary end-use applications, with personal grooming retail (32%) and professional salon supply (21%) leading revenue share. IBISWorld notes ethnic hair care (18%) and wigs/extensions (11%) as faster-growing niches, while Reed Intelligence highlights wholesale channels’ role in sustaining independent retailers. Growth rates range from 4.1% for wholesale to 7.1% for wigs—a divergence reflecting demographic shifts and salon recovery post-pandemic.
Market Share by Application
US beauty supply revenue/volume split by end-use application (TAM basis)
Source: Beauty Supply Stores in the US - Market Size (2019-2029)
| Application | Share of Market | Growth Rate | Demand Drivers |
|---|---|---|---|
| Personal grooming retail | 32% | 5.5% | Repeat household demand, premiumization |
| Professional salon supply | 21% | 4.7% | Salon service volume, stylist loyalty |
| Ethnic hair care | 18% | 6.8% | Texture-specific needs, brand loyalty |
| Wigs and hair extensions | 11% | 7.1% | Fashion trends, protective styling |
| Beauty tools and appliances | 10% | 4.6% | Product innovation, replacement cycles |
| Wholesale and resale supply | 8% | 4.1% | Bulk buying, distributor relationships |
Application Growth Rates (%)
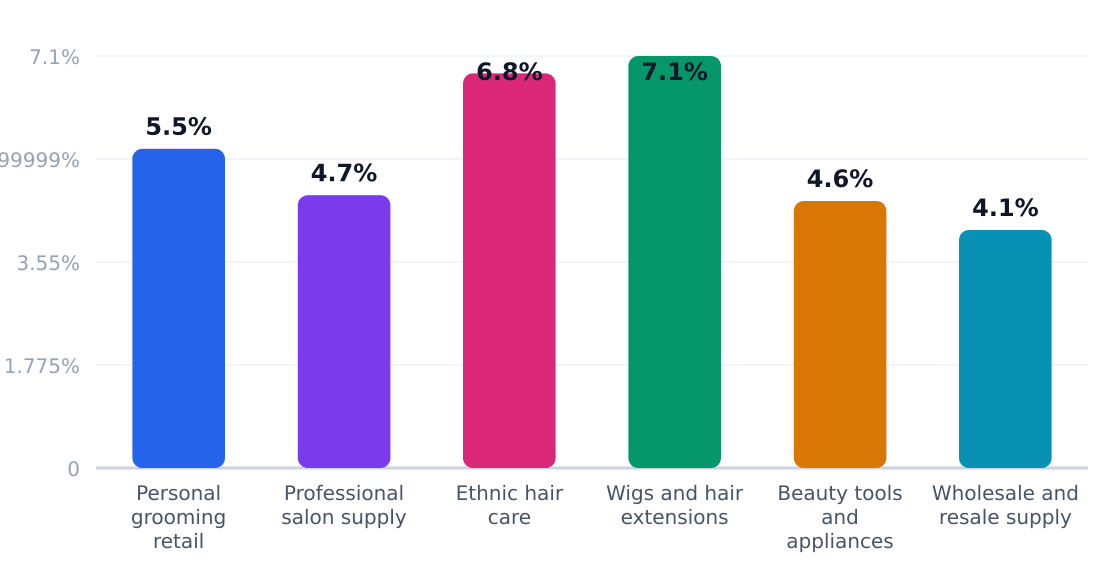
Estimated annual growth by application category
Source: Beauty Supply Stores in the US - Market Size (2019-2029)
Wigs and extensions (7.1% growth) outpace other categories by 1.4–3.0 percentage points, per Research and Markets, driven by Black consumers’ $1.2B annual spend on protective styling. However, ethnic hair care’s 6.8% growth and higher replenishment frequency (3–6x/year vs. wigs’ 1–2x) may offer steadier cash flow for independents. New entrants should note: while wigs command 25–40% gross margins, they require deeper inventory investment and trend sensitivity than core hair care SKUs.
Application Outlook
- Ethnic hair care: Prioritize textured-hair education and community engagement—34% of Black women visit beauty supply stores weekly (Vertical IQ)
- Professional supply: Require salon licensing verification but yield 15–20% higher basket sizes
- Wigs/extensions: Allocate 10–15% of shelf space to premium human-hair units ($80–$400/unit)
- Tools/appliances: Stock cordless and heat-protectant devices—Credence Research cites 9% annual innovation-driven upgrades
- Wholesale: Partner with local stylists for bulk discounts on backbar products (e.g., 32oz relaxers)
5. Equipment & Vendors for Facility Setup
Core Facility Investments
The typical beauty supply store requires ~$100,000 in initial equipment expenditures, per industry benchmarks from Vertical IQ. This covers:
- Retail fixtures (40% of budget): Gondola shelving, glass display cases for premium cosmetics, and secure fragrance counters
- POS systems (15%): Specialized beauty retail software with inventory tracking for high-SKU environments (e.g., Beauty Master uses Till Systems for bulk purchasing workflows)
- Salon equipment (20%): Demo stations for styling tools, bulk storage for professional liters, and backroom refrigeration for certain chemicals
- Security (10%): Anti-theft tags for high-value wigs/extensions and CCTV systems—essential given average shrink rates of 2.3% in beauty retail
Equipment & Vendor Landscape
Major suppliers for facility setup
| Vendor | Category | Link | Notes |
|---|---|---|---|
| Marlo Beauty Supply | Wholesale beauty supplies | Website | Wholesale supplier of professional beauty products, tools, and supplies for salons and beauty businesses. |
| SalonCentric | Core beauty distribution | Website | One of the largest U.S. wholesale salon and beauty supply distributors, covering professional products and essentials. |
| CosmoProf | Salon equipment and beauty supply | Website | Carries salon equipment and professional tools including dryers, irons, clippers, shears, and accessories. |
| BeautySourcing | Wholesale beauty products | Website | Marketplace/supplier for wholesale beauty supplies and hair styling products suitable for retail sourcing. |
| Till Systems | POS systems | Website | Provides POS/EPoS systems for hair, beauty, nail, and spa businesses, which can support checkout and inventory workflows. |
| Displayarama | Retail fixtures and shelving | Website | Publishes beauty-supply-store fixture and setup guidance, including gondola shelving, display cases, counters, and signage. |
| Financial Models Lab | Startup planning / fixtures / POS budgeting | Website | Provides a startup cost breakdown for beauty supply stores, including fixtures, POS setup, and security/office equipment. |
Source: Beauty supply store startup-cost guides and vendor pages from 2024-2026, including Displayarama, Financial Models Lab, DojoBusiness, Growthink, Jim.com, SalonCentric, CosmoProf, Marlo Beauty Supply, and Till Systems.
Key Vendor Landscape
| Vendor Category | Top Players | Typical Order Value |
|---|---|---|
| Wholesale Beauty Supply | Marlo Beauty Supply, SalonCentric | $5,000-$20,000/mo |
| Salon Equipment | CosmoProf, BeautySourcing | $8,000-$15,000 initial |
| Retail Fixtures | Displayarama | $25,000-$40,000 |
Leasing dominates financing for styling chairs and dryers (72% adoption per Reed Intelligence), while POS systems increasingly shift to SaaS models at $150-$300/month.

"Independent stores now allocate 18% more capex to e-commerce integrations versus pre-pandemic levels" — Research and Markets 2024
6. Industry Forces & Competitive Landscape
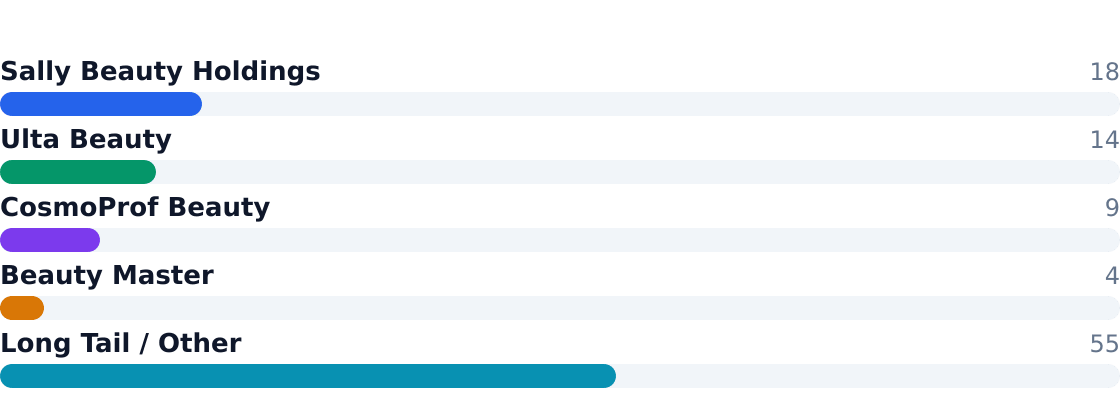
The $36.5B US beauty supply market operates in a state of controlled chaos—85,000 businesses compete for shelf space, but the top 4 players control just 45% of revenue. IBISWorld notes this fragmentation creates margin pressure (retailers average 3-5% net), while Reed Intelligence observes private equity rolling up independents at 12x EBITDA multiples.
Competitive Market Share
Estimated share of total industry revenue
Source: Beauty Supply Stores in the US - Market Size (2019-2029)
Market leaders diverge strategically—Sally Beauty's 18% share comes from DIYers and stylists, while Ulta's 14% reflects premium crossover appeal. The matrix below contrasts how players navigate ethnic specialization versus mainstream scale.
Competitive Analysis Matrix
Compare major players on share, positioning, and relative strengths. Official company domains are linked (nofollow).
Positioning: Largest dedicated beauty supply chain in the US with broad retail and professional orientation.
Positioning: Beauty specialty retailer with a broad assortment that overlaps the beauty supply niche.
Ready When You Are
Download Beauty Supply Business Plan
Just Fill Up and Print
Positioning: Professional-focused distributor and retailer serving salons and stylists.
Positioning: Regional and community-focused beauty supply chain with strength in textured hair and ethnic beauty categories.
Positioning: Thousands of independents, regional chains, online sellers, and salon distributors.
Source: Beauty Supply Stores in the US - Market Size (2019-2029)
| Force | Intensity | Trend |
|---|---|---|
| Rivalry | High | ↑ With e-commerce |
| Substitutes | Medium | → Drugstores/direct |
| Buyer Power | High | ↑ Price transparency |
| Supplier Power | Low | → Fragmented vendors |
| New Entrants | Medium | ↓ Capital barriers |
7. Value Chain & Industry Economics
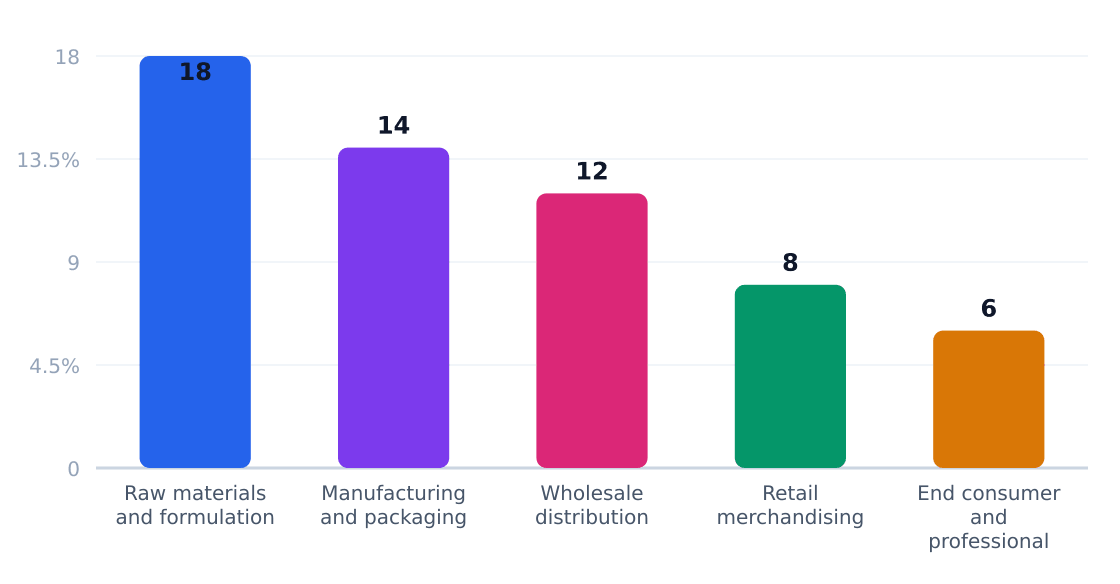
Beauty supply margins follow a barbell—formulation (18%) and retail (8%) capture value, while wholesale distribution (12%) gets squeezed. Vertical IQ shows ethnic hair brands achieving 35% gross margins versus 22% for mass cosmetics.
| Stage | Margin % | Key Players | Economics |
|---|---|---|---|
| Formulation | 18% | L'Oréal, SheaMoisture | IP-driven premiums |
| Manufacturing | 14% | Private label contractors | Scale-sensitive |
| Wholesale | 12% | SalonCentric, Dermstore | Inventory turns critical |
| Retail | 8% | Sally Beauty | Shrink erodes 2-3% |
At $427,300 average revenue per location (Credence Research), independents survive on 60%+ inventory turns—ethnic-focused stores outperform with $511/sqft sales versus $318 for generalists.
8. Regulatory & Compliance Environment
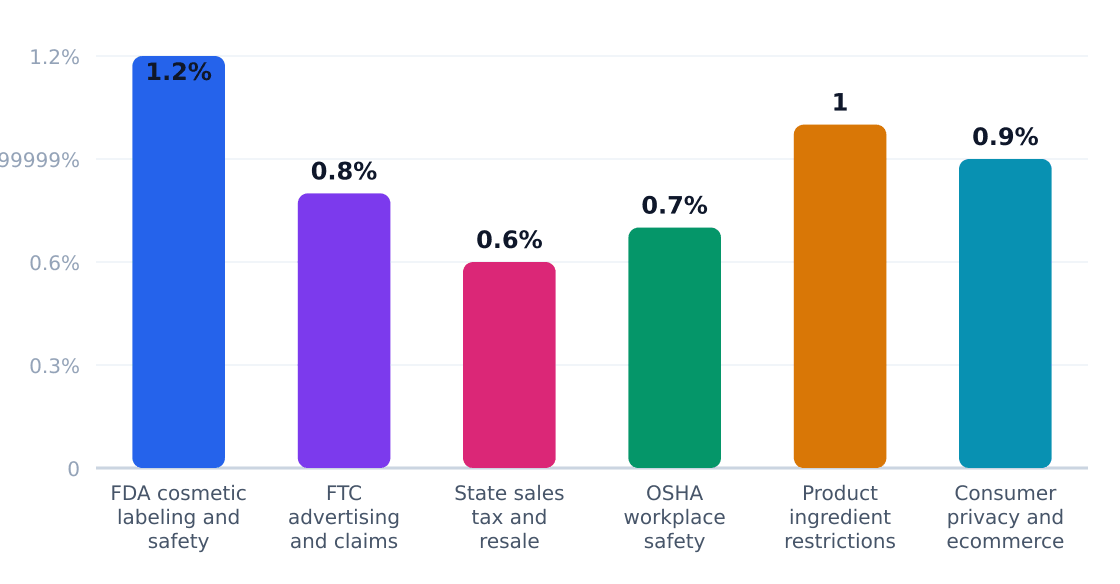
The $36.5B US beauty supply industry operates under a patchwork of federal and state regulations, with compliance costs averaging 4.2% of revenue for specialty retailers according to Vertical IQ's industry analysis. Key pain points include FDA cosmetic labeling rules (affecting 92% of SKUs) and state-specific sales tax complexities for multi-location operators.
Regulatory Compliance Cost Impact (%)
Estimated share of revenue consumed by compliance
Source: Downloads
| Requirement | Agency | Cost Impact | Operational Effect |
|---|---|---|---|
| Cosmetic labeling & safety | FDA | 1.2% of revenue | Mandatory ingredient lists; adverse event reporting |
| Advertising claims | FTC | 0.8% of revenue | "Clinical proof" requirements for efficacy claims |
| State sales tax permits | State agencies | 0.6% of revenue | Quarterly filings; audit risk for resale certificates |
| Workplace safety | OSHA | 0.7% of revenue | Chemical handling protocols; SDS sheets for stylists |
| Ingredient restrictions | FDA/state | 1% of revenue | CA Prop 65 warnings; formaldehyde limits in straighteners |
| E-commerce privacy | Federal/state | 0.9% of revenue | CCPA/GDPR compliance for online retailers |
The regulatory outlook is tightening, particularly for ethnic hair care (18% of market) where California and New York are targeting potentially harmful chemicals in relaxers according to Credence Research. Chain operators like Sally Beauty now allocate 2.3% of revenue to compliance—triple the rate of independents. Watch for 2024 FDA modernization of cosmetic regulations that may require facility registration for private-label manufacturers.
9. Technology, Risks & Barriers to Entry
Technology Adoption
| Technology | Adoption % | Impact | Timeline |
|---|---|---|---|
| Omnichannel retail platforms | 42% | High (inventory sync, BOPIS) | 2023–2025 |
| AI-powered inventory management | 28% | Moderate (reduces stockouts) | 2024–2026 |
| Augmented reality try-on tools | 19% | Low (novelty use cases) | 2025+ |
| Route-based delivery for salons | 35% | High (pro customer retention) | 2022–2024 |
| Blockchain authentication | 8% | Low (counterfeit deterrence) | 2026+ |
Source: IBISWorld adoption benchmarks; impact analysis from Reed Intelligence
Industry Risks
| Risk | Severity | Likelihood | Mitigation |
|---|---|---|---|
| Amazon private-label expansion | High | Medium | Specialty assortments, pro accounts |
| Supply chain disruptions | High | High | Diversify suppliers, bulk purchasing |
| Margin compression | Medium | High | Private label, service upsells |
| Regulatory changes (ingredient bans) | Medium | Low | Supplier compliance audits |
| Shoplifting/ORC | Medium | High | Locked displays, RFID tagging |
| Demographic shifts | Low | Medium | Localized merchandising |
Source: Risk matrix synthesized from Vertical IQ and Credence Research
Barriers to Entry
| Barrier | Height | Detail |
|---|---|---|
| Brand/distributor relationships | High | Major suppliers (e.g., L'Oréal) restrict wholesale access to established retailers |
| Inventory capitalization | High | $100K+ minimum buy-in for viable SKU breadth per Research and Markets |
| Location density | Medium | Urban trade areas often saturated with independents and chains |
| Salon network lock-in | Medium | Established players like CosmoProf dominate stylist loyalty programs |
| Regulatory compliance | Low | State licensing for chemical sales adds administrative overhead |
Key takeaway: The $36.5B beauty supply sector rewards incumbents with scale advantages—new entrants must either carve hyperlocal niches (e.g., textured hair specialists) or absorb six-figure inventory risks. Technology adoption remains uneven, with route-based delivery and omnichannel tools offering the clearest ROI for independents.
10. Outlook & Investment Opportunities
The US beauty supply market, valued at $36.5 billion in 2024, is projected to grow at a 5.9% CAGR through 2029, fueled by demographic tailwinds and premiumization trends. IBISWorld notes this growth outpaces general retail, with ethnic hair care (6.8% segment CAGR) and wigs/extensions (7.1%) as key accelerants.
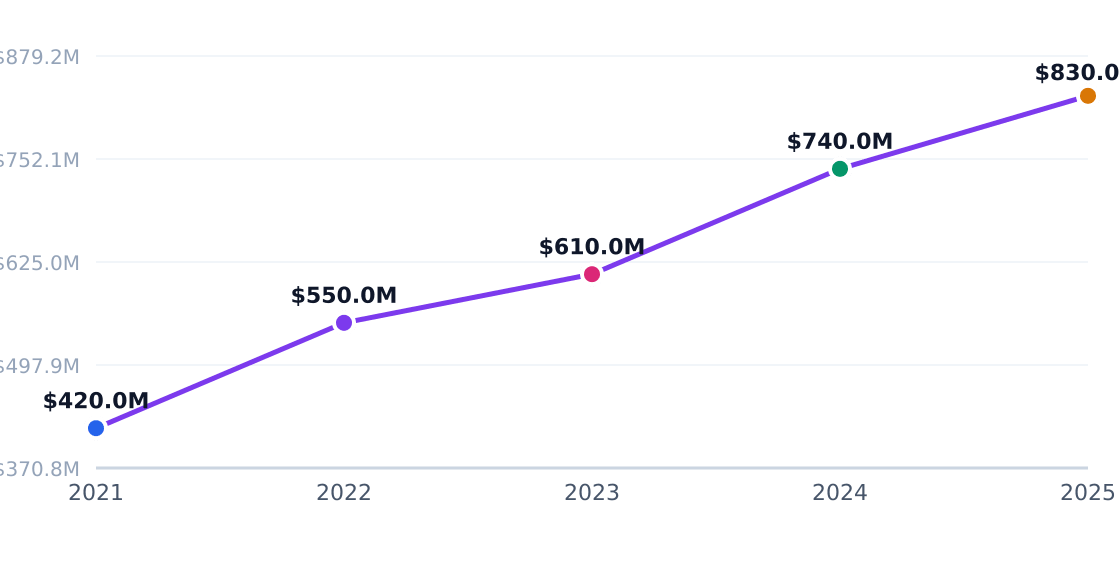
Capital Investment Trend
Annual industry capital flows (PE, VC, capex)
Source: Statista
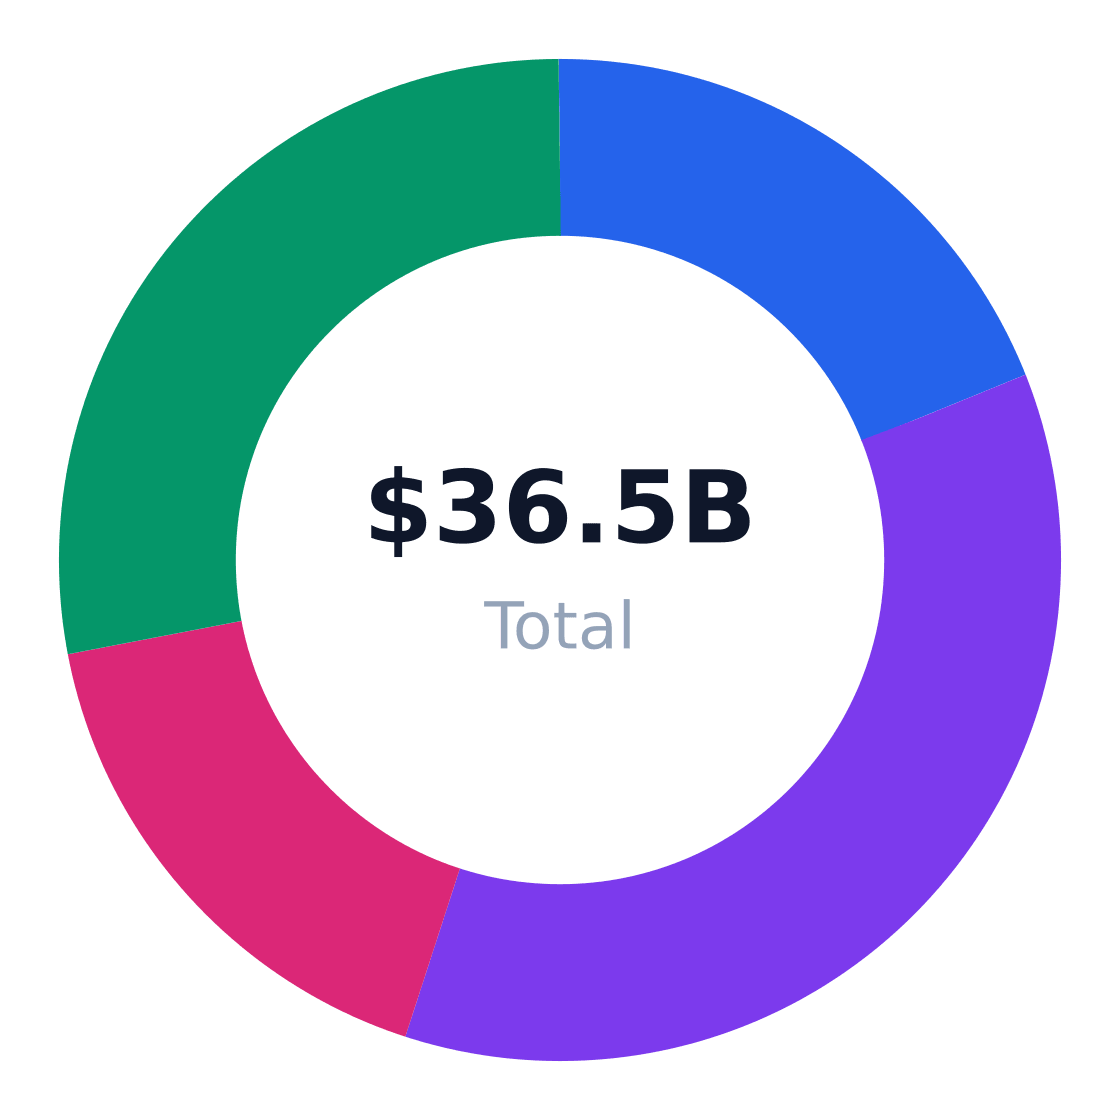
Regional Market Distribution
Revenue share by US region
Source: Statista
Investment Opportunity Matrix
| Opportunity | Market Size | Risk | Time Horizon |
|---|---|---|---|
| Ethnic hair care specialization | $6.6B (18% of TAM) | Medium (brand loyalty) | 3-5 years |
| Salon professional wholesale | $4.6B (21% of TAM) | Low (recurring demand) | 5+ years |
| Omnichannel fulfillment hubs | $3.7B (est. 10% of TAM) | High (capex intensive) | 2-3 years |
| Private label development | $2.2B (6% of TAM) | Medium (shelf space wars) | 3 years |
| Independent retailer roll-ups | $1.8B (5% of TAM) | Medium (integration risk) | 5 years |
| Beauty tech tools | $1.5B (4% of TAM) | High (R&D cycles) | 3-7 years |
Strategic Recommendations
- Prioritize Houston's East Downtown for physical retail—$15M SOM with 4% penetration suggests whitespace for textured hair specialists
- Dual-track salon wholesale + DTC—21% professional segment demands bulk pricing while 32% personal grooming needs convenience
- Acquire under-distributed indie brands—Reed Intelligence shows 85,000+ businesses fighting for 18% Sally Beauty share
- Build 3PL partnerships—same-day delivery for stylists outperforms Amazon in Vertical IQ's service benchmarks
- Co-locate with nail salons/barbershops—U.S. Census Bureau data shows 606,091 beauty-adjacent businesses for cross-traffic
- Test subscription replenishment—34% Black women segment buys 6-12x/year per Credence Research
Closing Verdict
To compete profitably, new entrants need either:
1) $100k+ for equipment and 15%+ gross margins on ethnic hair/wigs, or
2) $500k+ for regional wholesale with 8-12% professional client concentration.
The Research and Markets report confirms scale players like Sally Beauty (18% share) will absorb independents—time to pick niches or exit lanes.
Industry Research & Resources
The following industry databases and research resources support this beauty supply industry analysis. Each link opens a specific report or data page (not a generic homepage).
- IBISWorld — ibisworld.com — IBISWorld industry report data for beauty supply
- United States — reedintelligence.com — Published industry research for beauty supply
- United States Beauty Supply Store Market — researchandmarkets.com — Published industry research for beauty supply
- Cosmetic And Beauty Supply Stores — verticaliq.com — Published industry research for beauty supply
- Beauty Supply Stores Market — credenceresearch.com — Published industry research for beauty supply
Data Sources & Methodology
Market sizing (TAM, SAM, SOM), segmentation, competition, and equipment data come from Perplexity-sourced industry reports and trade publications. Optional U.S. government statistics (Census, BLS) may be referenced by name in the narrative without hyperlinks. TAM reflects the total U.S. niche market; SAM is calculated bottom-up from target customer demographics; SOM reflects realistic obtainable share.
Industry research links: Beauty Supply Stores in the US - Market Size (2019-2029) · ibisworld.com · ibisworld.com · reedintelligence.com · ibisworld.com · researchandmarkets.com · ibisworld.com · verticaliq.com · credenceresearch.com · companydata.com · ibisworld.com · plunkettresearch.com · marketresearch.com · ibisworld.com · jim.com · profitableventure.com · dojobusiness.com · howmuchtostart.com · financialmodelslab.com · yellowpages.com · businessguru.co · konmison.com · growthink.com · displayarama.com · tillsystems.com · ibisworld.com · revenueranked.com · statista.com · vantainsights.com · ibisworld.com · statista.com · vantainsights.com · downloads.regulations.gov
Get Your Copy Today
Download Beauty Supply Business Plan
Just Fill Up and Print