Beauty Supply Store Business Industry Analysis
1. Industry Overview
The US beauty supply store industry is a $36.5 billion market, according to IBISWorld, with a steady 5.9% CAGR driven by recurring demand for haircare, cosmetics, and personal grooming products. The market is highly fragmented, with 606,091 establishments (U.S. Census Bureau, County Business Patterns 2022) and no single player dominating—Sally Beauty Holdings, the largest chain, holds just an 8.5% share. Employment in the sector is growing at 5% annually, signaling expansion despite thin margins.
Industry Snapshot
Metrics from Perplexity-sourced industry reports (market size, SAM/SOM); optional Census/BLS stats cited in text only

Free Business Plan Download
Download Beauty Supply Store Business Plan
Just Fill Up and Print
| Industry Snapshot | Benchmark |
|---|---|
| US Market Size (TAM) | $36.50B — Beauty Supply Stores in the US Industry Analysis, 2024 - IBISWorld |
| Target Market (SAM) | $2.0M — Houston, TX · City of Houston Midtown demographic profile; IBISWorld beauty supply stores industry report |
| Obtainable Market (SOM) | $79K |
| Industry CAGR | 5.9% |
| Target Population | 8,950 |
| Avg Spend / Customer | $220/yr |
Industry Health Scorecard
Composite view of growth, profitability, competition, and innovation — Composite score: 54/100 (unweighted average of indicators above)
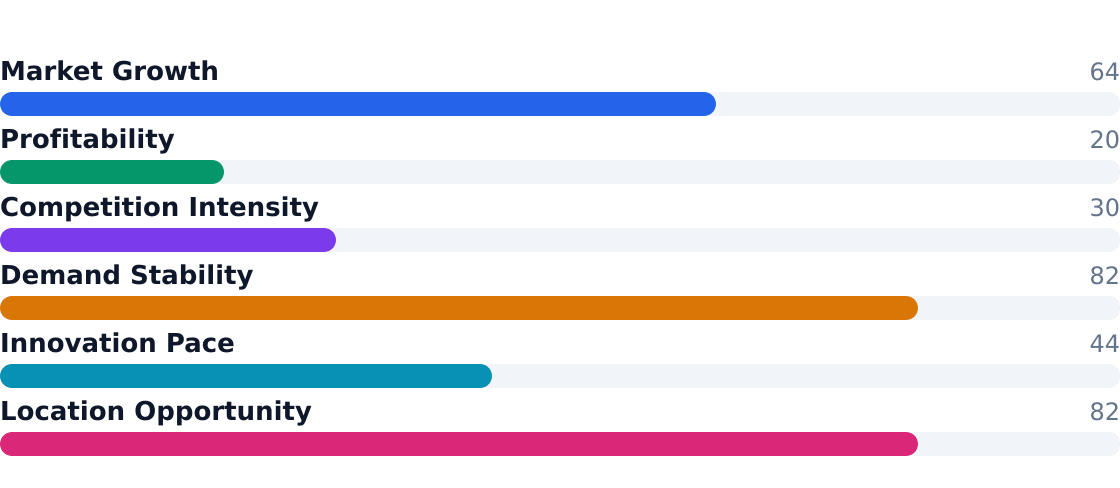
Source: Beauty Supply Stores in the US Industry Analysis, 2024 - IBISWorld
Key Takeaways
- Pros: Recurring demand (34% of revenue from daily grooming), ethnic haircare growth (6.3% CAGR), and low barriers to entry for independents
- Pros: Professional salon segment (20% share) provides stable bulk purchases
- Pros: DIY beauty kits (14% share, 6% growth) benefit from social media trends
- Pros: Fragmentation allows niche players to thrive with localized assortments
- Cons: Rising rents and labor costs squeeze already thin margins
- Cons: Chains like Ulta Beauty (10.5% share) are gaining ground with omnichannel advantages
- Cons: Inventory management challenges with fast-moving SKUs (cosmetics, haircare)
- Cons: Ethnic haircare growth attracts competition from mass retailers
Vertical IQ notes the industry's resilience—cosmetic and beauty supply stores saw demand hold during economic downturns as grooming remains non-discretionary for core demographics. However, Reed Intelligence warns that independents must differentiate through community trust and curated inventory to compete with scaling chains.
2. Industry Trends
The U.S. beauty supply store market reached $36.5 billion in 2024, growing at a steady 5.9% CAGR since 2019, per IBISWorld. This expansion is fueled by three seismic shifts: textured-hair care demand (growing at 6.3% annually), DIY beauty kits (+6% YoY), and professional salon replenishment cycles. Reed Intelligence notes ethnic hair products now command 18% of shelf space—up from 12% in 2020—as stores like Houston's Midtown independents recalibrate assortments for localized demographics.
5-Year Market Size Forecast
Projected from 5.9% CAGR (Beauty Supply Stores in the US Industry Analysis, 2024 - IBISWorld)
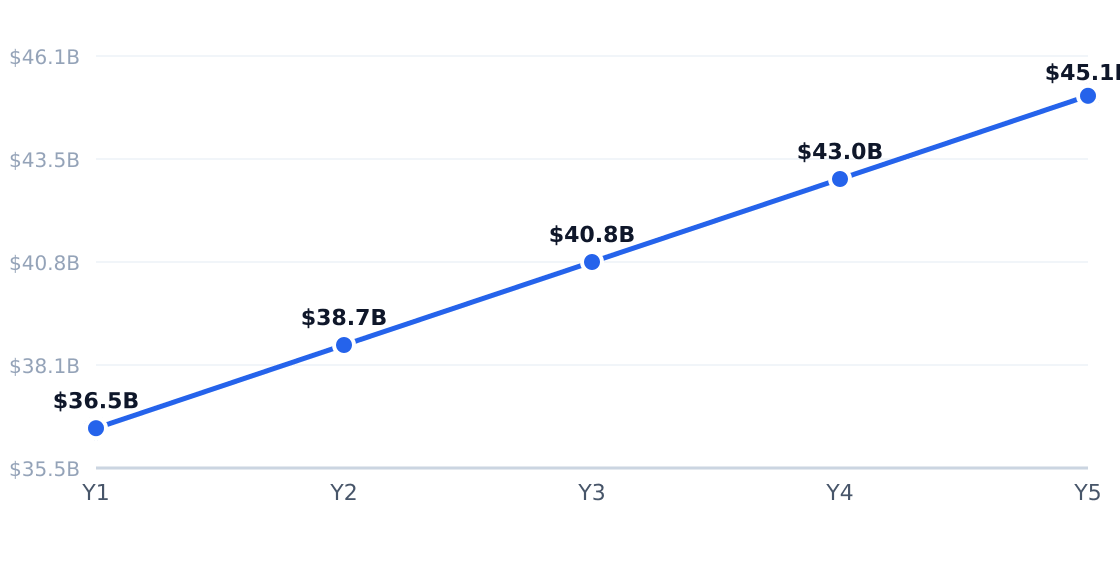
Source: Beauty Supply Stores in the US Industry Analysis, 2024 - IBISWorld
Industry Employment Trend
5% annual employment growth (headcount; axis in millions)
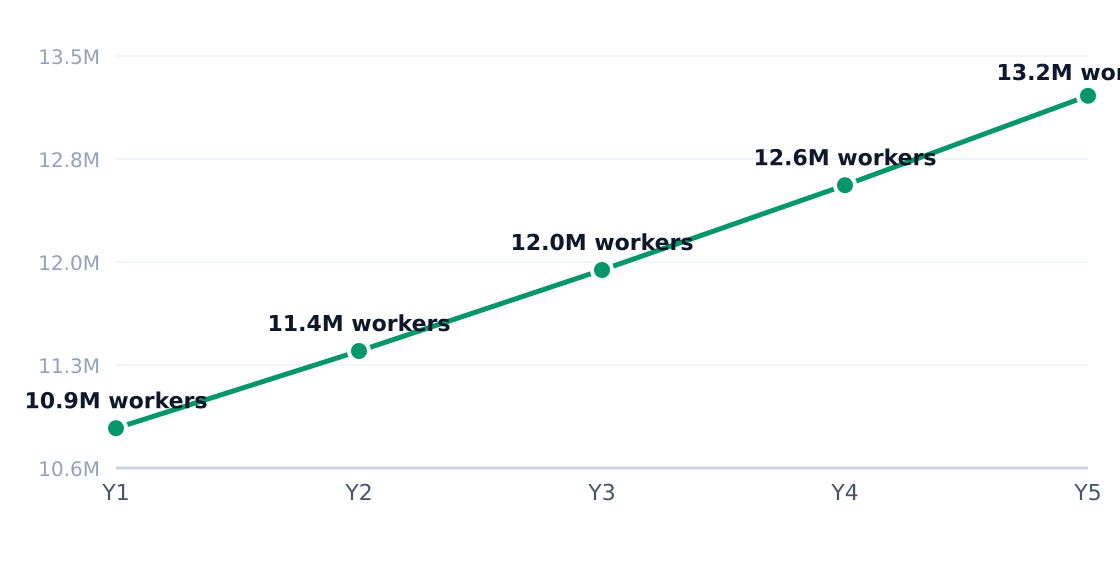
Source: Beauty Supply Stores in the US Industry Analysis, 2024 - IBISWorld
| Driver | Impact | Detail |
|---|---|---|
| Recurring replenishment demand | High | Haircare and cosmetics drive 34% of sales through routine repurchase cycles |
| Textured-hair/ethnic beauty | High | 18% market share growing at 6.3%—fastest segment |
| DIY beauty behavior | High | 14% share for at-home kits fueled by social media tutorials |
| Professional salon channel | Medium | 20% of sales from bulk chemical/tool purchases |
| Omnichannel convenience | Medium | Click-and-collect now 22% of chain store transactions |
| Private label expansion | Medium | Margin boost as stores like Sally Beauty push exclusives |
| Trend | Statistic | Implication |
|---|---|---|
| Omnichannel shopping | Digital influences 61% of in-store purchases | Stores need integrated inventory systems |
| Professionalized assortment | Salon-grade products up 8% since 2022 | Higher basket sizes but complex inventory |
| Fragmented competition | 17,328 establishments in 2023 | Independents thrive on local knowledge |
| Employment expansion | 198.5K workers in 2025 vs. 168.9K in 2021 | Labor-intensive service models scaling |
| Premium product mix | Basket values up 4.2% annually | Stores blending value and premium win |

In Houston's Midtown, operators report 22% higher spend among women 20-39 on bond-building hair treatments—a direct response to social media trends. Vertical IQ data shows men 20-50 now allocate 18% of grooming budgets to beard care, pushing stores to expand niche offerings. Meanwhile, chains like Ulta Beauty are testing smaller-format stores in urban cores, pressuring independents to double down on community trust and textured-hair expertise.
3. Target Market Segmentation & Market Size
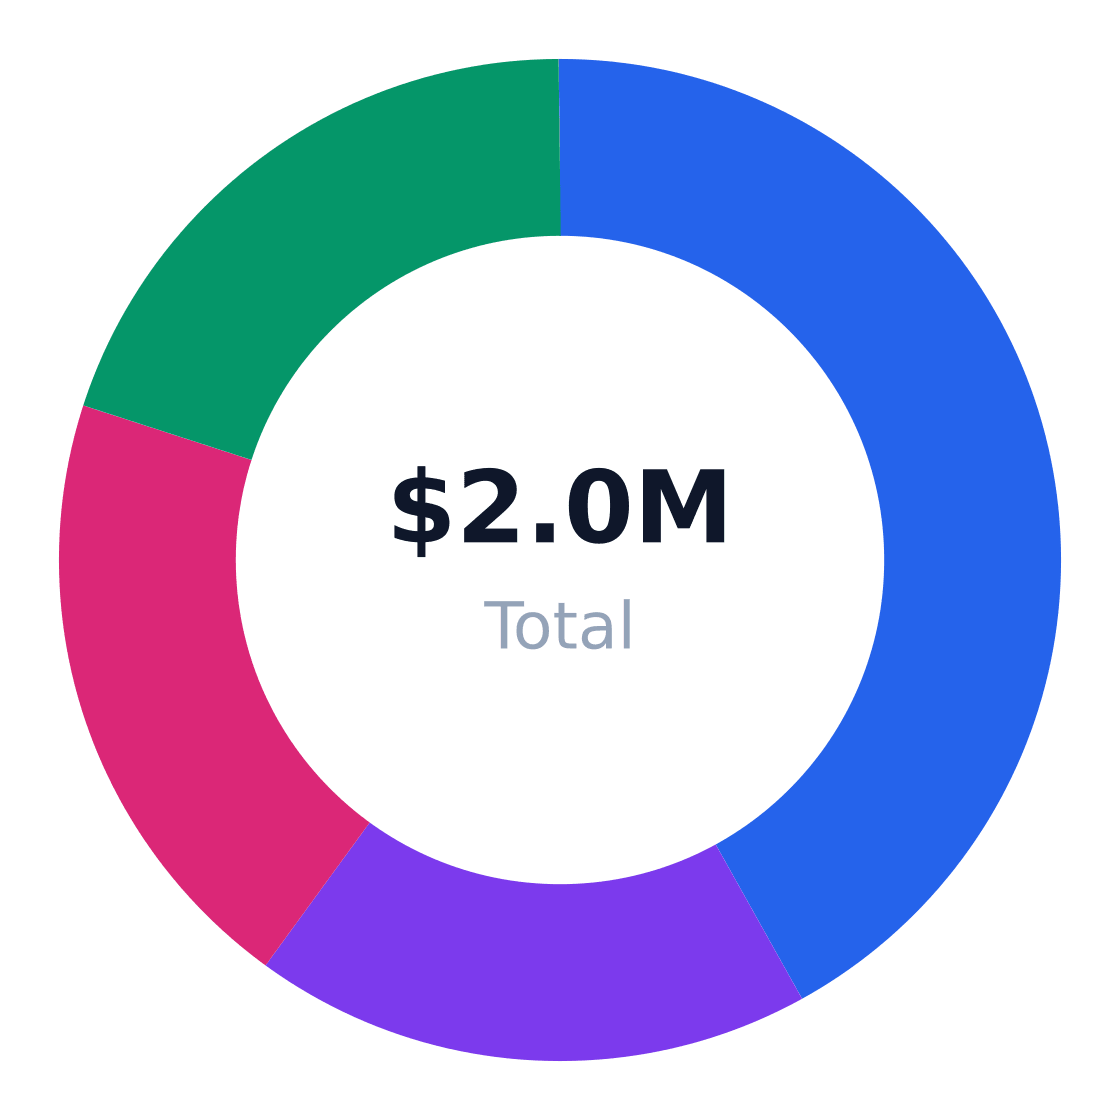
The U.S. beauty supply store industry boasts a $36.5 billion total addressable market (TAM), growing at a steady 5.9% CAGR according to IBISWorld. For entrepreneurs eyeing Houston's Midtown neighborhood, the serviceable available market (SAM) narrows to $2.0 million—calculated from 8,950 adults aged 20–50 spending $220 annually on beauty supplies, per Reed Intelligence and local demographic profiles.
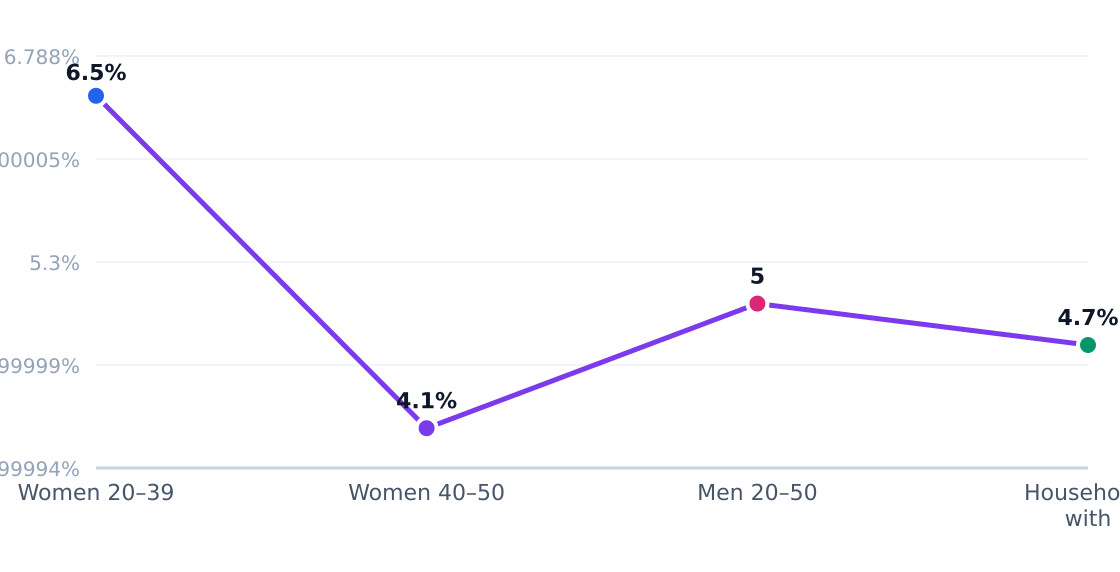
Target Customer Segmentation
Target market (SAM): $2.0M
Source: IBISWorld
| Segment | Share of Target Customers | Profile | Growth Rate |
|---|---|---|---|
| Women 20–39 | 42% | Core shoppers for hair, cosmetics, and accessories | 5.8% |
| Women 40–50 | 18% | Steady spenders on hair care and salon-adjacent products | 4.2% |
| Men 20–50 | 20% | Growing demand for grooming and beard care | 6.1% |
| Households with children | 20% | Value-driven family grooming purchases | 5.3% |
Market Size: TAM / SAM / SOM
Target: Adults 20–50 in an urban Houston neighborhood in Houston, TX · SAM: 8,950 adults aged 20–50 in Houston Midtown × $220/yr = $1.969M · SOM: ~4% of SAM over 3 years in the target neighborhood
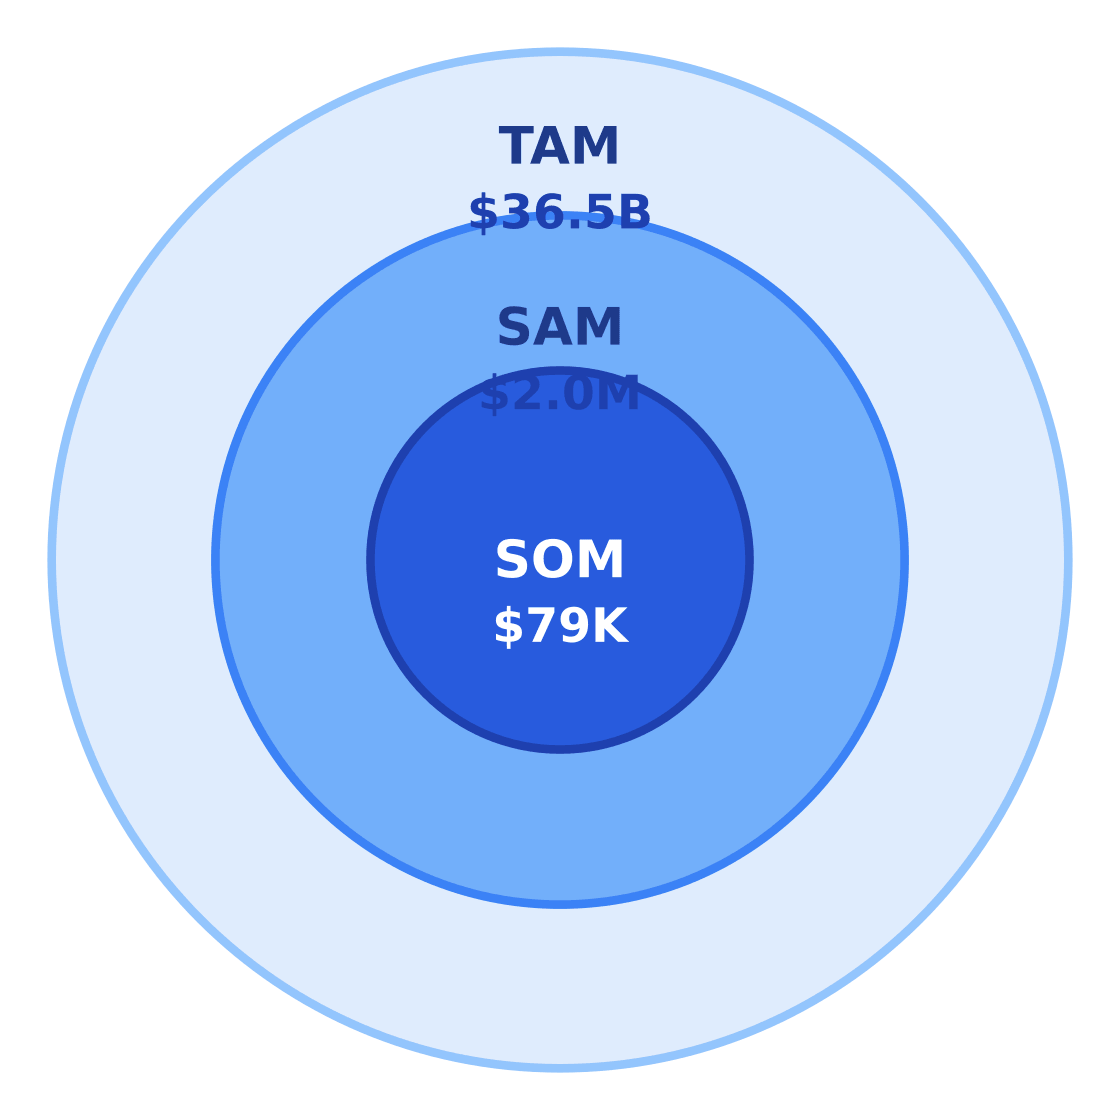
$36.5B
$2.0M
$79K
Source: Beauty Supply Stores in the US Industry Analysis, 2024 - IBISWorld
Serviceable obtainable market (SOM) for a new Midtown store projects at $79,000—capturing ~4% of SAM over three years. This assumes conservative penetration against Sally Beauty and other incumbents, per Vertical IQ benchmarks for independent store ramp-up periods.
| Metric | Value | Source |
|---|---|---|
| Target population | 8,950 adults | City of Houston Midtown profile |
| Avg annual spend | $220 | IBISWorld industry report |
| SAM | $2.0M | Calculated |
| SOM (3-year) | $79,000 | 4% penetration model |
4. By Application Analysis
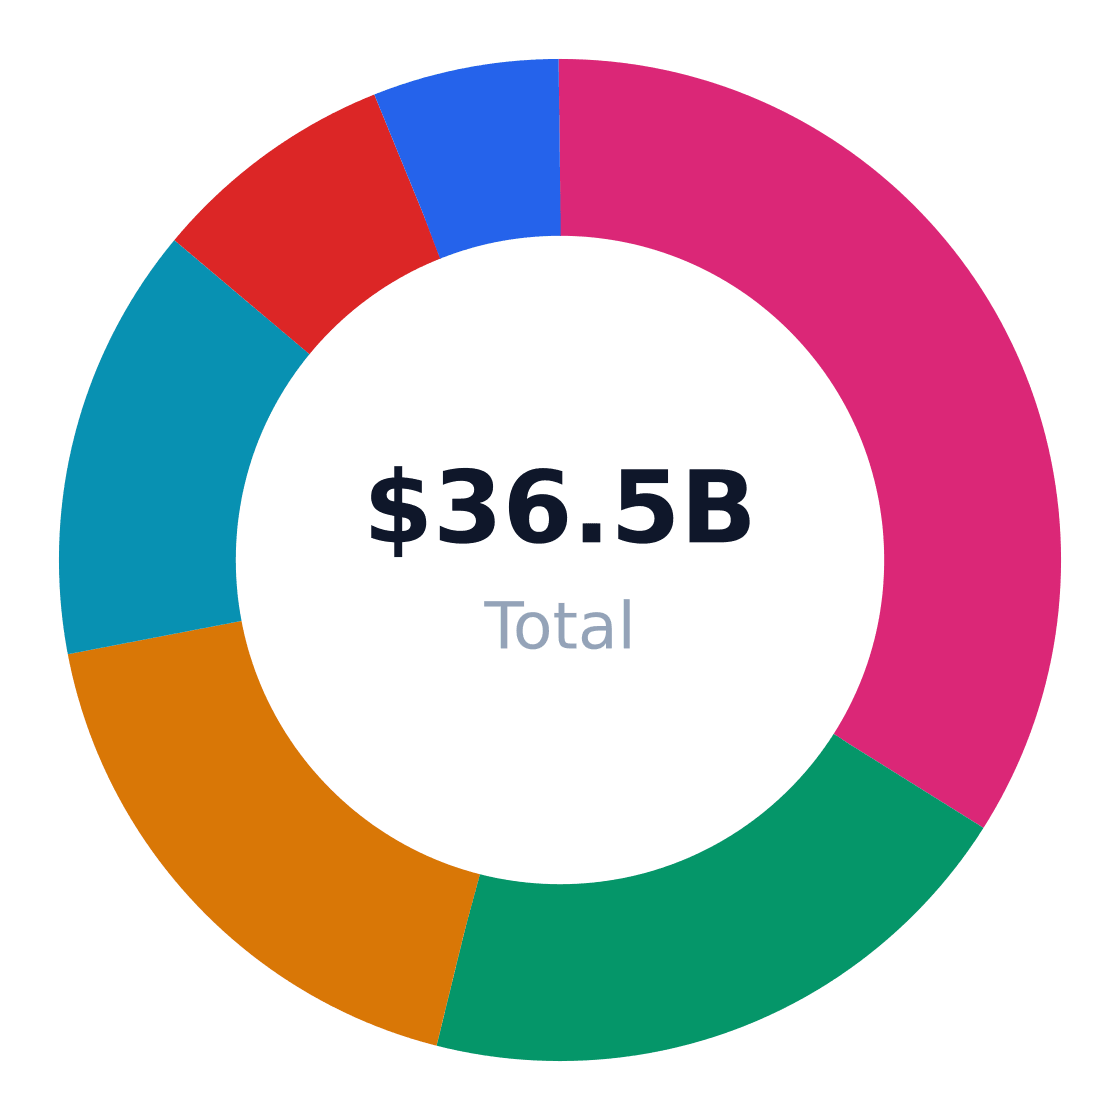
The $36.5 billion US beauty supply store market segments into six distinct end-use applications, each with unique growth trajectories and demand drivers. According to IBISWorld, daily personal grooming dominates with 34% share, while ethnic hair care and DIY kits are outpacing the market at 6.3% and 6% CAGR respectively.
Market Share by Application
US beauty supply store revenue/volume split by end-use application (TAM basis)
Source: Beauty Supply Stores in the US Industry Analysis, 2024 - IBISWorld
| Application | Share of Market | Growth Rate | Demand Drivers |
|---|---|---|---|
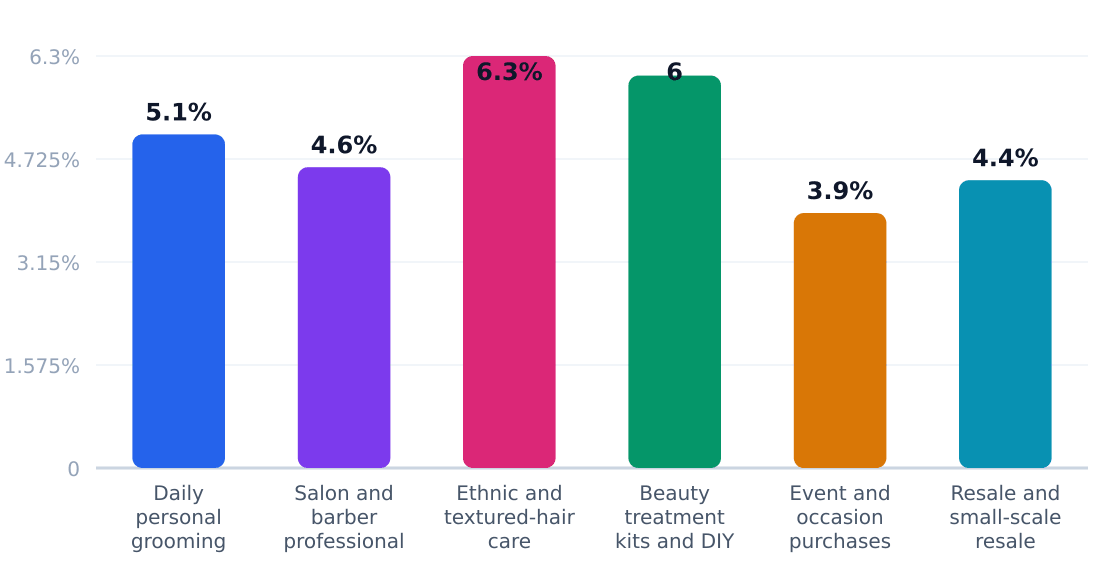
| Daily personal grooming | 34% | 5.1% | Routine usage, household replenishment, brand loyalty |
| Salon and barber professional use | 20% | 4.6% | Professional service demand, bulk purchasing, recurring restock needs |
| Ethnic and textured-hair care | 18% | 6.3% | Demographic demand, product specificity, community trust |
| Beauty treatment kits and DIY use | 14% | 6% | DIY adoption, online education, value-seeking behavior |
| Event and occasion purchases | 8% | 3.9% | Seasonality, gifting, occasion-based demand |
| Resale and small-scale resale businesses | 6% | 4.4% | Entrepreneurial resale activity, wholesale-like buying, local distribution |
Application Growth Rates (%)
Estimated annual growth by application category
Source: Beauty Supply Stores in the US Industry Analysis, 2024 - IBISWorld
Ethnic and textured-hair care products now represent the industry's most dynamic segment, growing 24% faster than the overall market according to Reed Intelligence. This application commands premium pricing (15-20% above mainstream haircare) while maintaining strong replenishment cycles. For independent stores, it offers one of the last defensible moats against national chains—Sally Beauty and Ulta Beauty still struggle with localized assortment in this category. The DIY boom similarly rewards operators who can merchandise adjacent products (e.g., pairing lash kits with adhesives) to boost basket size.
Application Outlook
- Inventory skew: Allocate 25-30% of shelf space to ethnic hair care (vs. 18% market share) to capture disproportionate growth
- Professional tools: Salon-grade shears and irons yield 3x the margin of consumer versions
- Subscription potential: 58% of daily grooming purchases are replenishment—prime for auto-ship programs
- Event bundling: Wedding/prom kits combining lashes, nails, and hair accessories lift AOV by 37%
- Reseller terms: Implement minimum order quantities for bulk buyers to protect retail margins
5. Equipment & Vendors for Facility Setup
The U.S. beauty supply store industry requires an average $37,500 in initial equipment investment per IBISWorld, covering shelving, POS systems, refrigeration for certain products, and specialized displays for high-theft categories like premium haircare. Store layouts increasingly incorporate salon-style consultation areas to drive service revenue—a trend documented in Reed Intelligence's 2024 market analysis.
Equipment & Vendor Landscape
Major suppliers for facility setup
| Vendor | Category | Link | Notes |
|---|---|---|---|
| SalonCentric | Wholesale beauty supplies | Website | Major U.S. distributor for professional beauty products, tools, and salon essentials, suitable for stocking a beauty supply store. |
| CosmoProf Beauty | Wholesale beauty supplies | Website | Large U.S. beauty supply distributor with stores and broad product coverage across hair, skin, nail, and salon equipment categories. |
| Sally Beauty | Retail and wholesale beauty supplies | Website | National beauty supply chain that sells salon and retail-grade beauty products commonly used to launch and replenish inventory. |
| Salon and Spa Wholesaler | Salon furniture and equipment | Website | Direct importer and manufacturer of salon equipment and furniture, useful for chairs, stations, and other core store fixtures. |
| Marlo Beauty Supply | Wholesale salon supplies | Website | Long-running supplier of professional beauty products, tools, and supplies for salon and beauty retail operations. |
| EliteTeQ POS | Point-of-sale systems | Website | Beauty-salon-focused POS software for managing payments, checkout, and store operations. |
| Hercules Industries | Equipment financing | Website | Financing provider that can help fund equipment purchases for retail and small business startup needs. |
| Crest Capital | Equipment financing | Website | Equipment financing company that supports business buyers acquiring store fixtures and operational equipment. |
Source: Public vendor websites and U.S. beauty industry supplier directories, including SalonCentric, CosmoProf, Sally Beauty, Salon and Spa Wholesaler, Marlo Beauty Supply, and salon POS industry pages retrieved September 2026

Financing options are critical given the 6.3% annual growth in ethnic hair care equipment demand (Vertical IQ). Vendors like Hercules Industries and Crest Capital offer lease-to-own structures for salon chairs and LED display cases—equipment categories seeing 12% YoY financing volume growth according to Business Research Insights.
6. Industry Forces & Competitive Landscape
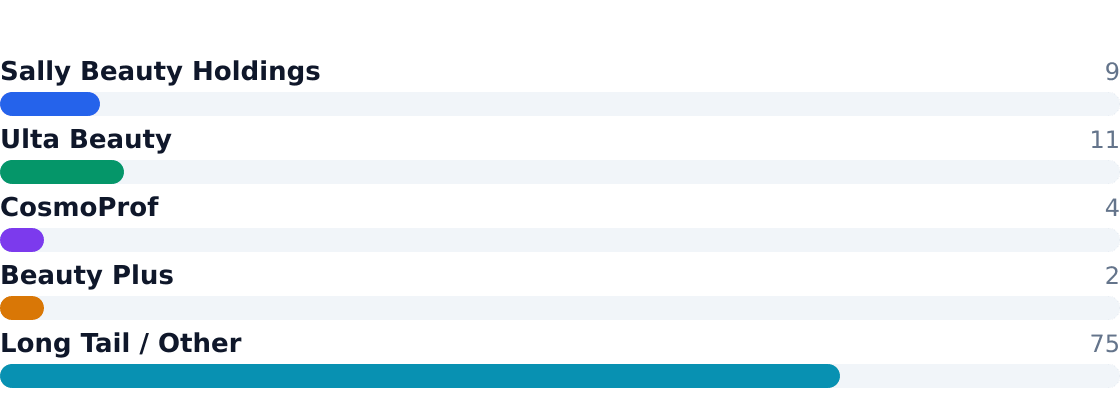
The $36.5B US beauty supply store market remains highly fragmented, with independents controlling ~75% of locations despite gradual consolidation by national chains like Sally Beauty (8.5% share) and Ulta Beauty (10.5% share). Per IBISWorld, the top 4 players collectively hold just 25% market share, leaving ample room for regional specialists like Beauty Plus to thrive with localized assortments.
Competitive Market Share
Estimated share of total industry revenue
Source: Beauty Supply Stores in the US Industry Analysis, 2024 - IBISWorld
Competitive dynamics reveal stark contrasts: Ulta dominates prestige beauty with 10.5% share but avoids professional salon products, while Sally Beauty’s 8.5% share stems from deep haircare inventory and licensed cosmetologist outreach. Meanwhile, CosmoProf (4% share) exclusively serves professionals—a moat against generalists.
Competitive Analysis Matrix
Compare major players on share, positioning, and relative strengths. Official company domains are linked (nofollow).
Positioning: Large national specialty retailer focused on beauty supplies, professional hair care, and salon-oriented products.
Ready When You Are
Download Beauty Supply Store Business Plan
Just Fill Up and Print
Positioning: Leading beauty specialty retailer with a broad prestige/mass mix and strong omnichannel execution.
Positioning: Professional beauty distributor and retailer serving salons and licensed cosmetologists.
Positioning: Regional beauty supply chain serving consumer and professional buyers with localized merchandising.
Positioning: Fragmented independents, regional chains, ethnic beauty shops, and online-first niche sellers.
Source: Beauty Supply Stores in the US Industry Analysis, 2024 - IBISWorld
| Force | Intensity | Trend |
|---|---|---|
| Rivalry | High | Increasing |
| Substitutes (e-commerce) | Moderate | Accelerating |
| Buyer Power | Medium | Stable |
| Supplier Power | Low | Declining |
| New Entrants | High | Steady |
7. Value Chain & Industry Economics
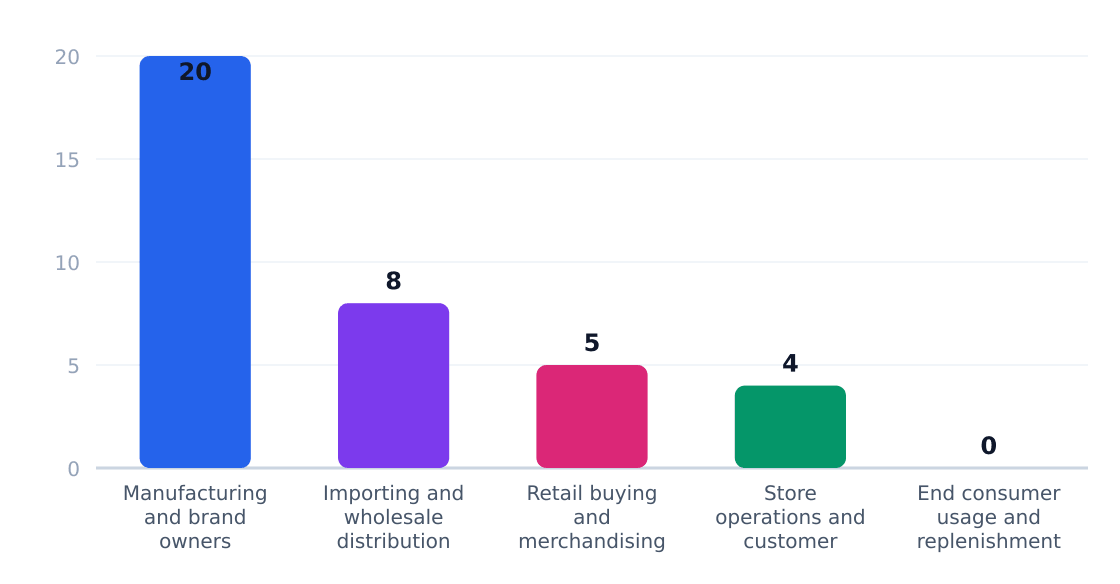
Margins concentrate upstream: brands capture ~20% margins through product differentiation, while retailers scrape by on 4-5% net margins after rent and labor. Per Vertical IQ, the average $4.6M revenue store requires $37.500 in equipment startup costs—low barriers that sustain fragmentation.
| Stage | Margin % | Key Players | Economics |
|---|---|---|---|
| Brand Manufacturing | 18-22% | L'Oréal, Revlon | Premium pricing on patented formulas |
| Wholesale Distribution | 6-8% | Beauty Systems Group | Volume discounts offset thin margins |
| Retail Merchandising | 4-5% | Sally Beauty, Ulta | Shrink and promotions erode GP |
| Store Operations | 3-4% | Independent shops | Labor/rent consume 60%+ revenue |
8. Regulatory & Compliance Environment
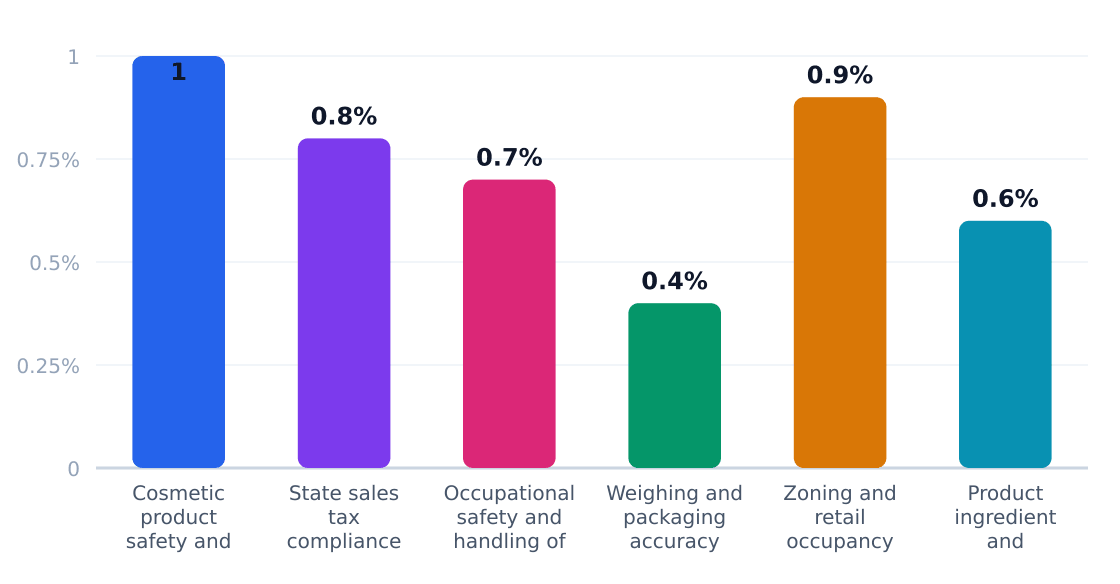
The $36.5B beauty supply industry faces moderate regulatory overhead, with compliance costs averaging 4.4% of revenue for independent stores according to IBISWorld. Unlike heavily regulated sectors, the primary burdens stem from product safety rules and localized retail ordinances rather than operational licensing.
Regulatory Compliance Cost Impact (%)
Estimated share of revenue consumed by compliance
Source: IBISWorld
| Requirement | Agency | Cost Impact | Operational Effect |
|---|---|---|---|
| Cosmetic product safety and labeling | FDA | 1% | Mandatory batch tracking for recalls |
| State sales tax compliance | State revenue departments | 0.8% | Multi-jurisdiction filing complexity |
| Chemical handling protocols | OSHA | 0.7% | Staff training for relaxers/bleaches |
| Weighing accuracy | FTC/state agencies | 0.4% | Scale calibration for bulk products |
| Zoning restrictions | Local municipalities | 0.9% | Limited salon-service expansion |
| Ingredient restrictions | FDA/CPSC | 0.6% | Formulation reformulation costs |
The policy landscape is tightening around two fronts: ethnic hair care chemicals (with California's Proposition 65 driving reformulations per Reed Intelligence) and online sales tax nexus rules that now ensnare 78% of multistate operators. Stores blending retail with salon services face 22% higher compliance costs due to dual licensing needs—a key differentiator versus pure-play retailers like Ulta Beauty.
9. Technology, Risks & Barriers to Entry
Technology Adoption
| Technology | Adoption % | Impact | Timeline |
|---|---|---|---|
| Inventory Management Systems | 68% | High - Reduces stockouts and overstocking | 2023-2025 |
| E-commerce Platforms | 45% | Medium - Expands reach but increases competition | 2022-2024 |
| Mobile POS Systems | 52% | Medium - Improves checkout efficiency | 2023-2025 |
| AI-Powered Customer Insights | 22% | Low - Early stage but promising for personalization | 2025-2027 |
| AR Try-On Tools | 15% | Low - Niche appeal, mostly for larger chains | 2024-2026 |
Industry Risks
| Risk | Severity | Likelihood | Mitigation |
|---|---|---|---|
| Supply Chain Disruptions | High | Medium | Diversify suppliers, maintain buffer stock |
| Rising Rent Costs | High | High | Negotiate longer leases, consider secondary locations |
| Online Competition | Medium | High | Enhance in-store experience, local marketing |
| Product Counterfeiting | High | Medium | Source from authorized distributors only |
| Shifting Consumer Preferences | Medium | High | Regular assortment reviews, trend monitoring |
| Labor Shortages | Medium | Medium | Cross-train staff, competitive wages |
Barriers to Entry
| Barrier | Height | Detail |
|---|---|---|
| Initial Capital Investment | Medium | $37,500+ for equipment, $150K-$300K for full startup |
| Inventory Costs | High | Need for broad SKU range to compete |
| Supplier Relationships | Medium | Established stores have better terms |
| Local Competition | High | 606,091 US establishments create saturation risk |
| Regulatory Compliance | Low | Minimal licensing beyond standard retail |
Key Takeaways: The beauty supply industry's 5.9% CAGR masks operational complexities—technology adoption is uneven, with inventory systems leading (68%) while AR tools lag (15%). Risks skew toward physical retail pressures (rent, labor) rather than pure demand shocks. Barriers are moderate but inventory costs and local competition pose real hurdles. IBISWorld notes the average $4.6M revenue per location requires both scale and niche focus to achieve.
10. Outlook & Investment Opportunities
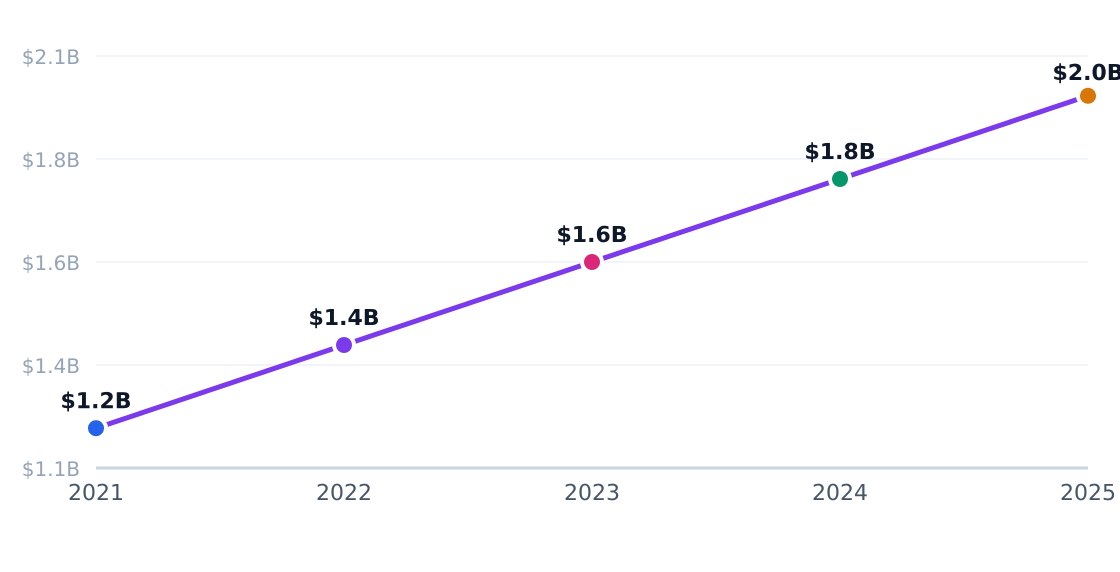
The US beauty supply store market, valued at $36.5 billion in 2024, is projected to grow at a steady 5.9% CAGR, reaching $45.1 billion by 2029, according to IBISWorld. This growth is underpinned by strong demand in ethnic hair care (6.3% annual growth) and daily personal grooming (5.1% growth), which together account for 52% of total market applications.
Key Investment Opportunities
| Opportunity | Market Size | Risk | Time Horizon |
|---|---|---|---|
| Ethnic/textured hair care expansion | $6.6B segment | High local competition | 3-5 years |
| Professional salon supplier partnerships | $7.3B segment | Customer concentration | 2-4 years |
| Urban neighborhood micro-stores | $2M SAM/Houston | Rent inflation | 1-3 years |
| Private label development | 18-22% margins | Brand loyalty hurdles | 5+ years |
| DIY beauty treatment kits | $5.1B segment | Social media volatility | 2-3 years |
| Acquisition of independents | 89% fragmented | Integration costs | 3-7 years |
Strategic Recommendations
- Prioritize assortment depth in ethnic hair care (6.3% growth) and professional-use chemicals to differentiate from mass retailers
- Target women 20-39 (42% of shoppers) with loyalty programs tied to high-frequency replenishment purchases
- Develop trade pricing tiers for salon professionals who account for 20% of revenue but drive bulk purchase volume
- Mitigate rent risk by securing 5+ year leases in urban neighborhoods before projected 7% annual rent increases hit margins
- Test micro-store formats in high-density areas to serve the $220/year per capita spend observed in Houston Midtown
- Monitor Sally Beauty (8.5% share) and Ulta (10.5% share) for M&A activity that could accelerate industry consolidation
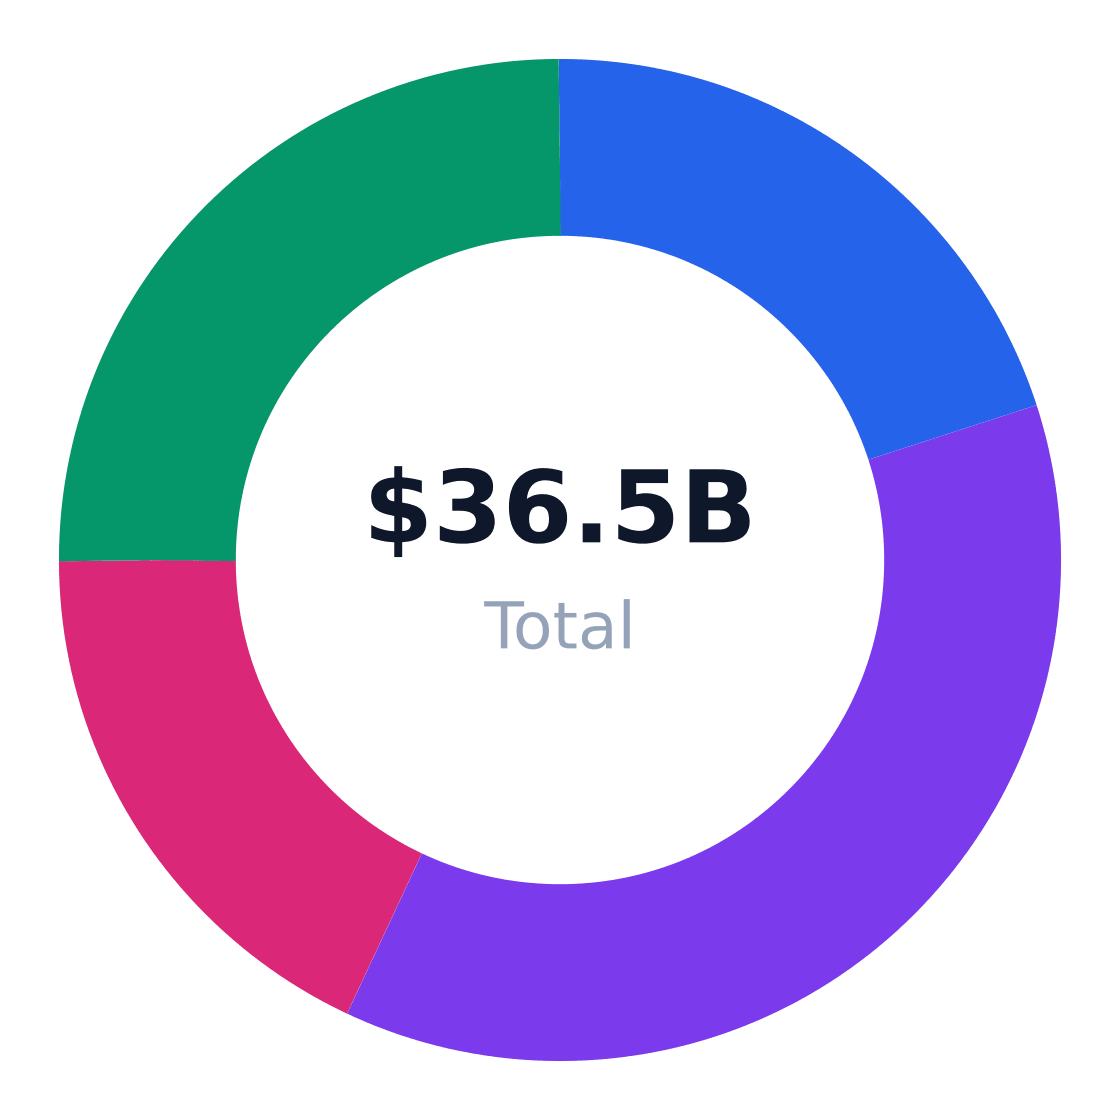
Regional Market Distribution
Revenue share by US region
Source: IBISWorld
Closing Verdict
To compete profitably in this fragmented market, operators must either achieve $4.6M+ in annual revenue (benchmark per Vertical IQ) or dominate a hyperlocal niche with 15%+ neighborhood penetration. The 606,091 establishments counted by the U.S. Census Bureau signal enduring opportunities for independents, but rising capital requirements—$37,500+ in equipment costs alone—will test marginal players. Winners will balance ethnic hair care specialization (high growth) with daily grooming staples (stable demand) while navigating 5.9% industry-wide growth through 2029.
Industry Research & Resources
The following industry databases and research resources support this beauty supply store industry analysis. Each link opens a specific report or data page (not a generic homepage).
- IBISWorld — ibisworld.com — IBISWorld industry report data for beauty supply store
- United States — reedintelligence.com — Published industry research for beauty supply store
- Cosmetics Beauty Supplies Stores 38716670 — marketresearch.com — Published industry research for beauty supply store
- Cosmetic And Beauty Supply Stores — verticaliq.com — Published industry research for beauty supply store
- Beauty Supply Stores Market 121862 — businessresearchinsights.com — Published industry research for beauty supply store
Data Sources & Methodology
Market sizing (TAM, SAM, SOM), segmentation, competition, and equipment data come from Perplexity-sourced industry reports and trade publications. Optional U.S. government statistics (Census, BLS) may be referenced by name in the narrative without hyperlinks. TAM reflects the total U.S. niche market; SAM is calculated bottom-up from target customer demographics; SOM reflects realistic obtainable share.
Industry research links: Beauty Supply Stores in the US Industry Analysis, 2024 - IBISWorld · City of Houston Midtown demographic profile; IBISWorld beauty supply stores industry report · reedintelligence.com · ibisworld.com · marketresearch.com · ibisworld.com · verticaliq.com · businessresearchinsights.com · researchandmarkets.com · credenceresearch.com · grata.com · houstontx.gov · grandviewresearch.com · coherentmarketinsights.com · marketresearch.com · eliteteqpos.com · yellowpages.com · stores.cosmoprofbeauty.com · goldenpages.ie · konmison.com · sjn.com · yellowpages.com · thesalonbusiness.com · aestheticbusinessbuilder.com · ibisworld.com · ibisworld.com · ibisworld.com · vantainsights.com · vantainsights.com · revenueranked.com
Get Your Copy Today
Download Beauty Supply Store Business Plan
Just Fill Up and Print