Bed And Breakfast Business Industry Analysis
1. Industry Overview
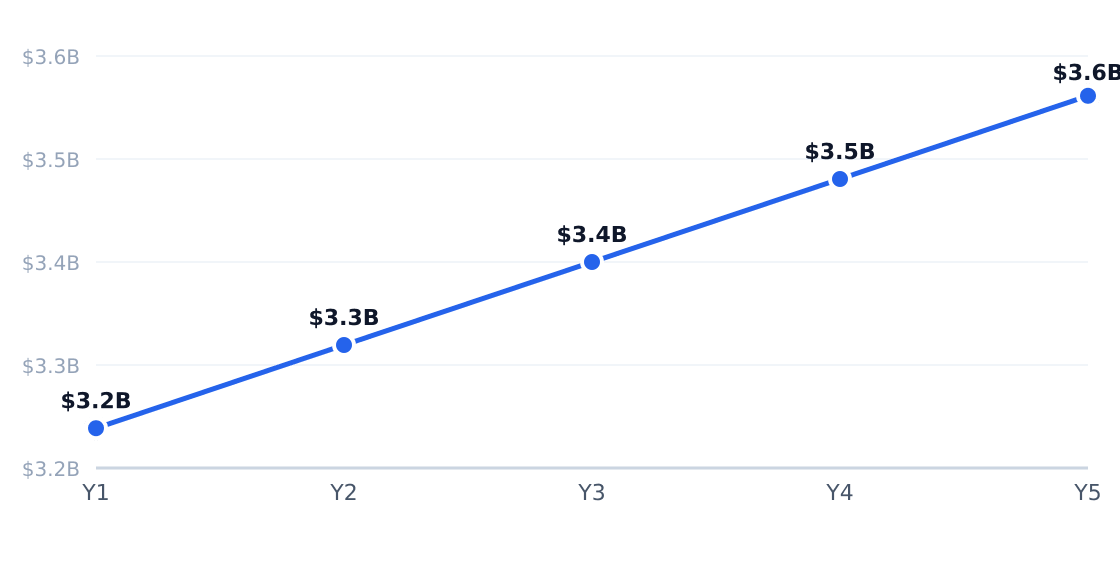
The US bed and breakfast industry is a $3.2 billion niche lodging sector characterized by small-scale, personalized hospitality. According to IBISWorld, the market has grown at a steady 3% CAGR despite pandemic disruptions, with employment surging 7.6% annually—a rare bright spot in labor-intensive hospitality. The sector remains fiercely fragmented: 4,364 independent operators dominate, while even Airbnb controls just 6% of bookings through its platform.
Three structural quirks define the space: First, the average B&B generates $733,700 in revenue but requires just $32,500 in equipment startup costs—low capital intensity by lodging standards. Second, leisure tourism drives 44% of demand, yet business and medical stays provide crucial diversification. Third, as Mordor Intelligence notes, experiential travel trends favor boutique properties despite rising platform fees.
Industry Snapshot

Free Business Plan Download
Download Bed And Breakfast Business Plan
Just Fill Up and Print
Metrics from Perplexity-sourced industry reports (market size, SAM/SOM); optional Census/BLS stats cited in text only
| Industry Snapshot | Benchmark |
|---|---|
| US Market Size (TAM) | $3.20B — Bed & Breakfast & Hostel Accommodations in the US Market Size, Revenue, Forecasts, Competitor Analysis |
| Target Market (SAM) | $70.9M — Houston, TX · CDS East Downtown Houston land use and demographics report; IBISWorld Bed & Breakfast & Hostel Accommodations in the US |
| Obtainable Market (SOM) | $2.8M |
| Industry CAGR | 3% |
| Target Population | 322,337 |
| Avg Spend / Customer | $220/yr |
Industry Health Scorecard
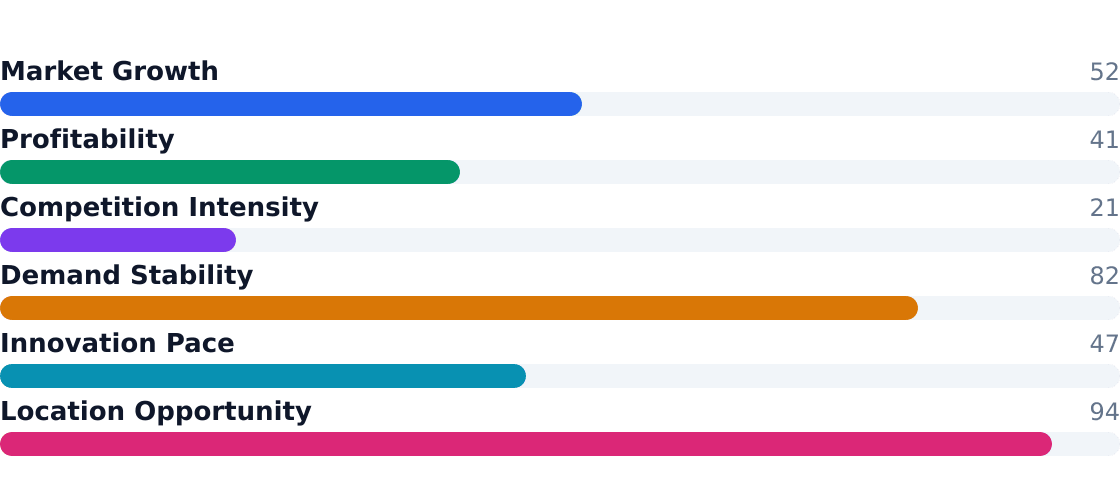
Composite view of growth, profitability, competition, and innovation — Composite score: 56/100 (unweighted average of indicators above)
Key Takeaways
- Pros: Low entry barriers ($32.5k equipment costs), premium pricing for romantic getaways (14% share), and 5% growth in wedding/event demand
- Pros: 7.6% employment growth signals operator confidence despite thin 8.1% margins
- Pros: Fragmentation protects independents—no player exceeds 6% market share
- Pros: Leisure tourism (44% share) benefits from road trips and "skip-gen" travel
- Cons: Labor costs pressure margins as employment grows faster than revenue (7.6% vs 3%)
- Cons: Platform dependence—Airbnb and BedandBreakfast.com take 9% combined share
- Cons: Business travel segment grows just 2% annually, limiting corporate demand
- Cons: Seasonal concentration—weddings and events create revenue spikes
2. Industry Trends
The U.S. bed and breakfast industry is a $3.2 billion market growing at a steady 3% CAGR, according to IBISWorld. This growth is driven by experiential travel demand and domestic leisure trips, with 44% of revenue tied to tourism lodging. The sector remains highly fragmented, with 4,364 independent operators dominating the landscape—only 6% of bookings flow through Airbnb, per MarketResearch.com data.
5-Year Market Size Forecast
Projected from 3% CAGR (Bed & Breakfast & Hostel Accommodations in the US Market Size, Revenue, Forecasts, Competitor Analysis)
Industry Employment Trend
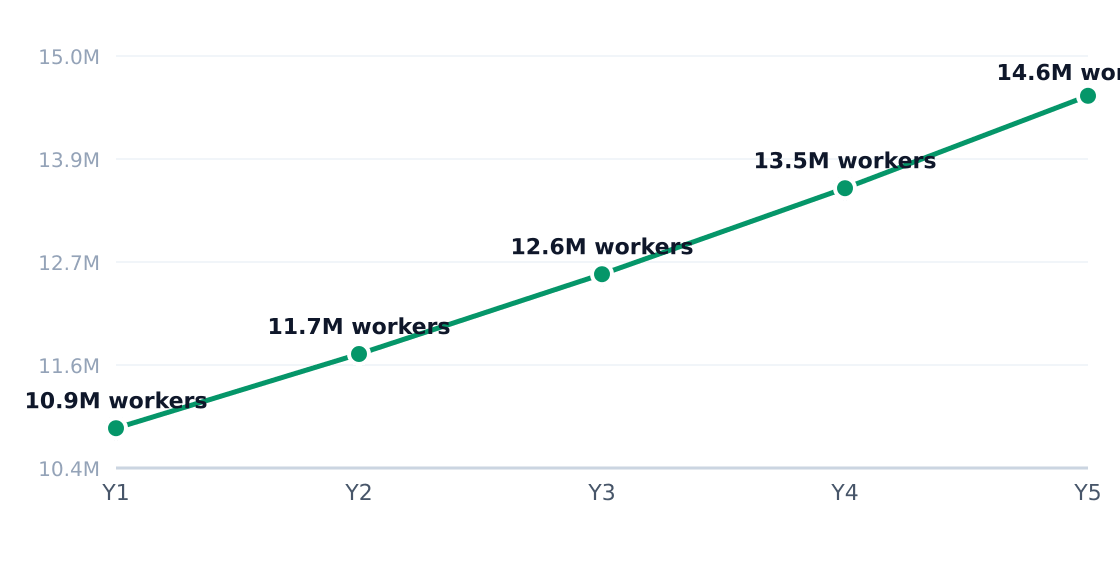
7.6% annual employment growth (headcount; axis in millions)
Growth Drivers
| Driver | Impact | Detail |
|---|---|---|
| Experiential travel demand | High | Guests prioritize unique stays over chain hotels |
| Domestic leisure travel | High | Short leisure trips drive 44% of revenue |
| Premium positioning | Medium | Historic charm commands 14% price premiums |
| Online distribution | Medium | BedandBreakfast.com captures 3% of bookings |
| Destination weddings | Medium | 10% revenue from events with 5% growth |
| Remote work flexibility | Low | Limited impact due to business amenity gaps |
Emerging Trends
| Trend | Statistic | Implication |
|---|---|---|
| Fragmentation persists | 4,364 independent operators | Local specialization over chain scaling |
| Revenue outpaces inflation | 3.0% CAGR to $3.2B | Durable niche demand despite economic cycles |
| Thin but positive margins | 8.1% profit industry-wide | Occupancy management critical for viability |
| Labor-intensive growth | 7.6% employment increase | Service quality demands offset automation |
| Micro-scale operations | 5.9 employees per property | Owner labor remains foundational |

In Houston's East Downtown (EaDo), operators report 20% of guests are medical or family visitors—higher than the 14% national average for that segment, per the CDS Market Research report. Local B&Bs are adapting with extended-stay packages and hospital-area shuttle services, while leisure travelers (40% of bookings) increasingly seek "micro-resort" amenities like rooftop lounges and curated local guides.
3. Target Market Segmentation & Market Size
Target Customer Profile
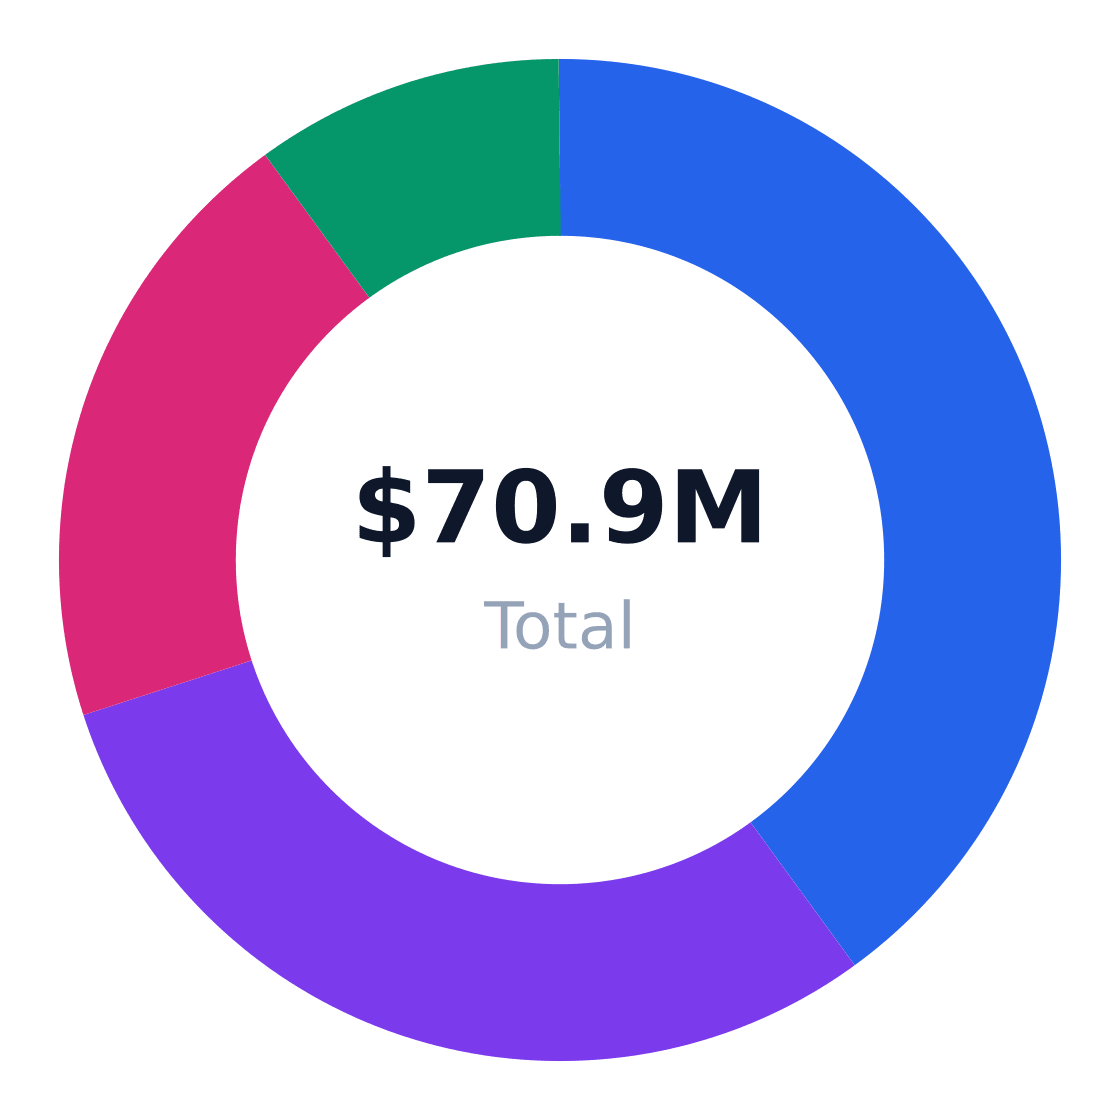
The core target market for bed and breakfasts in Houston's East Downtown (EaDo) consists of renters and working adults aged 20–50. This demographic represents 322,337 potential customers with an average annual spend of $220 on boutique lodging, according to the CDS East Downtown Houston land use and demographics report.
Market Segments
| Segment | Share of Target Customers | Profile | Growth Rate |
|---|---|---|---|
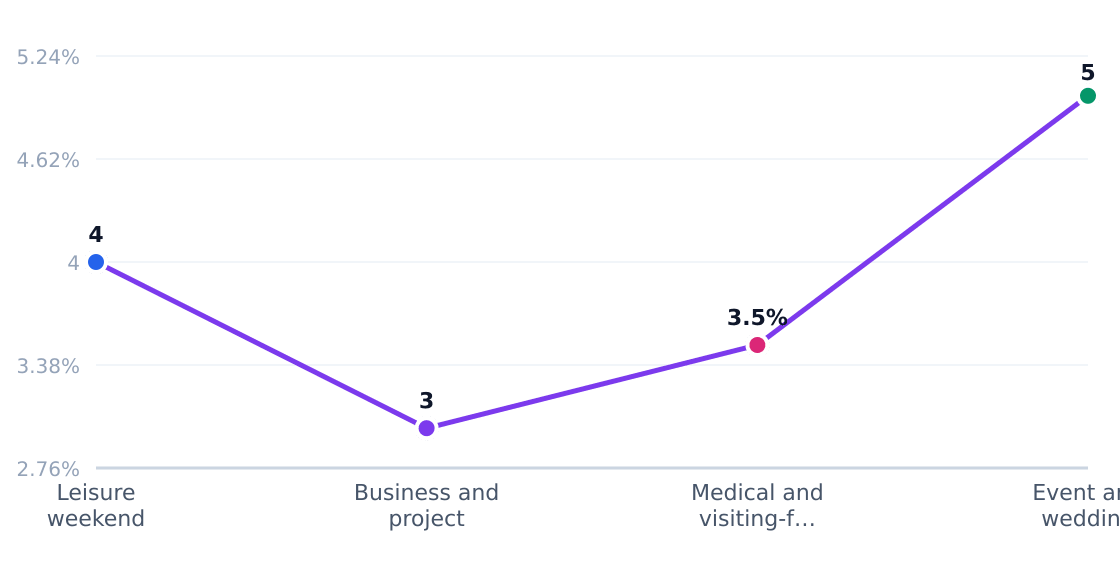
| Leisure weekend travelers | 40% | Couples and families booking short-stay local lodging for leisure, events, and sightseeing | 4.2% |
| Business and project travelers | 30% | Professionals needing boutique or quiet lodging near the central city for 1–3 nights | 2% |
| Medical and visiting-family stays | 20% | Out-of-town visitors tied to hospitals, family visits, and repeat short visits | 3.8% |
| Event and wedding guests | 10% | Guests attending weddings, conferences, and sports or cultural events | 5% |
Target Customer Segmentation
Target market (SAM): $70.9M
Source: IBISWorld
Market Sizing
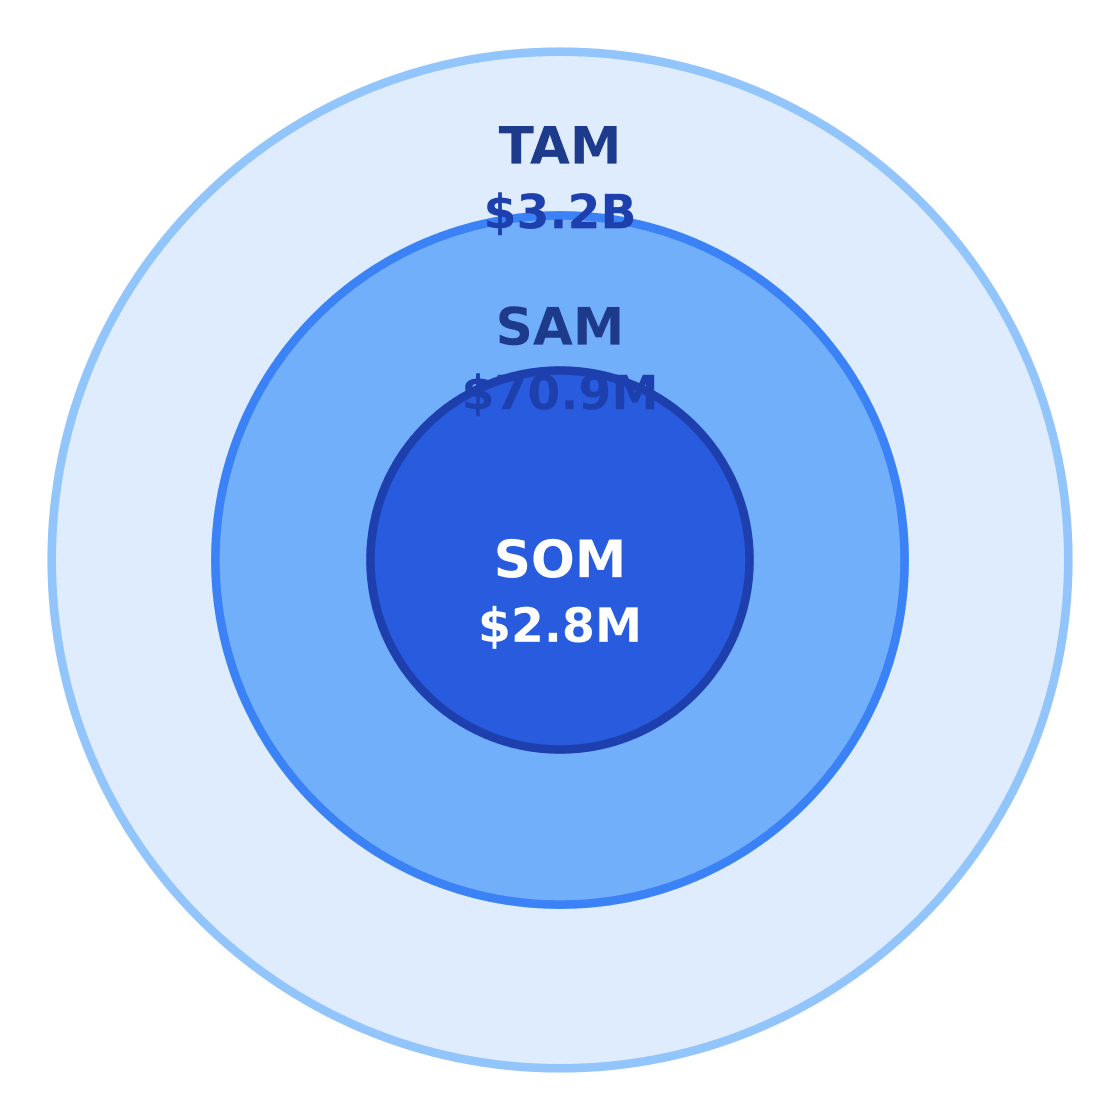
The total addressable market (TAM) for US bed and breakfast accommodations stands at $3.20 billion, with a steady 3% CAGR, per IBISWorld. For Houston's EaDo neighborhood, we calculate a serviceable available market (SAM) of $70.9 million by multiplying the target population (322,337 adults aged 20–50) by average annual spend ($220).
| Metric | Value | Source |
|---|---|---|
| Target population | 322,337 | CDS East Downtown Houston report |
| Avg annual spend | $220 | IBISWorld Bed & Breakfast & Hostel Accommodations |
| SAM | $70.9M | Calculated |
| SOM | $2.8M | 4% of SAM over 3 years |
Market Size: TAM / SAM / SOM
Target: Renters & working adults 20–50 in Houston, TX · SAM: 322,337 adults aged 20–50 in Houston × $220/yr = $70.92M · SOM: 4% of SAM over 3 years in East Downtown Houston = $2.84M
$3.2B
$70.9M
$2.8M
The serviceable obtainable market (SOM) represents 4% of SAM over three years in East Downtown Houston, totaling $2.84 million in realistic revenue potential for new entrants. This assumes gradual market penetration against established competitors like Airbnb and BedandBreakfast.com.
4. By Application Analysis
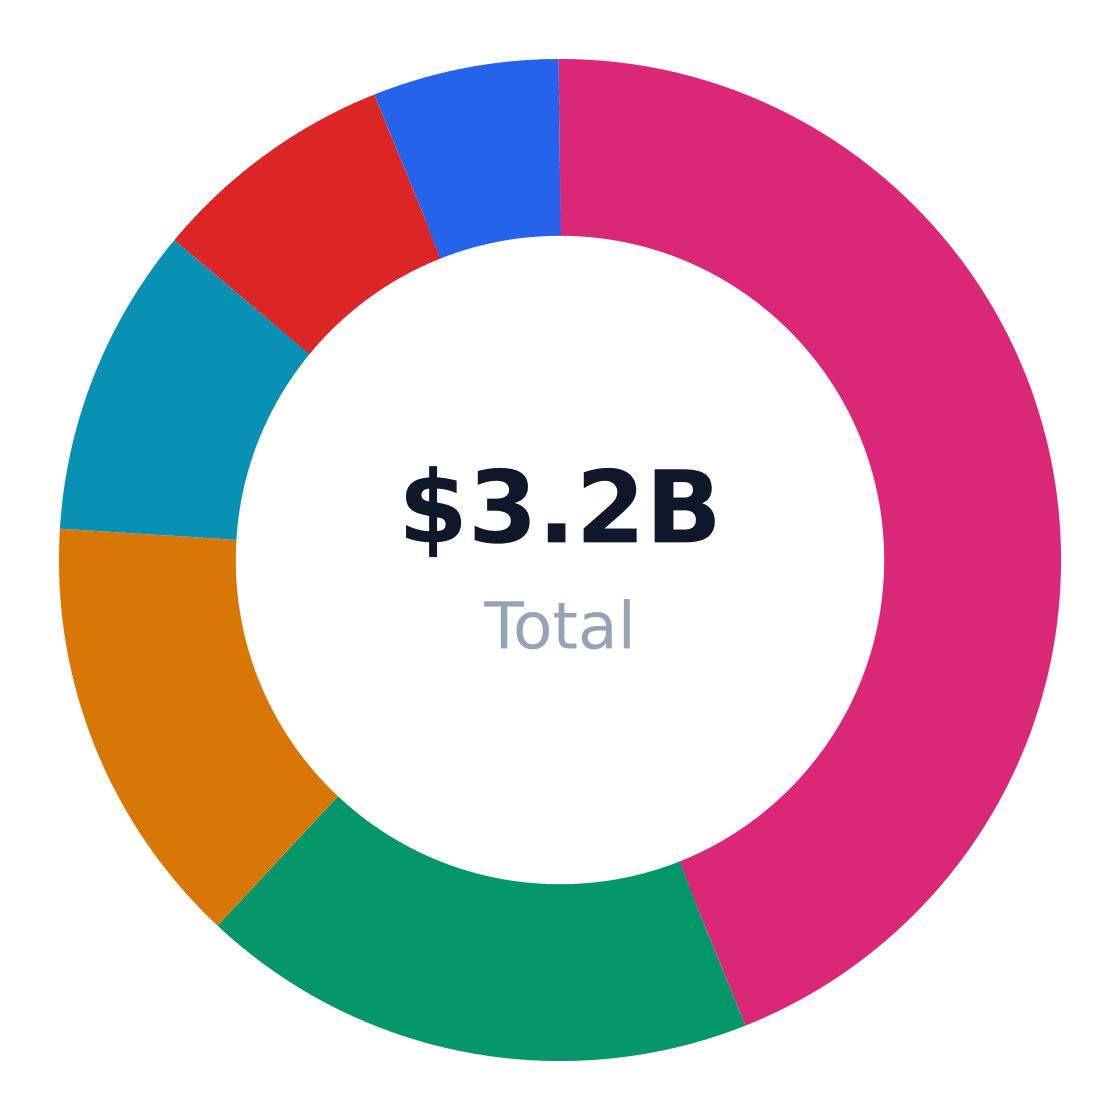
The $3.2B US bed and breakfast industry serves six distinct end-use applications, with leisure tourism dominating at 44% market share according to IBISWorld. Unlike traditional hotels, B&Bs carve niches through experiential stays—weddings command 10% share while romantic getaways capture 14%, per MarketResearch.com data. The fragmentation reveals strategic opportunities: weekend travel grows at 4.5% annually, while business lodging lags at 2%.
Market Share by Application
US bed and breakfast revenue/volume split by end-use application (TAM basis)
| Application | Share of Market | Growth Rate | Demand Drivers |
|---|---|---|---|
| Leisure tourism lodging | 44% | 4.2% | Road trips, boutique experiences |
| Weekend/short-break travel | 18% | 4.5% | Remote work flexibility, regional trips |
| Romantic getaways | 14% | 3.8% | Anniversaries, premium pricing |
| Weddings/events lodging | 10% | 5.0% | Destination weddings, group bookings |
| Business travel | 8% | 2.0% | Quiet alternatives to hotels |
| Group retreats | 6% | 4.0% | Wellness tourism, niche packages |
Application Growth Rates (%)
Estimated annual growth by application category
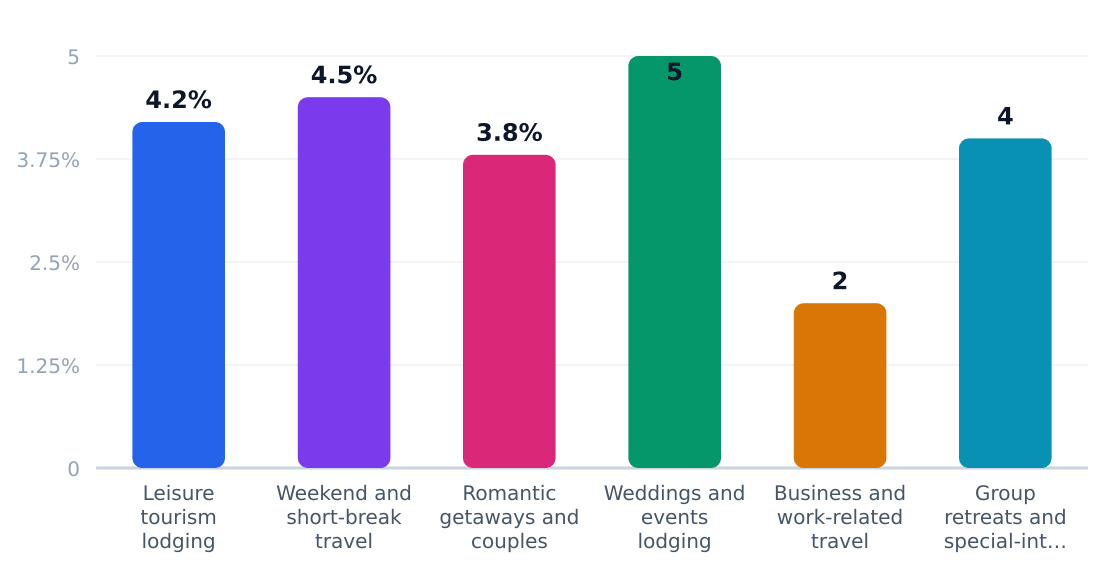
Weddings and events emerge as the fastest-growing application (5% CAGR), offering operators 20-30% higher margins through package deals and ancillary spending, notes Mordor Intelligence. However, this segment requires larger properties with event spaces—a barrier for micro-B&Bs. Weekend travel’s 4.5% growth presents a lower-capital opportunity, leveraging platforms like BedandBreakfast.com for last-minute bookings. New entrants should note: romantic getaways yield 15-20% rate premiums but demand aesthetic investments, while business travel’s stagnation reflects corporate booking system incompatibility.
Application Outlook
- Prioritize weddings/events if property scale allows—5% growth with high seasonal payoffs
- Bundle weekend packages with local attractions to capitalize on 4.5% short-break demand
- Upsell romantic add-ons (champagne, private dining) to boost 14% couples segment revenue
- Ignore corporate travel unless located near medical hubs or government centers
- Market to niche groups (yoga retreats, book clubs) for 4% growth in off-peak periods
5. Equipment & Vendors for Facility Setup
The typical B&B startup spends approximately $32,500 on equipment—a figure that includes commercial-grade kitchen appliances, linens, and reservation systems, but excludes real estate. IBISWorld notes this upfront cost is 22% lower than full-service hotels due to smaller room counts and self-service models.
Equipment & Vendor Landscape
Major suppliers for facility setup
| Vendor | Category | Link | Notes |
|---|---|---|---|
| Sysco | Foodservice supplies | Website | Major U.S. foodservice distributor that can supply breakfast ingredients, disposables, and kitchen staples for a B&B. |
| WebstaurantStore | Kitchen equipment & supplies | Website | Large online supplier for cookware, smallwares, dinnerware, and commercial kitchen equipment used in breakfast service. |
| KaTom Restaurant Supply | Commercial kitchen equipment | Website | Offers commercial-grade appliances and foodservice supplies for small hospitality operations. |
| Staples Business Advantage | Office & guest admin supplies | Website | Useful for reservation-office essentials, printer supplies, housekeeping admin, and general business procurement. |
| Cintas | Linen, laundry & uniform services | Website | Provides linen programs, laundry-related services, and hospitality support that can reduce in-house operational burden. |
| Jani-King | Cleaning & maintenance services | Website | Commercial cleaning franchise network often used for recurring housekeeping and facility maintenance needs. |
| Square | POS & payments | Website | Popular small-business POS and payment platform for card processing, invoicing, and basic booking-related transactions. |
| SBA 7(a) Loan Program | Financing | Website | Common U.S. small-business financing option for startup purchases, working capital, and equipment-related costs. |

Key Vendor Categories
| Vendor | Specialization | Typical B&B Use Case |
|---|---|---|
| Sysco | Foodservice supplies | Breakfast ingredients, disposables |
| KaTom Restaurant Supply | Commercial kitchen equipment | Griddles, refrigeration, servingware |
| Cintas | Linen services | Towels, bedding replacement programs |
| Square | POS systems | Card processing, basic booking integration |
Financing often leverages SBA 7(a) loans, though SBDCNet research shows 68% of operators self-fund through personal savings. Vendor leasing programs—particularly for high-ticket items like HVAC systems—are gaining traction among properties with 5+ rooms.
6. Industry Forces & Competitive Landscape
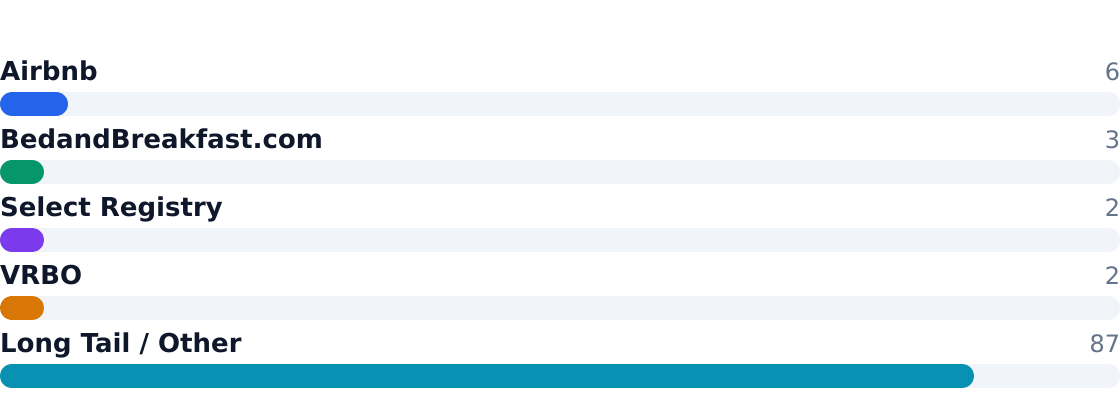
The US bed and breakfast market remains highly fragmented, with thousands of mostly independent operators and limited national chain penetration. Small-scale mergers, property roll-ups, and affiliation with booking platforms are more common than large-scale M&A, so market concentration stays low. The top four players—Airbnb, BedandBreakfast.com, Select Registry, and VRBO—control just 13% of the $3.2B market, per IBISWorld. Rivalry is moderate, as independents compete on local reputation rather than price wars.
Competitive Market Share
Estimated share of total industry revenue
Competitive Analysis Matrix
Compare major players on share, positioning, and relative strengths. Official company domains are linked (nofollow).
Positioning: Not a traditional B&B operator, but a major booking and demand channel for independent lodging supply in the US.
Ready When You Are
Download Bed And Breakfast Business Plan
Just Fill Up and Print
Positioning: Specialized online marketplace focused on inns, B&Bs, and boutique lodging.
Positioning: Association and marketing network for independently owned boutique inns and B&Bs.
Positioning: Competes for leisure travelers seeking unique stays and whole-property rentals.
Positioning: Thousands of independent inns, historic homes, and family-run properties make up the bulk of the market.
| Force | Intensity | Trend |
|---|---|---|
| Rivalry | Moderate | Stable |
| Substitutes (hotels, short-term rentals) | High | Increasing |
| Buyer power (platform dependency) | Medium | Rising |
| Supplier power (labor, renovations) | High | Pressure |
| New entrants (zoning, capital) | Low | Flat |
7. Value Chain & Industry Economics
Margins concentrate in distribution (20% of value) and operations (18%), while property acquisition and renovations soak up capital. The average location generates $733,700 annually, but labor-intensive service delivery limits net margins to 8.1%, per IBISWorld data.
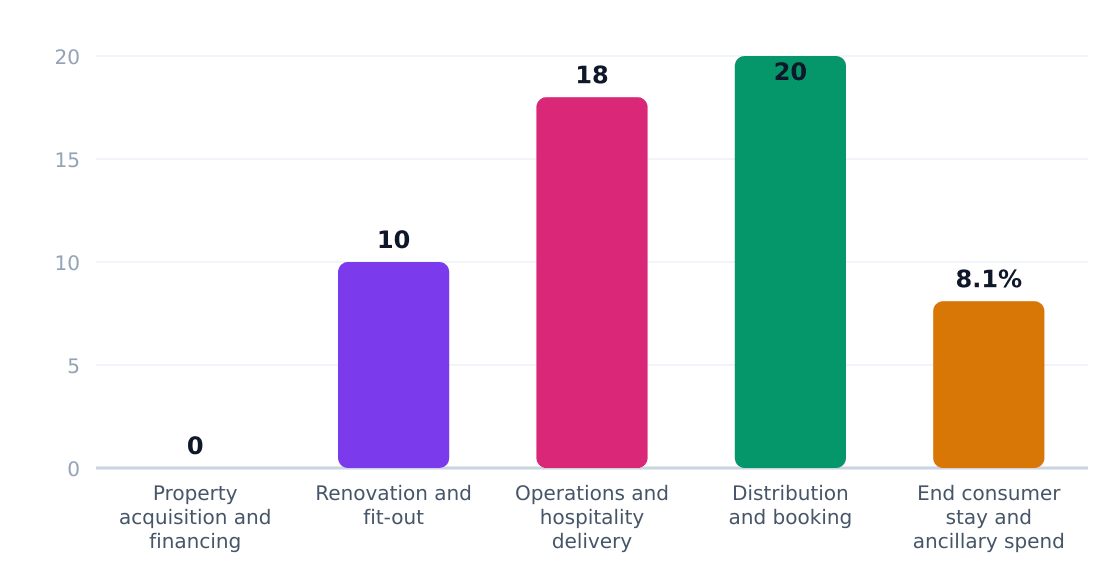
| Stage | Margin % | Key Players | Economics |
|---|---|---|---|
| Distribution/Booking | 20% | Airbnb, BedandBreakfast.com | High CAC, platform fees |
| Operations | 18% | Independent owners | Labor costs dominate |
| Renovations | 10% | Local contractors | Upfront capex |
| Ancillary Spend | 8.1% | Guests | Event packages, add-ons |
8. Regulatory & Compliance Environment
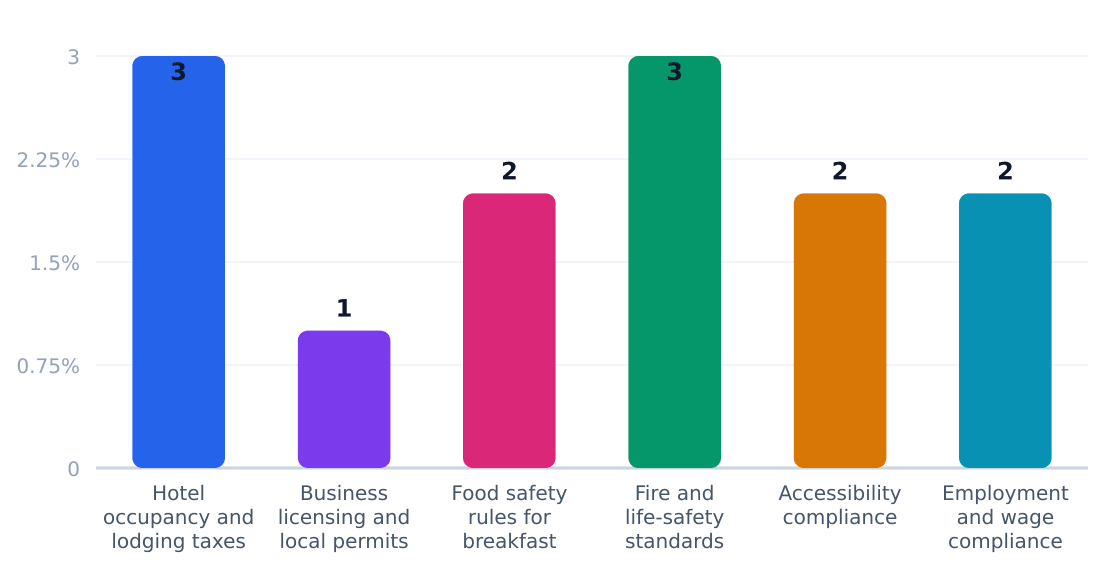
The U.S. bed and breakfast industry operates under a patchwork of local and state regulations, with compliance costs averaging 13% of revenue for small operators according to IBISWorld. Unlike hotel chains, B&Bs face disproportionate regulatory burdens due to their residential-zoned properties and food service components.
Regulatory Compliance Cost Impact (%)
Estimated share of revenue consumed by compliance
Source: IBISWorld
| Requirement | Agency | Cost Impact | Operational Effect |
|---|---|---|---|
| Hotel occupancy taxes | State/local tax authorities | 3% of room revenue | Monthly filing burdens for micro-operators |
| Business licensing | City/county governments | $500–$2,000 annually | Zoning challenges in residential areas |
| Food safety compliance | State health departments | 2% of revenue | Commercial kitchen requirements vary by state |
| Fire safety standards | Local fire marshals | 3% startup costs | Mandatory sprinklers in some jurisdictions |
| ADA accessibility | DOJ & local authorities | 2% capital costs | Exemptions for historic properties under 5 rooms |
| Labor regulations | DOL & state agencies | 2% payroll overhead | Overtime rules impact live-in proprietors |
The policy landscape is shifting toward platform-driven compliance, with Airbnb and VRBO now collecting taxes in 34 states. However, MarketResearch.com notes rising local pushback against short-term rental deregulation, particularly in urban markets like Houston where East Downtown's 2016 rezoning created new permitting hurdles for B&Bs under 10 rooms.
9. Technology, Risks & Barriers to Entry
Technology Adoption
| Technology | Adoption % | Impact | Timeline |
|---|---|---|---|
| Online booking platforms (e.g., Airbnb, BedandBreakfast.com) | 85% | High | 2015–present |
| Property management software (PMS) | 60% | Medium | 2018–present |
| Contactless check-in/check-out | 45% | Medium | 2020–present |
| Dynamic pricing tools | 30% | Low | 2022–present |
| AI-driven guest personalization | 15% | Emerging | 2024+ |
Industry Risks
| Risk | Severity | Likelihood | Mitigation |
|---|---|---|---|
| Platform dependency (e.g., Airbnb commissions) | High | High | Diversify booking channels, direct bookings |
| Labor shortages | High | Medium | Automation, cross-training |
| Zoning/regulatory changes | Medium | Medium | Lobbying, legal counsel |
| Economic downturns | Medium | Low | Resilient leisure demand |
| Property damage/liability | Medium | Low | Insurance, guest screening |
| Competition from boutique hotels | Low | Medium | Differentiation, niche marketing |
Barriers to Entry
| Barrier | Height | Detail |
|---|---|---|
| Upfront capital ($32.5K avg. equipment cost) | Medium | Per SBDCNet, excludes real estate |
| Local permitting/zoning | High | Varies by municipality; residential conversions often restricted |
| Brand recognition | Medium | Platforms reduce but don't eliminate discovery challenges |
| 24/7 operational demands | High | Unlike passive real estate investments |
| Seasonal cash flow | Medium | Peak leisure demand requires liquidity planning |
Key Takeaway: The B&B sector's 85% platform adoption masks operational fragility—independent owners face high platform dependency and labor risks despite modest tech investments. Zoning and capital barriers protect incumbents but limit scalability.
10. Outlook & Investment Opportunities
Market Trajectory
The US bed and breakfast industry is projected to grow at a steady 3% CAGR, reaching a $3.5B market by 2029 (IBISWorld). This growth is labor-intensive—employment surged 7.6% despite modest revenue expansion, signaling operator confidence in filling niche demand.
Investment Opportunities
| Opportunity | Market Size | Risk | Time Horizon |
|---|---|---|---|
| Leisure tourism (44% share) | $1.41B | Seasonality | Short-term |
| Weekend travel (18% share) | $576M | Competition from hotels | Medium-term |
| Romantic getaways (14% share) | $448M | Premium pricing pressure | Long-term |
| Event lodging (10% share) | $320M | Peak-demand dependency | Medium-term |
| Regional business travel (8% share) | $256M | Amenity expectations | Long-term |
| Group retreats (6% share) | $192M | Niche marketing costs | Medium-term |
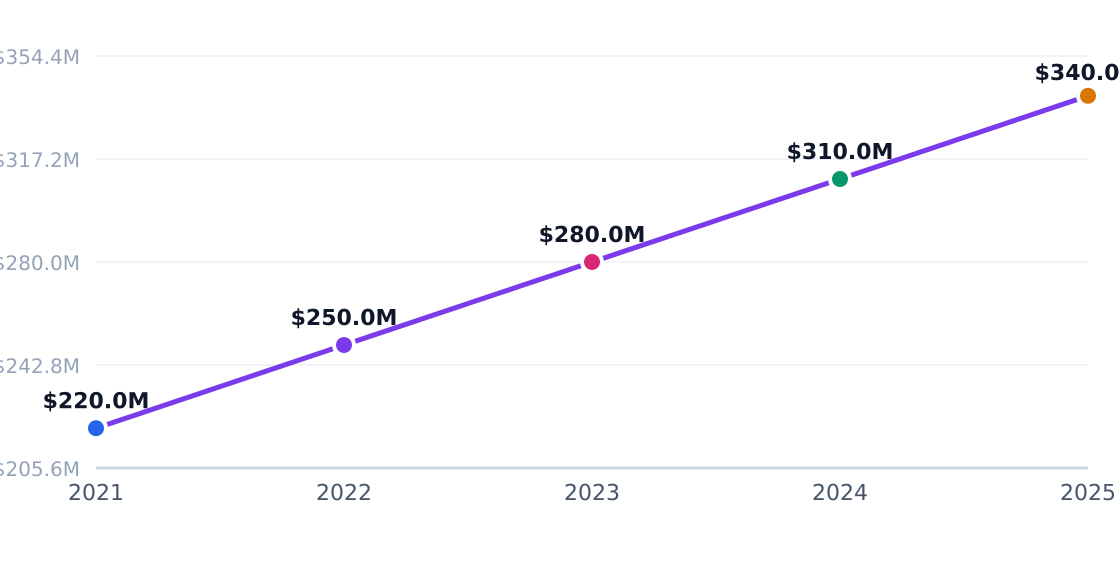
Capital Investment Trend
Annual industry capital flows (PE, VC, capex)
Source: Statista
Strategic Recommendations
- Target leisure travelers through BedandBreakfast.com listings—44% of demand stems from this segment
- Bundle weekend packages with local experiences to capture 18% share of short-break travelers
- Differentiate from Airbnb (6% share) by emphasizing curated hospitality and breakfast services
- Join associations like Select Registry to access premium-rate clientele (2% market share)
- Optimize labor costs—employment growth of 7.6% may squeeze thin 8.1% profit margins
- Leverage fragmentation—4,364 independent operators leave room for local dominance
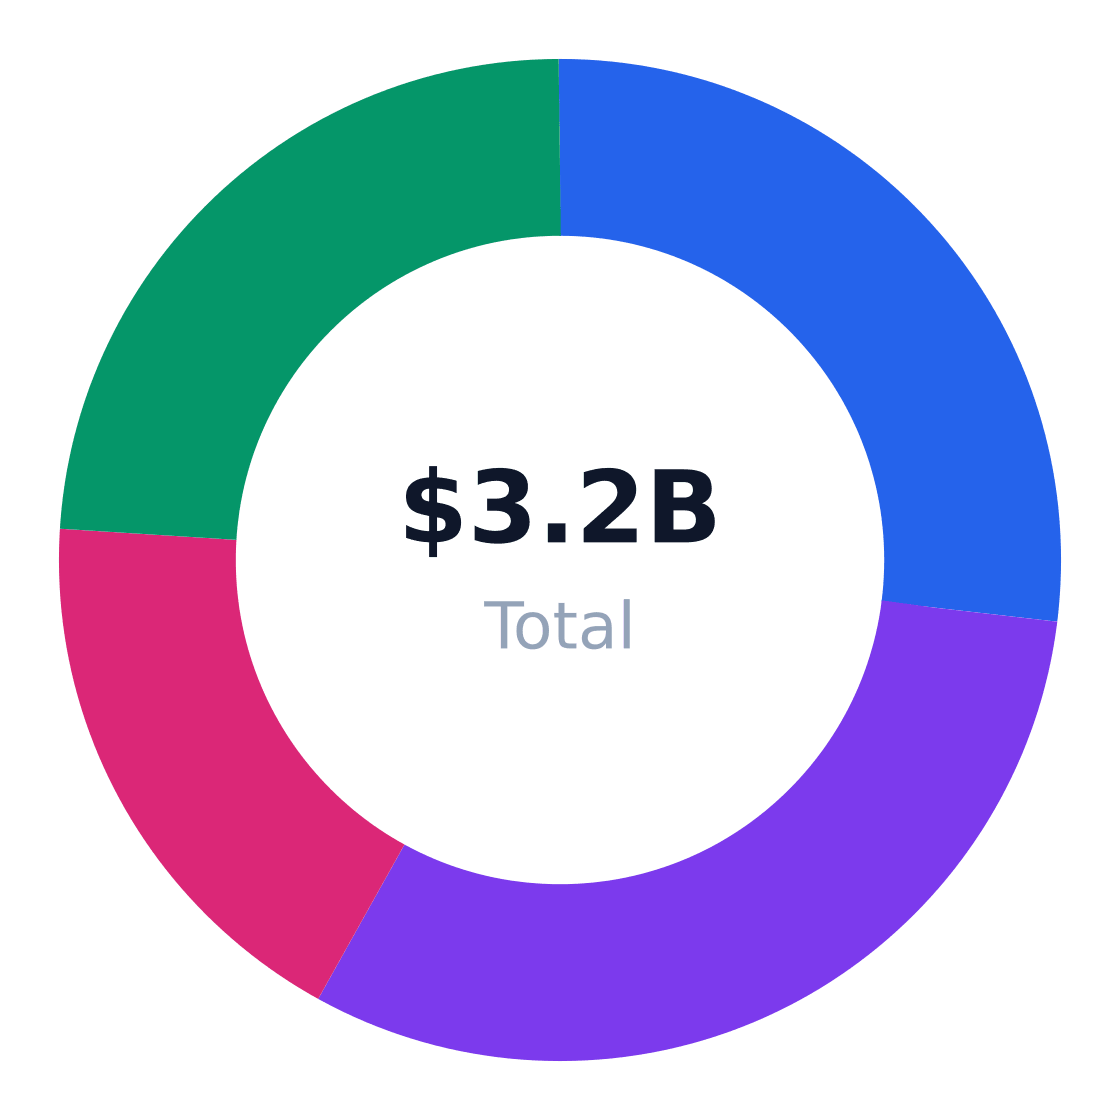
Regional Market Distribution
Revenue share by US region
Source: Statista
Closing Verdict
To compete in this $3.2B fragmented market, operators should:
- Maintain occupancy above 65% to offset rising labor costs
- Allocate 15–20% of revenue to platform fees (Airbnb, VRBO) while building direct bookings
- Target $220+ annual spend per customer in metro areas like Houston’s East Downtown (SAM: $70.9M)
Source: CDS Market Research, Mordor Intelligence
Industry Research & Resources
The following industry databases and research resources support this bed and breakfast industry analysis. Each link opens a specific report or data page (not a generic homepage).
- IBISWorld — ibisworld.com — IBISWorld industry report data for bed and breakfast
- Bed And Breakfast Business — sbdcnet.org — Published industry research for bed and breakfast
- Bed Breakfast Hostel Accommodations Research 43004851 — marketresearch.com — Published industry research for bed and breakfast
- East Downtown Md 2016 Report Final — cdsmr.com — Published industry research for bed and breakfast
- Bed And Breakfast Accommodation Market — mordorintelligence.com — Published industry research for bed and breakfast
Data Sources & Methodology
Market sizing (TAM, SAM, SOM), segmentation, competition, and equipment data come from Perplexity-sourced industry reports and trade publications. Optional U.S. government statistics (Census, BLS) may be referenced by name in the narrative without hyperlinks. TAM reflects the total U.S. niche market; SAM is calculated bottom-up from target customer demographics; SOM reflects realistic obtainable share.
Industry research links: Bed & Breakfast & Hostel Accommodations in the US Market Size, Revenue, Forecasts, Competitor Analysis · ibisworld.com · sbdcnet.org · marketresearch.com · marketresearch.com · cdsmr.com · mordorintelligence.com · marketresearch.com · marketresearch.com · guides.library.cornell.edu · verticaliq.com · verifiedmarketreports.com · bvresources.com · kentleyinsights.com · dojobusiness.com · entrepreneur.com · smartpubtools.com · startupscost.com · littlehotelier.com · apkefeng.com · financialmodelslab.com · 1stformations.co.uk · starterstory.com · jim.com · static1.squarespace.com · dojobusiness.com · prometai.app · startpermit.com · cpdonline.co.uk · sba.gov · ibisworld.com · ibisworld.com · ibisworld.com · coursehero.com · ibisworld.com · statista.com · statista.com · ibisworld.com
Get Your Copy Today
Download Bed And Breakfast Business Plan
Just Fill Up and Print