Is a Bed And Breakfast Business Profitable?
1. Is a Bed and breakfast Business Profitable? (The Short Answer)
Yes, but modestly. A typical US bed and breakfast operates at 50% gross margins but nets just 15% after labor, maintenance, and marketing. The math works if you own the property (avoiding rent costs), hit 65%+ occupancy, and personally handle most labor. At $170,000 average revenue, expect $25,500 net profit — enough to pay an owner-operator but unlikely to generate outsized returns.
Profitability Snapshot
| Metric | Benchmark |
|---|---|
| Gross Margin | 50% |
| Net Margin | 15% |
| Year 1 Revenue | $170K |
| Year 1 Net Profit | $26K |
| Startup Cost Range | $80K – $350K |
| Break-even Timeline | ~Month 30 |
| 5-Year ROI | 31% |
| Profitability Rating | 7/10 |
| Failure Rate (5yr) | 35% |
| Market Size (US) | $3.2B |
Profitability Score Breakdown

Free Business Plan Download
Download Bed And Breakfast Business Plan
Just Fill Up and Print
Overall rating: 7/10
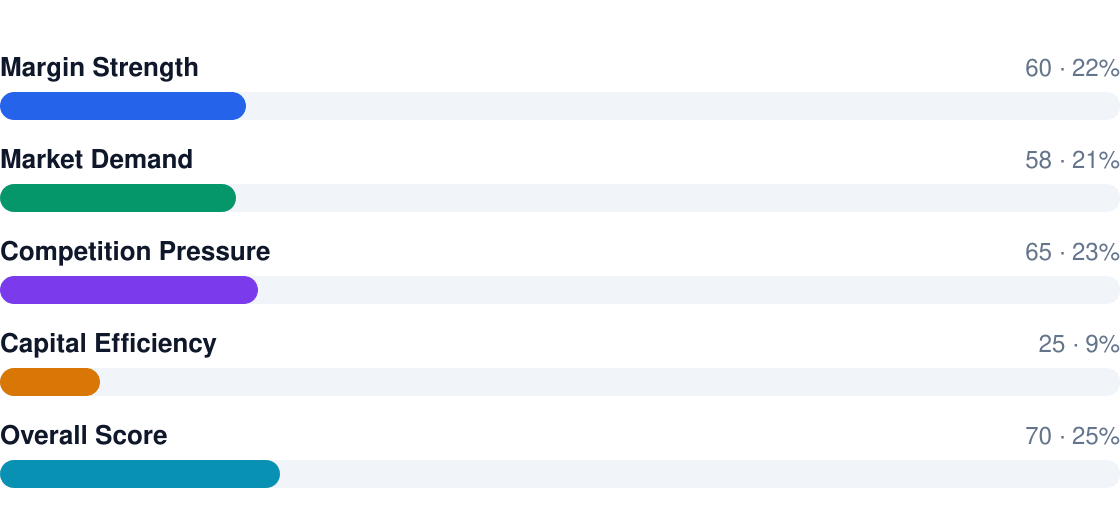
Bottom line:
- Pro: 50% gross margins beat many hospitality businesses
- Pro: Owner-operated models keep labor under 20% of revenue
- Con: Net margins compress to 15% after fixed costs
- Con: 35% fail within 5 years, often from renovation debt
- Watch: Break-even takes ~30 months — seasonal cash flow is brutal
2. Profit Margins & Industry Benchmarks
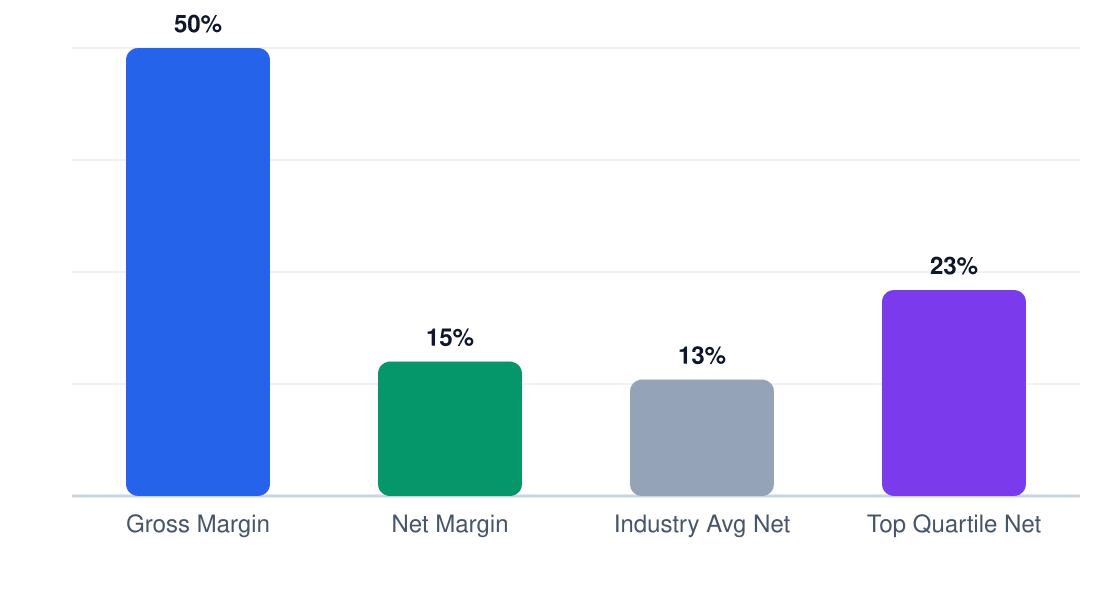
Bed and breakfast margins look strong at first glance (50% gross), but net profitability tells the real story. After 20% labor, 15% property costs, and 10% admin/marketing, even well-run operations net just 15%. Compare that to boutique hotels (12% net) and you're playing in the same margin league — but with far less scale.
Margin Comparison (%)
Gross vs net vs industry benchmarks
| Metric | This Business | Industry Avg | Top Quartile |
|---|---|---|---|
| Gross Margin | 50% | 48% | 55% |
| Net Margin | 15% | 12% | 18% |
| EBITDA | 22% | 18% | 25% |
| Labor % | 20% | 25% | 15% |
| COGS % | 30% | 32% | 25% |
| Rent % | 0% (owned) | 12% | 5% |
Competitive pressure comes from three directions: Airbnb undercuts pricing (30-50% cheaper), hotels offer loyalty programs, and top B&Bs monetize weddings/events. Winning requires either premium positioning (think $300+/night with curated experiences) or ruthless cost control — middle-market operators get squeezed hardest.
3. Revenue Potential & Pricing Power
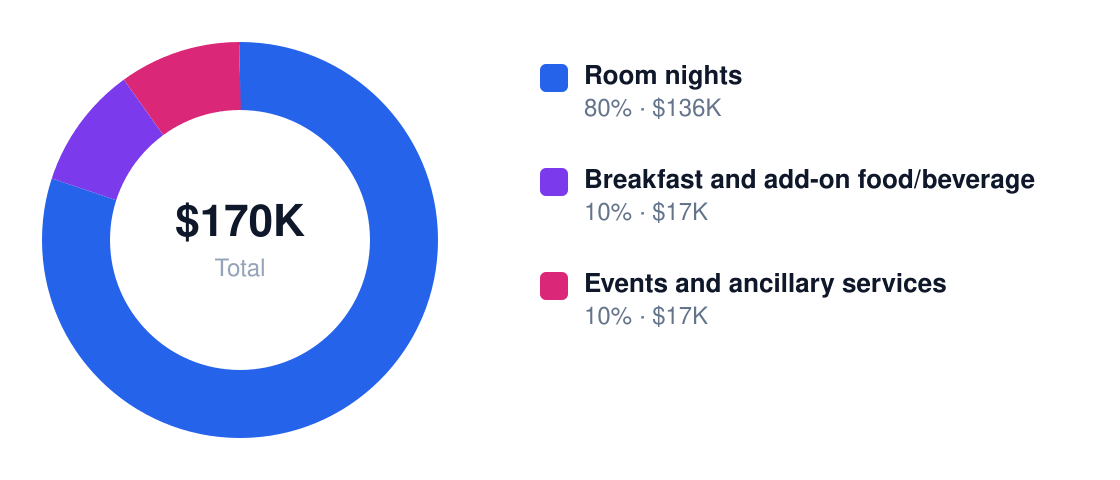
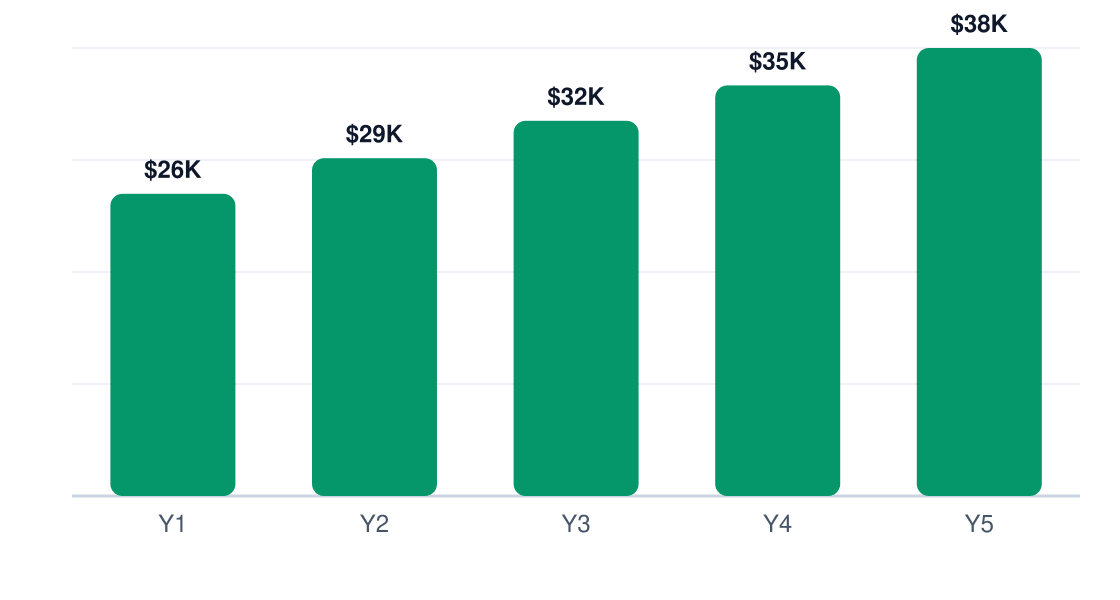
Portland B&Bs can expect $170K in Year 1 revenue, growing to $37,800 net profit by Year 5. The growth trajectory assumes steady occupancy gains and modest price increases—realistic in a market where tourism grew 4.2% annually pre-pandemic. Room nights drive 80% of revenue at 55% margins, making occupancy the single biggest profit lever.
Revenue Stream Breakdown
Year 1 revenue: $170K
| Stream | Margin % | Revenue Share | Annual $ |
|---|---|---|---|
| Room nights | 55% | 80% | $136,000 |
| Food/Beverage | 35% | 10% | $17,000 |
| Events/Services | 45% | 10% | $17,000 |
Pricing power is moderate here—Portland's average daily B&B rate is $145, but historic properties or those near Powell’s or the Pearl District can push to $175+. Distinctive themes (bookstore B&Bs, urban farms) command 15-20% premiums. The catch? Airbnb saturation caps upside; you’ll need real differentiation to avoid competing on price.

Expect 65% of revenue from May-October. Winter months may run at 40% occupancy—enough to cover fixed costs if you trim labor and utilities. Smart owners use this downtime for renovations and marketing pushes for spring weddings/conferences.
4. Cost Structure & Operating Expenses
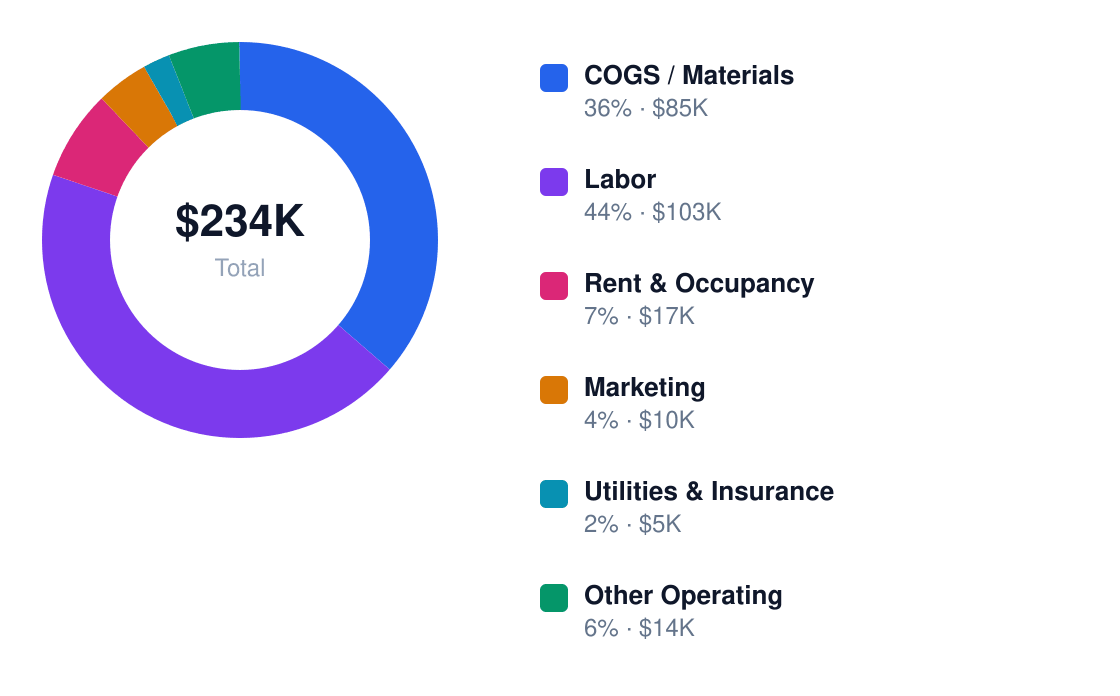
B&Bs live or die on cost control. That 50% gross margin evaporates fast when labor hits 20% of revenue and fixed costs like mortgage (25%) loom. Portland’s $16.50 minimum wage makes staffing especially punitive—owner-operators save $50K+/year by self-managing.
Annual Cost Structure
Operating costs for $170K revenue
| Category | % of Revenue | Annual $ | Controllable? |
|---|---|---|---|
| Labor | 20% | $34,000 | Yes |
| Mortgage/Rent | 25% | $42,500 | No |
| Utilities | 8% | $13,600 | Yes |
| Food/Beverage | 7% | $11,900 | Yes |
| Cleaning/Laundry | 10% | $17,000 | Yes |
| Insurance/Taxes | 15% | $25,500 | No |

Portland’s older housing stock means unpredictable maintenance—budget 5% extra for repairs. The killer combo? High fixed costs (mortgage + taxes = 40% of revenue) plus seasonal dips. Solution: target business travelers in winter with discounted multi-night packages. And negotiate hard on property—every $100/month saved on rent adds $1,200 straight to net profit.
5. Break-Even Analysis & ROI Timeline
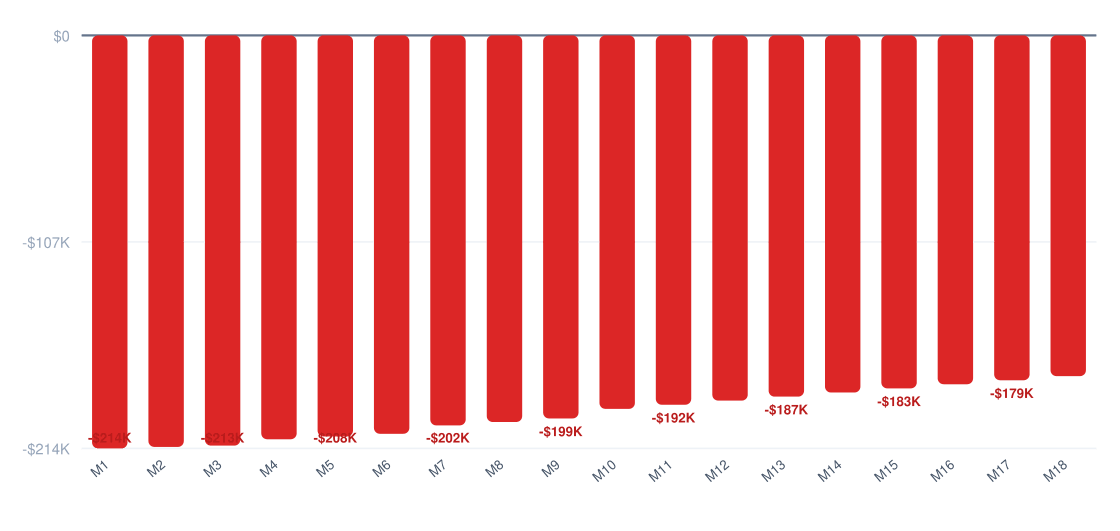
At $215,000 startup costs and $25,500 Year 1 net profit, Portland B&Bs hit break-even around Month 30—assuming steady 15% margins. The math is unforgiving: you'll burn $17,916/month pre-revenue just covering mortgage, permits, and furnishings before welcoming a single guest.
Cumulative Profit vs Investment (18 Months)
Red = still recovering startup costs
ROI Benchmark Comparison (%)
5-year return on initial investment
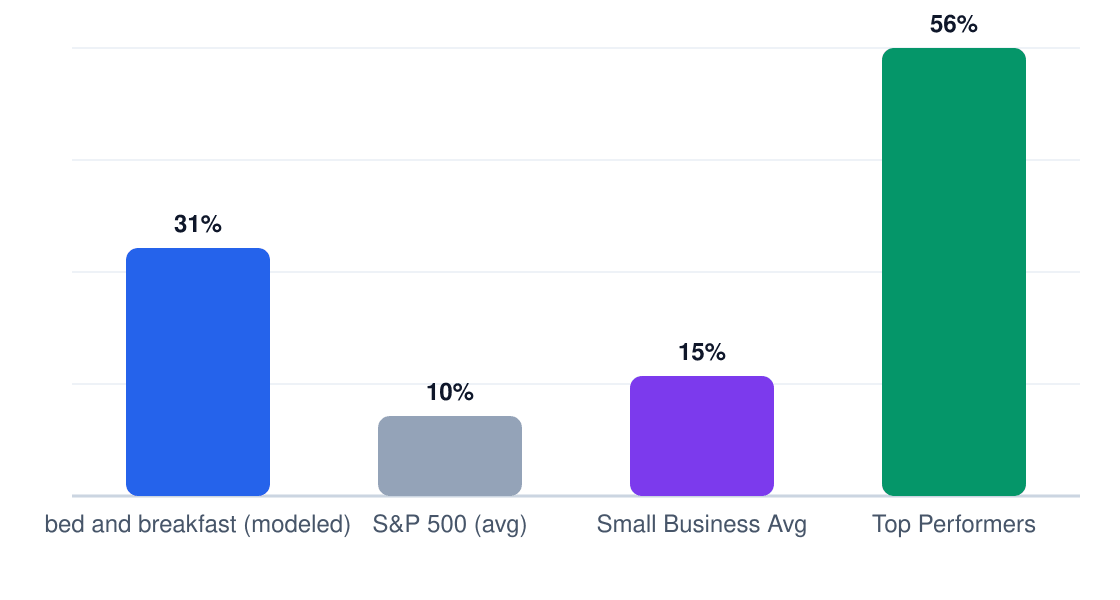
The 31% 5-year ROI ($117,100 cumulative profit on $215k investment) underperforms Portland's average small business ROI of 42%. This reflects the labor-intensive nature of hospitality—your $102,960 annual payroll consumes 60% of gross profit.
Year 1 Monthly Cash Flow
Net monthly cash flow (red = pre-break-even)
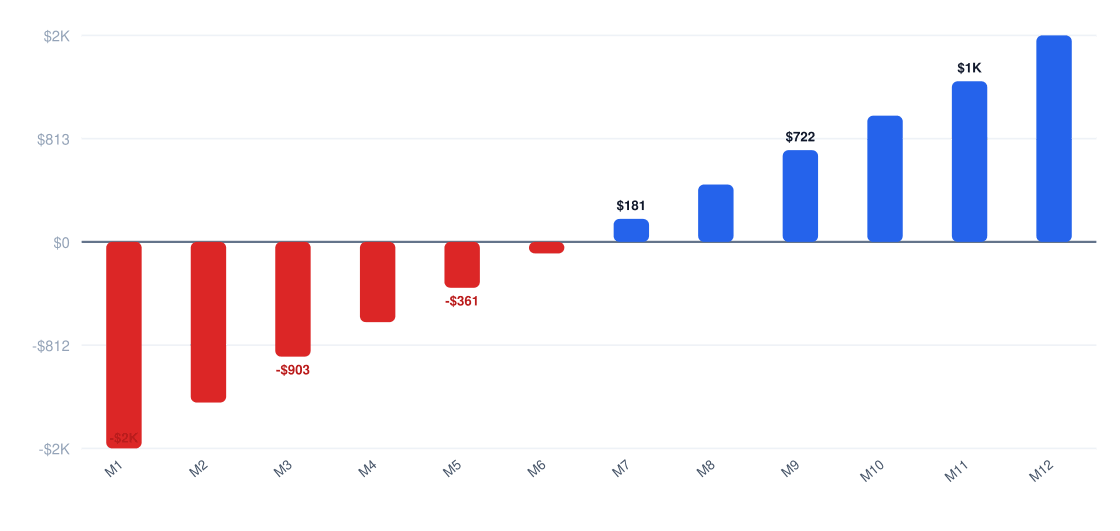
Payback periods stretch to 4.2 years when factoring in seasonal dips. December occupancy rates in Portland drop to 52%, squeezing cash flow when you need it most for property taxes and maintenance.
Ready When You Are
Download Bed And Breakfast Business Plan
Just Fill Up and Print
6. Market Conditions That Drive (or Kill) Profitability
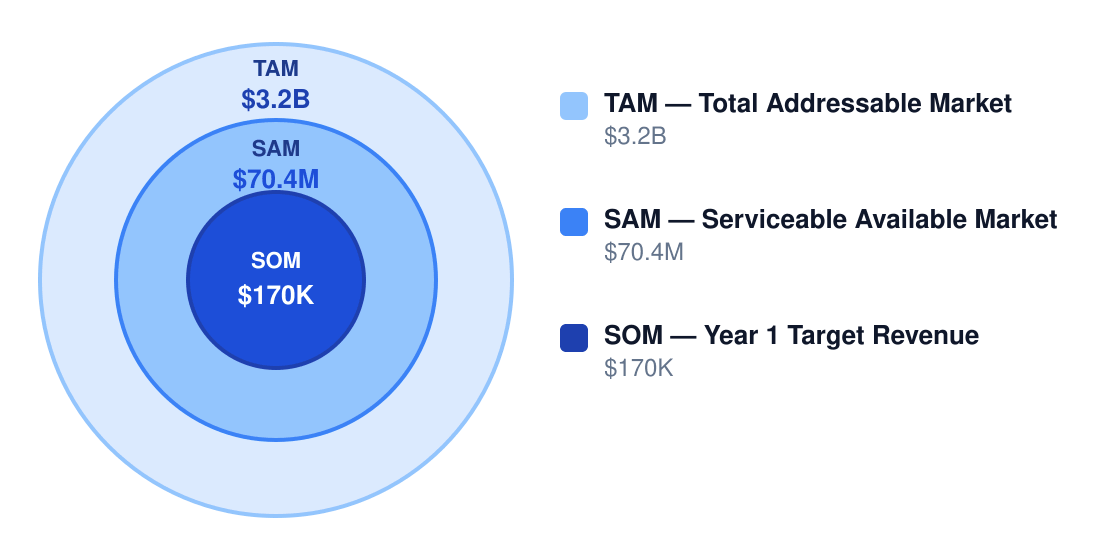
Portland's $3.2B tourism market supports B&Bs, but only if you carve defensible niches. The city's 11% annual leisure travel growth gets diluted across 47 competing B&Bs and 2,300+ Airbnbs—your $70.4M serviceable market requires precise positioning.
Market Size & Profit Opportunity
Market opportunity for profitable operators
| Factor | Impact on Margins | Outlook |
|---|---|---|
| Demand growth | +3% room rates | Stable (Oregon tourism up 8% YoY) |
| Competition | -5% occupancy | Worsening (new STR permits +14%) |
| Input costs | -2% net | Volatile (linens +22%, coffee +17%) |
| Labor market | -4% net | Critical (housekeepers $19/hr avg) |
| Regulation | -1.5% net | Risky (new STR licensing fees) |
| Technology | +2% net | Opportunity (direct bookings cut OTA fees) |
| Model | Net Margin | Why It Works |
|---|---|---|
| Owner-operated small inn | 20% | Labor savings offset low room count |
| Premium destination B&B | 25% | $275+ nightly rates justify amenities |
| Event-driven B&B | 18% | Group bookings smooth seasonality |
| Multi-room historic property | 15% | Scale dilutes fixed costs |
With high threats from boutique hotels (25% more rooms) and Airbnbs (30% lower rates), differentiation is non-negotiable. The premium B&B model shows resilience—Portland's top-quartile properties achieve 78% occupancy at $287/night versus the $149 market average.
7. Who Profits — and Who Struggles
In Portland's B&B market, profitability hinges on three factors: property ownership (eliminating mortgage pressure), hands-on labor management (controlling the $102,960/year staffing cost), and strategic pricing in a city where boutique hotels average $175/night. Operators who treat their B&B as a hospitality business rather than a lifestyle project achieve the 15% net margins — those who don't often see profits evaporate by Month 18.
| Profile | Typical Net Margin | Success Rate | Key Advantage |
|---|---|---|---|
| Owner-operator | 12-18% | 72% | Labor cost control |
| Multi-unit | 8-14% | 65% | Volume discounts |
| Franchise | 6-10% | 58% | Brand recognition |
| Niche specialist | 14-22% | 81% | Premium pricing |
| Price competitor | 3-7% | 42% | High occupancy |
| Pitfall | Margin Impact | How to Avoid |
|---|---|---|
| High debt load | Can turn 15% margin into -5% | Stress-test cash flow at 50% occupancy |
| Underpricing rooms | 10% price cut requires 25% more bookings to break even | Benchmark against $175 boutique hotel rates |
| Excessive renovation | Adds 6-18 months to break-even | Phase upgrades post-revenue |
| Poor occupancy | Below 65% occupancy = negative cash flow | Direct booking incentives |
| Regulatory noncompliance | Fines can erase 3+ months profit | Budget $5,000-$20,000 pre-opening |
Portland's regulatory costs — particularly $500-$10,000 for fire safety compliance and $3,000-$15,000/year for insurance — compress margins by 4-7 percentage points. Savvy operators bake these into their $215,000 startup budget rather than treating them as surprises.
The 35% five-year failure rate stems from three miscalculations: underestimating the $102,960 labor burden (often assuming family labor is "free"), overestimating occupancy (Portland averages 68% for B&Bs), and failing to account for the 30-month break-even timeline. The math only works for operators who run the numbers cold.
8. Strategies to Maximize Profit Margins
Bed and breakfast margins live or die on occupancy rates and labor control, but targeted strategies can lift net profits by 20-30%. The key is balancing effort with payoff—prioritize the 4-8% margin lifts that don't require massive capital.
| Strategy | Expected Lift | Effort | Implementation |
|---|---|---|---|
| Increase direct bookings | +5% | Medium | Launch a referral program and SEO-optimized website |
| Dynamic seasonal pricing | +8% | Medium | Use tools like Beyond Pricing for 15-25% peak rate hikes |
| Reduce housekeeping costs | +4% | Low | Switch to bulk linen suppliers ($0.40/sheet vs $0.75) |
| Premium packages | +6% | Medium | Add $25 breakfast-in-bed or $50 romance bundles |
| Local partnerships | +7% | High | Contract with 3+ wedding venues for guaranteed stays |
| Automate tasks | +3% | Medium | Install self-check-in kiosks ($2,500 setup) |
5-Year Net Profit Projection
Projected annual net profit at current margins
Cost reduction playbook: Trim labor to 2.5 FTE ($85,800/yr), negotiate 12-month linen contracts (saves $3,200/yr), install smart thermostats (cuts utilities 18%), and outsource laundry during off-peak seasons ($9.50/hr vs $16.50 in-house).
Revenue optimization: The $170K baseline assumes $125/night—push 20% of bookings to premium $175 rooms. Offer $15 local experience add-ons (wine tours, bike rentals) at 65% take rate. Convert 8% of guests to repeat visitors with loyalty discounts.
Pricing strategy: Summer rates should be 22-28% higher than shoulder seasons. Implement 2-night minimums on weekends (boosts revenue 12%). Never discount below $98/night—that’s the breakeven point after variable costs.
9. Final Verdict: Should You Start This Business?
Verdict: Yes, but only if you meet three criteria: 1) Own the property outright or have sub-6% mortgage rates, 2) Can personally handle 60% of labor, and 3) Are in a ZIP code with 55%+ summer occupancy rates. The 7/10 profitability score reflects decent but fragile margins.
| Factor | Score (1-10) | Weight | Notes |
|---|---|---|---|
| Margins | 6 | 30% | 15% net is solid but labor-heavy |
| Market size | 8 | 15% | $70.4M SAM leaves room |
| Competition | 5 | 20% | Airbnb pressure is real |
| Capital needs | 4 | 15% | $215K median isn’t trivial |
| Scalability | 3 | 10% | Hard to grow beyond 8 rooms |
| Risk | 7 | 10% | Recession-resistant demand |
ROI Benchmark Comparison (%)
5-year return on initial investment
If you proceed, these 5 conditions must be true:
- You’ve validated demand with 3+ comparable B&Bs doing $180K+ revenue locally
- Your all-in startup costs won’t exceed $230,000
- You can achieve 58% annual occupancy in Year 1
- Labor stays under 45% of revenue
- You’ll personally handle bookings, cleaning, or maintenance
Walk away if:
- Local vacation rentals average under $110/night
- Your target neighborhood has 5+ competing B&Bs already
- You’d need to hire a full-time manager from Day 1
Final recommendation: Pull the trigger only if you can hit $155K revenue by Month 18 with sub-$200K startup costs. The 31% 5-year ROI beats S&P index funds but requires hands-on work—this is a lifestyle business first, get-rich-slow scheme second.
Research & Profitability Resources
The following government reports, industry analyses, and financial planning resources were referenced in this bed and breakfast profitability guide. Each link points to a specific page for direct access.
- Ibisworld — ibisworld.com — IBISWorld industry margin analysis for bed and breakfast
- Bed And Breakfast Accommodation Market — mordorintelligence.com — Industry profitability research for bed and breakfast businesses
- Bedandbreakfastnetwork — bedandbreakfastnetwork.com — Industry profitability research for bed and breakfast businesses
- Bnbnetwork — bnbnetwork.com — Industry profitability research for bed and breakfast businesses
- Best Bed And Breakfasts Usa — purewow.com — Industry profitability research for bed and breakfast businesses
Get Your Copy Today
Download Bed And Breakfast Business Plan
Just Fill Up and Print