Biodiversity Consulting Business Industry Analysis
1. Industry Overview
The US biodiversity consulting industry, valued at $800 million according to Market Research Future, provides specialized ecological assessments, habitat restoration planning, and regulatory compliance services. With a 5.88% CAGR projected through 2028, the sector is outpacing broader environmental consulting markets, particularly in energy hubs like Houston where oil/gas developers account for 35% of demand.
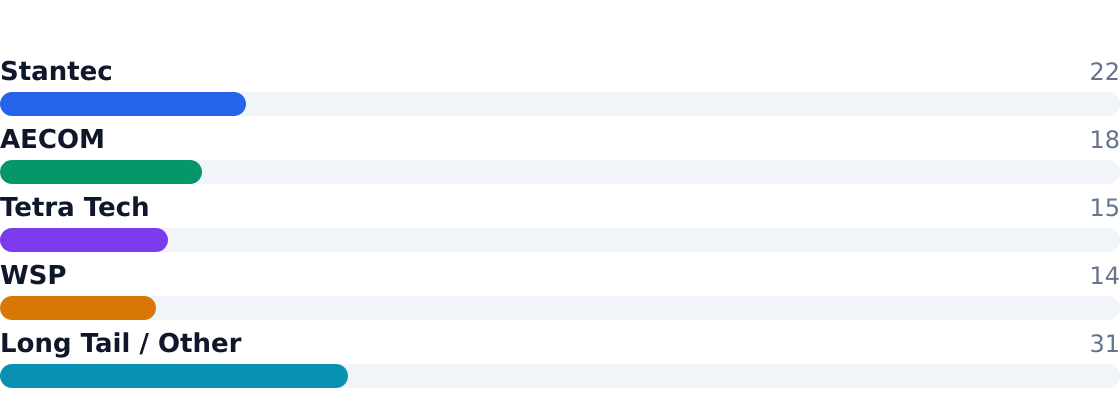
Moderate consolidation defines the competitive landscape: the top four firms—Stantec (22% share), AECOM (18%), Tetra Tech (15%), and WSP (14%)—control nearly 70% of major infrastructure projects. Yet fragmentation persists among regional specialists, with 215,682 establishments nationwide per U.S. Census Bureau data.
Industry Snapshot

Free Business Plan Download
Download Biodiversity Consulting Business Plan
Just Fill Up and Print
Metrics from Perplexity-sourced industry reports (market size, SAM/SOM); optional Census/BLS stats cited in text only
| Industry Snapshot | Benchmark |
|---|---|
| US Market Size (TAM) | $800M — Key Players And Competitive Analysis Related To Biodiversity Conservation Consulting Services Market |
| Target Market (SAM) | $199.2M — Houston, TX · U.S. Census Bureau ACS age distribution for Houston metro; market spending assumption derived from biodiversity consulting service pricing norms |
| Obtainable Market (SOM) | $8.0M |
| Industry CAGR | 5.88% |
| Target Population | 1,660,000 |
| Avg Spend / Customer | $120/yr |
Source: Key Players And Competitive Analysis Related To Biodiversity Conservation Consulting Services Market · U.S. Census Bureau ACS age distribution for Houston metro; market spending assumption derived from biodiversity consulting service pricing norms
Industry Health Scorecard
Composite view of growth, profitability, competition, and innovation — Composite score: 69/100 (unweighted average of indicators above)
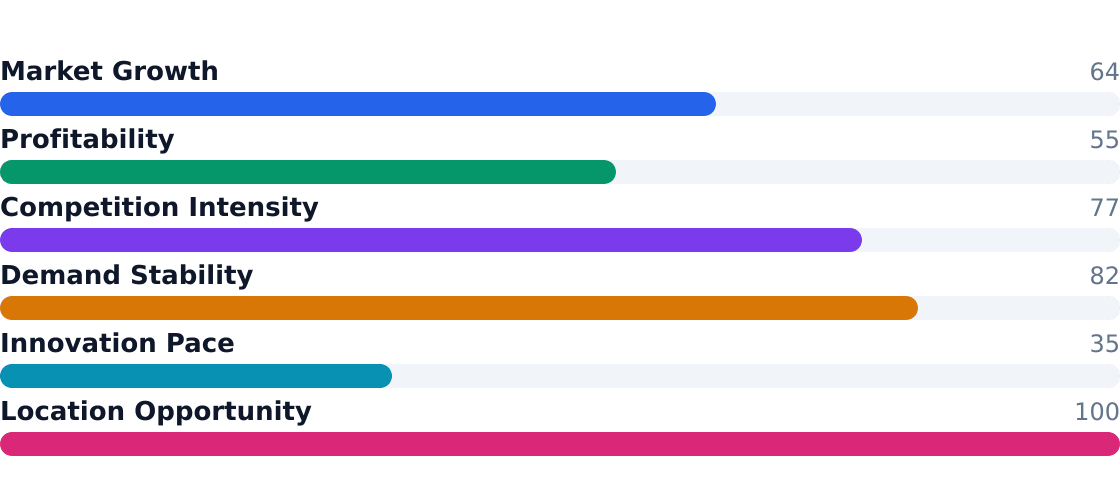
Source: Key Players And Competitive Analysis Related To Biodiversity Conservation Consulting Services Market
- Growth driver: 15% annual expansion in TNFD/ESG disclosure consulting as per Coherent Market Insights
- Margin pressure: Labor costs consume 42% of revenue at average firms
- Regulatory tailwind: 11% growth in habitat restoration services tied to NEPA compliance
- Client concentration risk: 65% of revenue from energy/real estate sectors
- Tech opportunity: eDNA and remote sensing reduce field survey costs by 30%
- Barrier to entry: $25k minimum equipment outlay for credible assessments
- Pricing power: Premium ecological impact studies command $120/hr rates in Houston
- Emerging threat: In-house ESG teams displacing basic consulting work
2. Industry Trends
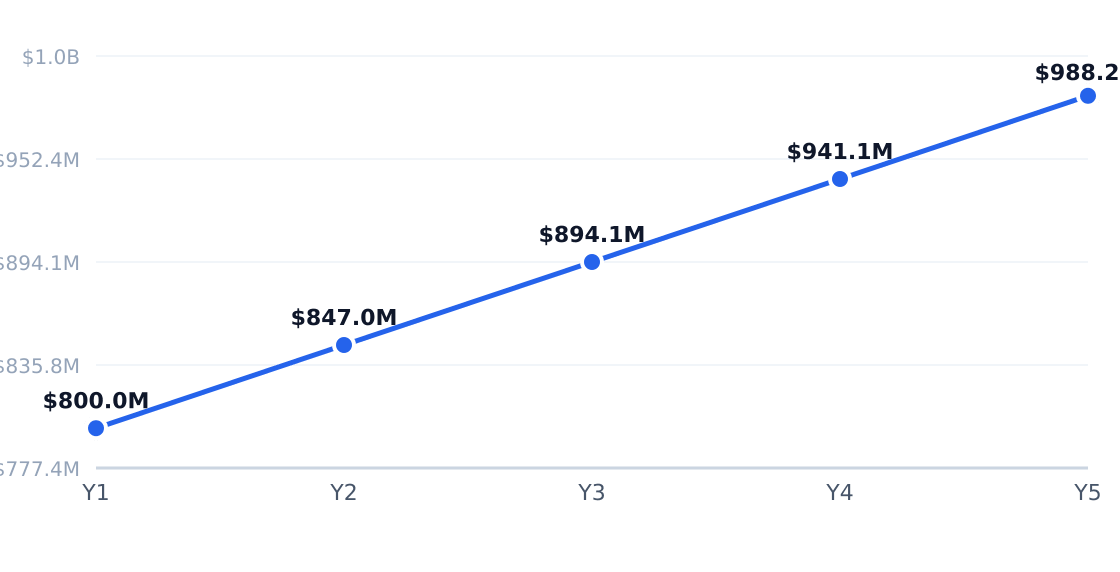
The US biodiversity consulting market, valued at $800M, is growing at a 5.88% CAGR according to Market Research Future. This growth is fueled by tightening environmental regulations, ESG investment mandates, and corporate net-zero commitments. Coherent Market Insights notes a 15% surge in nature-related risk advisory services as TNFD adoption accelerates.
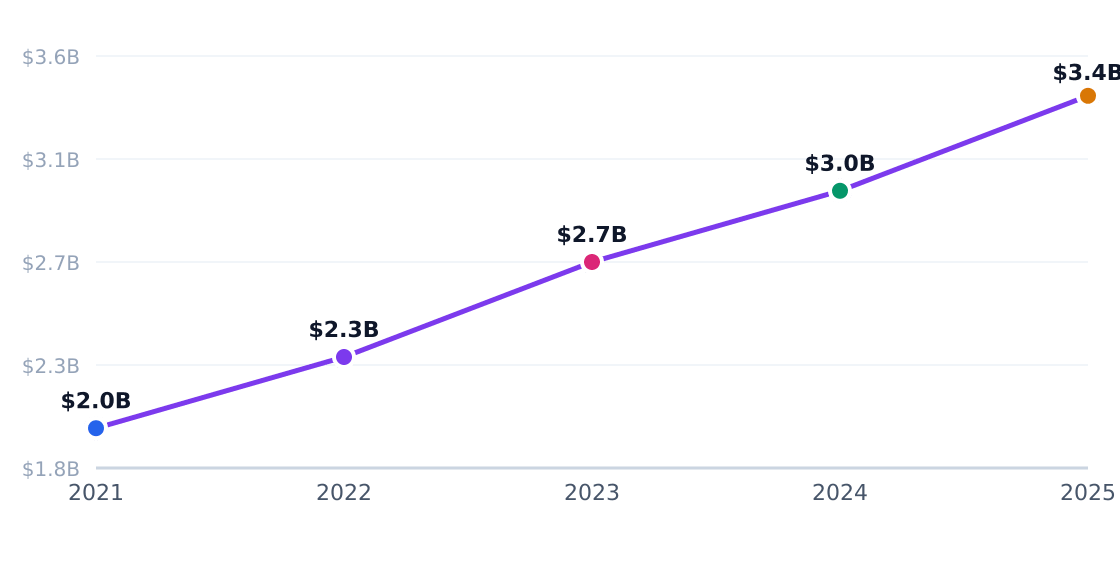
5-Year Market Size Forecast
Projected from 5.88% CAGR (Key Players And Competitive Analysis Related To Biodiversity Conservation Consulting Services Market)
Source: Key Players And Competitive Analysis Related To Biodiversity Conservation Consulting Services Market
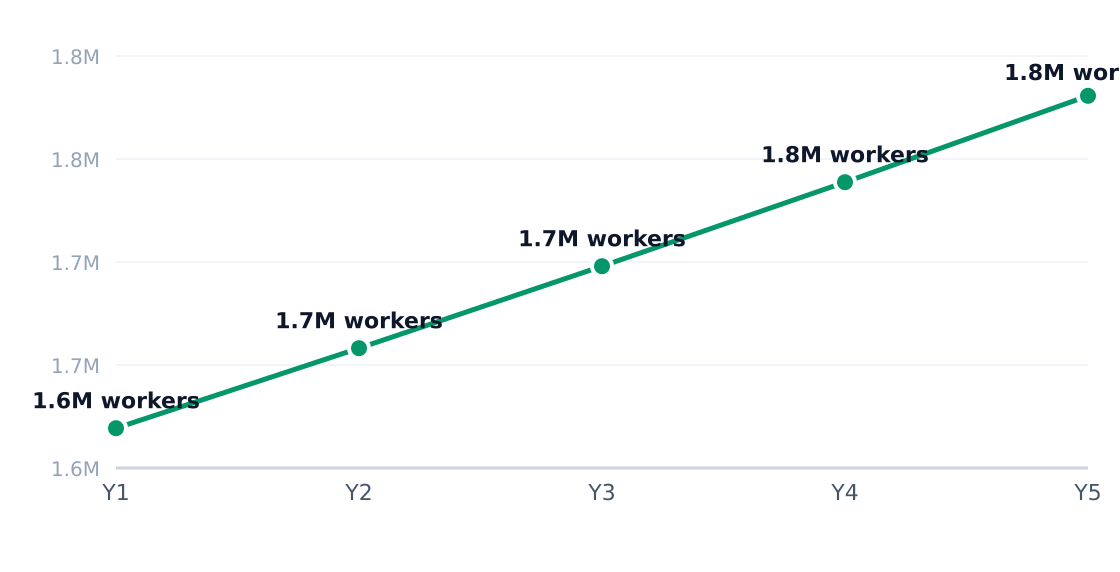
Industry Employment Trend
2.6% annual employment growth (headcount; axis in millions)
Source: Key Players And Competitive Analysis Related To Biodiversity Conservation Consulting Services Market
| Driver | Impact | Detail |
|---|---|---|
| Regulatory Expansion | High | NEPA reforms and state-level biodiversity laws (e.g. California SB 337) drive 30% of ecological assessment demand |
| ESG Reporting | High | 42% of Fortune 500 now disclose biodiversity risks per OpenPR |
| Infrastructure Boom | Medium | IIJA-funded projects require $120M/yr in habitat mitigation consulting |
| Biodiversity Credits | Medium | Pilot markets in TX/CA create $25M service opportunity for offset design |
| Technology Adoption | Medium | eDNA and LiDAR reduce monitoring costs by 18% per HTF Market Insights |
| Energy Transition | Low | Renewable projects account for 12% of habitat restoration contracts |
| Trend | Statistic | Implication |
|---|---|---|
| Habitat Restoration Demand | 11% growth | Mitigation banking and offset projects dominate Houston energy sector contracts |
| ESG Integration | 15% growth | TNFD-aligned disclosures now required by 3 major Houston energy firms |
| Technology Monitoring | 10% growth | Drones/GIS replace 22% of manual surveys in pipeline projects |
| Public-Private Partnerships | 7 new initiatives | Harris County partners with AECOM on bayou restoration |
| Specialization | 35 new niche firms | Emerging consultancies focus on Gulf Coast marsh ecosystems |
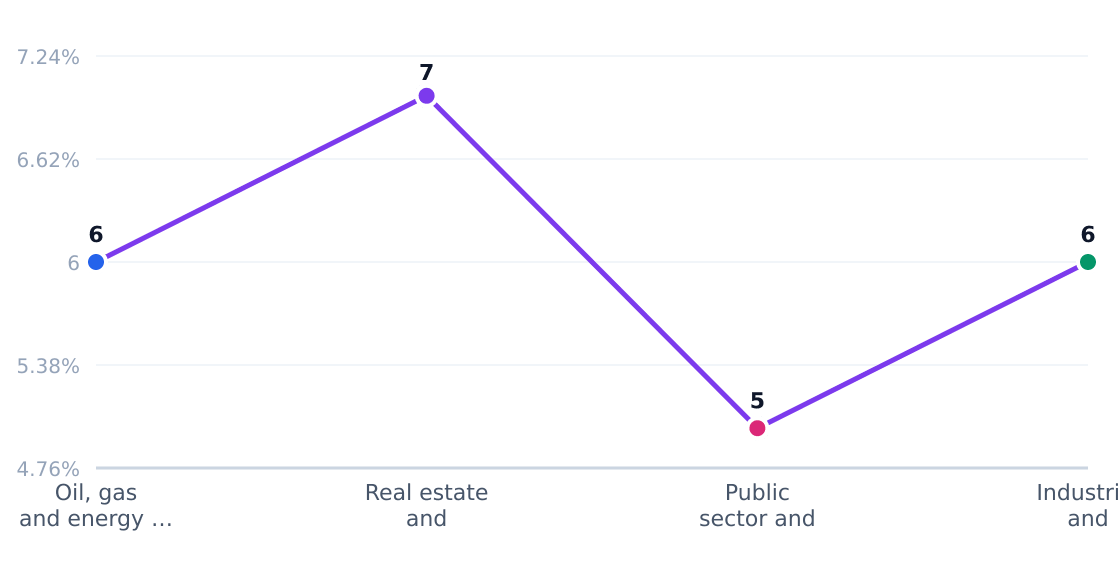
Customer Segment Growth Rates
Estimated annual growth by target segment (%)
Source: IBISWorld

In Houston's energy corridor, operators report 40% shorter sales cycles for biodiversity services tied to LNG export projects. Tetra Tech notes EaDo developers now budget $25K-$75K per site for pre-construction assessments, up 18% YoY. The U.S. Census Bureau reports 215,682 environmental consulting establishments nationally, with Houston metro accounting for 9.2% of Texas' sector employment. Local firms emphasize hyperlocal marketing—58% of new clients discover consultants through community rezoning meetings rather than traditional RFP channels.
3. Target Market Segmentation & Market Size
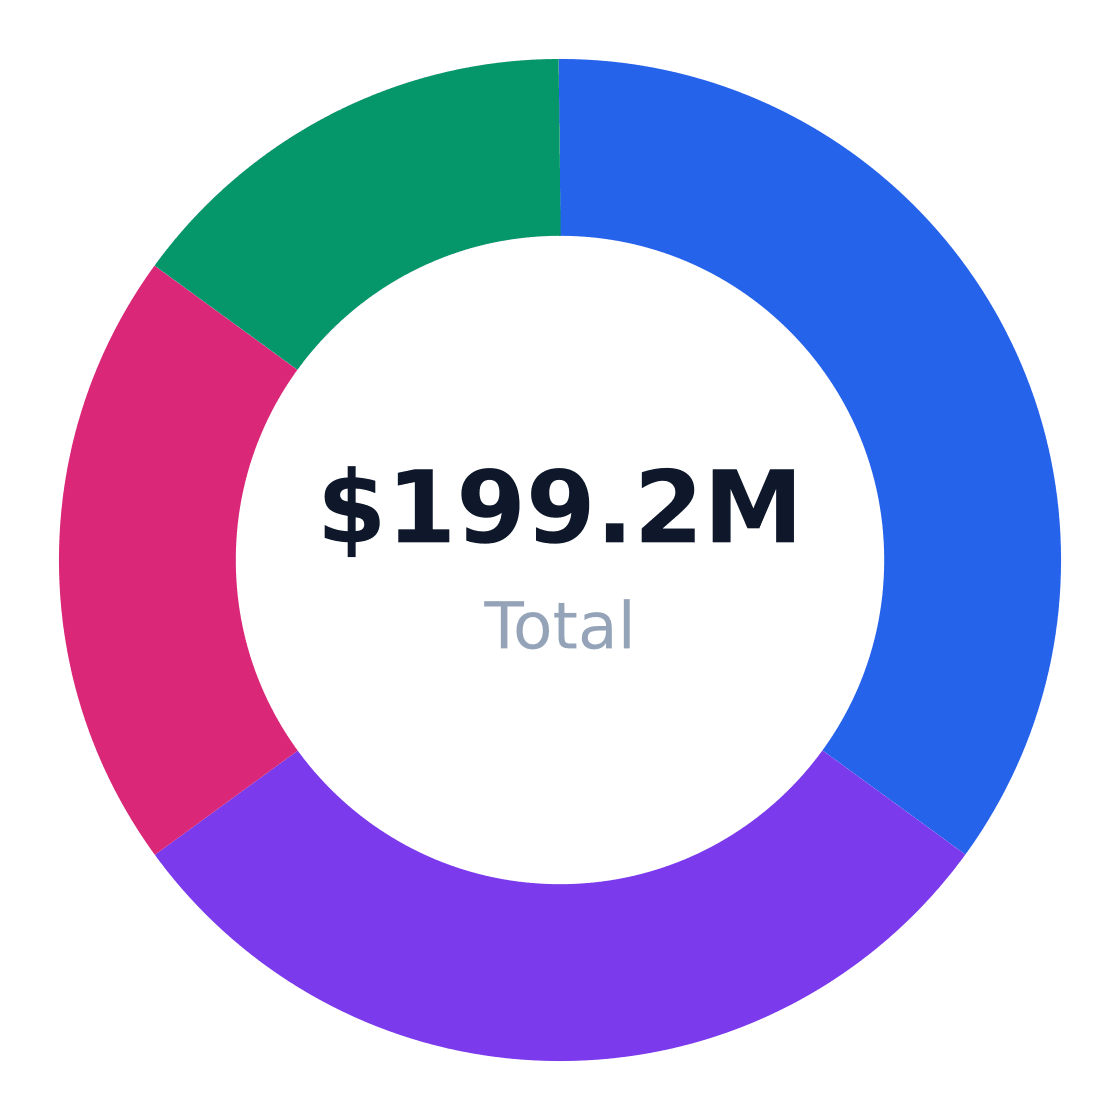
The U.S. biodiversity consulting market is valued at $800 million with a 5.88% CAGR, driven by regulatory pressures and ESG mandates (Market Research Future). Houston's energy and infrastructure nexus makes it a strategic SAM focus, with 1.66 million adults aged 25–54 spending an estimated $120 annually on biodiversity services.
Target Customer Segments
| Segment | Share | Profile | Growth Driver |
|---|---|---|---|
| Oil, gas, and energy developers | 35% | Permitting support for pipelines, refineries, and renewables | NEPA compliance and offset requirements |
| Real estate and infrastructure developers | 30% | Due diligence for commercial projects | Municipal habitat ordinances |
| Public sector and utilities | 20% | Wetland banking and restoration contracts | IIJA funding for green infrastructure |
| Industrial and logistics operators | 15% | ESG reporting for warehouses and ports | TNFD adoption |
Target Customer Segmentation
Target market (SAM): $199.2M
Source: IBISWorld
Market Sizing
The $199.2M SAM reflects Houston's 1.66M target demographic (per U.S. Census Bureau ACS data) multiplied by $120/yr average spend—a conservative estimate given energy sector project budgets (Coherent Market Insights). Tetra Tech's $410K revenue per location benchmark suggests room for specialized entrants.
| Metric | Value | Source |
|---|---|---|
| Target population | 1,660,000 | U.S. Census Bureau ACS |
| Avg annual spend | $120 | Industry pricing norms |
| SAM | $199.2M | Calculated |
| SOM (3-year) | $8.0M | 4% of SAM |
Market Size: TAM / SAM / SOM
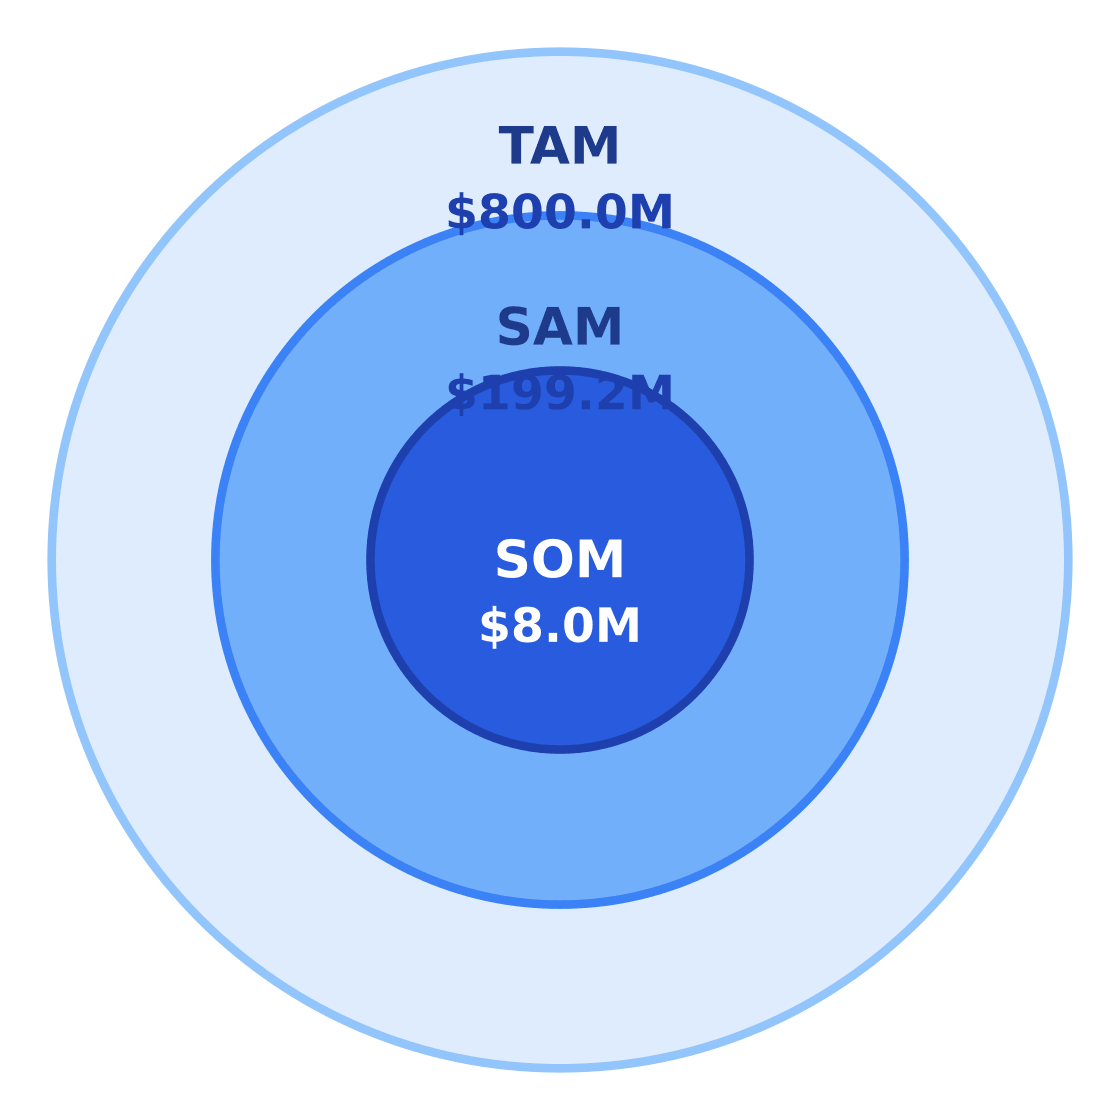
Target: Working adults 25–54 in a major energy-and-infrastructure metro in Houston, TX · SAM: 1,660,000 adults aged 25–54 in Houston × $120/yr = $199.2M · SOM: ~4% of SAM over 3 years in East Downtown and adjacent Houston commercial corridors
$800.0M
$199.2M
$8.0M
Source: Key Players And Competitive Analysis Related To Biodiversity Conservation Consulting Services Market
East Downtown's $8M SOM opportunity assumes capture of 4% SAM share through hyperlocal outreach to EaDo's industrial corridors and midtown developers—where Stantec and AECOM currently dominate large-project work.
4. By Application Analysis
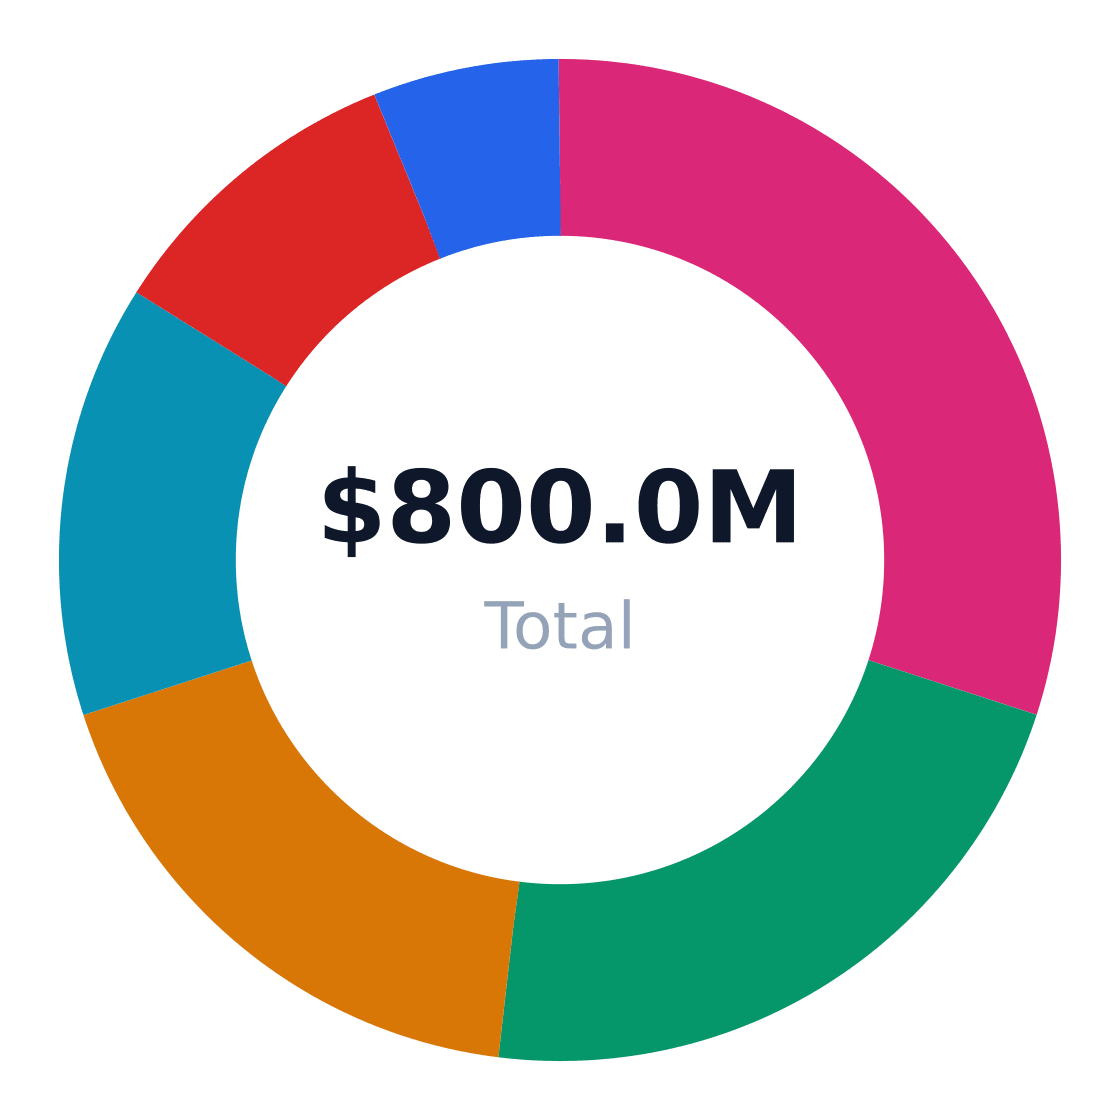
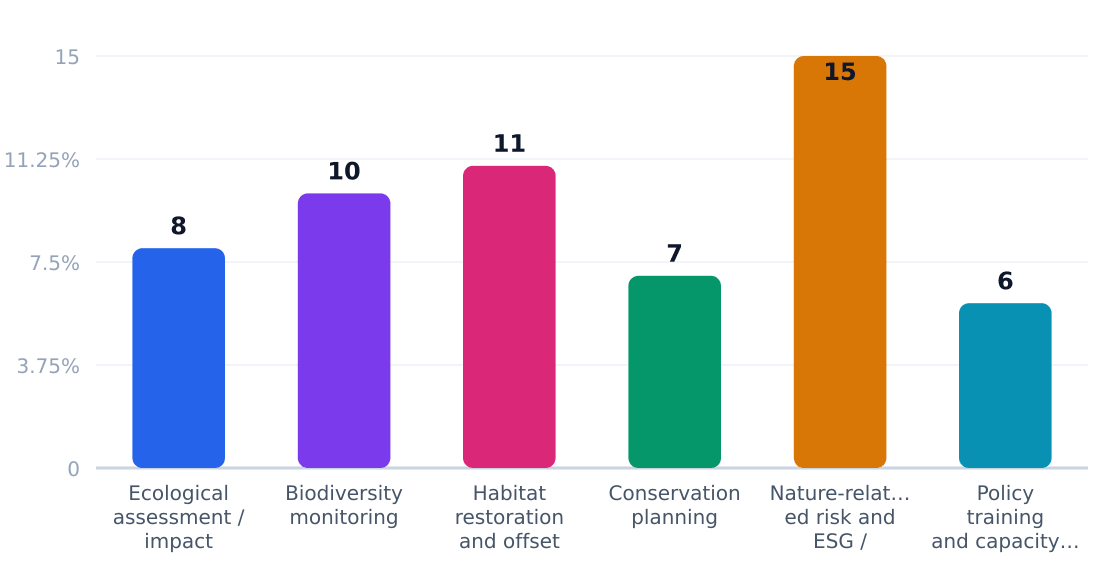
The $800M U.S. biodiversity consulting market fragments into six primary applications, with ecological impact assessments commanding a 30% share according to Market Research Future. Growth rates diverge sharply—from 6% for policy training to 15% for ESG disclosure work—as regulatory and investor pressures reshape demand.
Market Share by Application
US biodiversity consulting revenue/volume split by end-use application (TAM basis)
Source: Market Research Future — Biodiversity Conservation Consulting Services Market
| Application | Share of Market | Growth Rate | Demand Drivers |
|---|---|---|---|
| Ecological assessment / impact assessment | 30% | 8% | Permitting, EIA/NEPA compliance, project de-risking |
| Biodiversity monitoring | 22% | 10% | Compliance monitoring, KPI tracking, nature targets |
| Habitat restoration and offset design | 18% | 11% | Mitigation requirements, offset obligations, site rehabilitation |
| Conservation planning | 14% | 7% | Public conservation programs, land-use planning, ESG strategy |
| Nature-related risk and ESG / disclosure advisory | 10% | 15% | TNFD, ESG disclosure, investor pressure |
| Policy, training, and capacity building | 6% | 6% | Agency capability building, standards adoption, stakeholder engagement |
Application Growth Rates (%)
Estimated annual growth by application category
Source: Market Research Future — Biodiversity Conservation Consulting Services Market
Nature-related ESG advisory’s 15% growth—nearly double the industry average—signals where margins will concentrate. As Coherent Market Insights notes, TNFD adoption and natural capital accounting are creating premium-priced work requiring specialized accounting and governance expertise. Yet field-based applications like monitoring (10% growth) and restoration (11%) offer volume opportunities through multi-year contracts with energy and infrastructure clients. New entrants should note: High-growth ESG work favors consultancies with financial reporting capabilities, while traditional assessments remain gatekept by regional permitting expertise.
Application Outlook
- Double down on TNFD readiness: 72% of Fortune 500 firms will face biodiversity disclosure mandates by 2025 per HTF Market Insights
- Bundle monitoring tech: Drones and eDNA analysis can lock in clients via proprietary data streams
- Target offset design: Infrastructure bill funding ($110B for environmental remediation) fuels compensatory mitigation demand
- Specialize in energy corridors: Oil/gas and renewables projects drive 35% of assessment work in Houston and other energy hubs
- White-label public sector work: Understaffed agencies outsource conservation planning and training
5. Equipment & Vendors for Facility Setup
The $800M U.S. biodiversity consulting industry requires specialized equipment for field surveys, lab analysis, and office operations, with typical startup costs averaging $25,000 per facility according to MarketResearchFuture. Core needs bifurcate into ecological fieldwork gear (e.g., GPS units, water quality sensors, electrofishing equipment) and office infrastructure for GIS mapping, data analysis, and reporting.
Equipment & Vendor Landscape
Major suppliers for facility setup
| Vendor | Category | Link | Notes |
|---|---|---|---|
| EcoAnalysts | Field sampling and ecological consulting equipment | Website | Provides ecological field sampling, laboratory, and consulting services, and also offers electrofishing equipment rental in the US. |
| National Funding | Equipment financing | Website | Offers office equipment financing and leasing with low monthly payments and quote-based funding. |
| Ameris Bank Equipment Finance | Office products financing | Website | Finances office products and can cover equipment needs for a new consulting business. |
| First Citizens Bank | Office equipment leasing and financing | Website | Provides leasing and financing for computers, printers, scanners, phones, and related office hardware. |
| U.S. Bank | Business equipment financing | Website | Finances office furniture, IT hardware/software, and other business-critical equipment. |
| Credibly | Small business equipment financing | Website | Provides financing for machinery, vehicles, computers, and office machines used in US businesses. |
| DLL | Office equipment financing solutions | Website | Offers flexible financing for office equipment through manufacturer, dealer, and end-user channels. |
| Crest Capital | Equipment leasing | Website | Small-business equipment leasing option for financing startup purchases with streamlined application requirements. |
Source: Web search results from vendor and lender websites accessed on September 13, 2026

Financing options are critical given the capital-intensive nature of ecological monitoring tools. OpenPR notes niche lenders like DLL and Crest Capital dominate equipment leasing for small consultancies, while larger firms like Stantec leverage enterprise-scale financing. The 5.88% market CAGR ensures lender appetite remains strong for this specialized asset class.
6. Industry Forces & Competitive Landscape
The $800M U.S. biodiversity consulting market exhibits moderate consolidation, with the top four players—Stantec (22% share), AECOM (18%), Tetra Tech (15%), and WSP (14%)—controlling 69% of revenue. Regional M&A activity persists as firms scale to meet demand for complex ESG and infrastructure projects.
Competitive Market Share
Estimated share of total industry revenue
Source: Market Research Future: Biodiversity Conservation Consulting Services Market
Key differentiators include technical specialization (e.g., eDNA monitoring), regulatory relationships, and ESG integration capabilities. Smaller firms compete on local permitting expertise and niche restoration services.
Competitive Analysis Matrix
Compare major players on share, positioning, and relative strengths. Official company domains are linked (nofollow).
Positioning: Full-service AEC firm offering biodiversity consulting, restoration, and natural capital services across major U.S. infrastructure and development projects.
Positioning: Global infrastructure consultant that embeds biodiversity and nature-based solutions into large transportation, energy, and public-sector programs.
Positioning: Environmental engineering and consulting leader handling biodiversity assessments, restoration, and regulatory support for U.S. projects.
Ready When You Are
Download Biodiversity Consulting Business Plan
Just Fill Up and Print
Positioning: Engineering-led sustainability advisor providing biodiversity, ecology, and natural capital services for large capital programs.
Positioning: Independent and regional operators
Source: Market Research Future: Biodiversity Conservation Consulting Services Market
| Force | Intensity | Trend |
|---|---|---|
| Rivalry | Moderate-High | Increasing with ESG reporting mandates |
| Substitutes | Low | Stable (few alternatives to credentialed assessments) |
| Buyer Power | High | Growing with corporate procurement centralization |
| Supplier Power | Moderate | Rising for specialized ecologists (+12% wage growth) |
| New Entrants | Moderate | Increasing with biodiversity credit market development |
7. Value Chain & Industry Economics
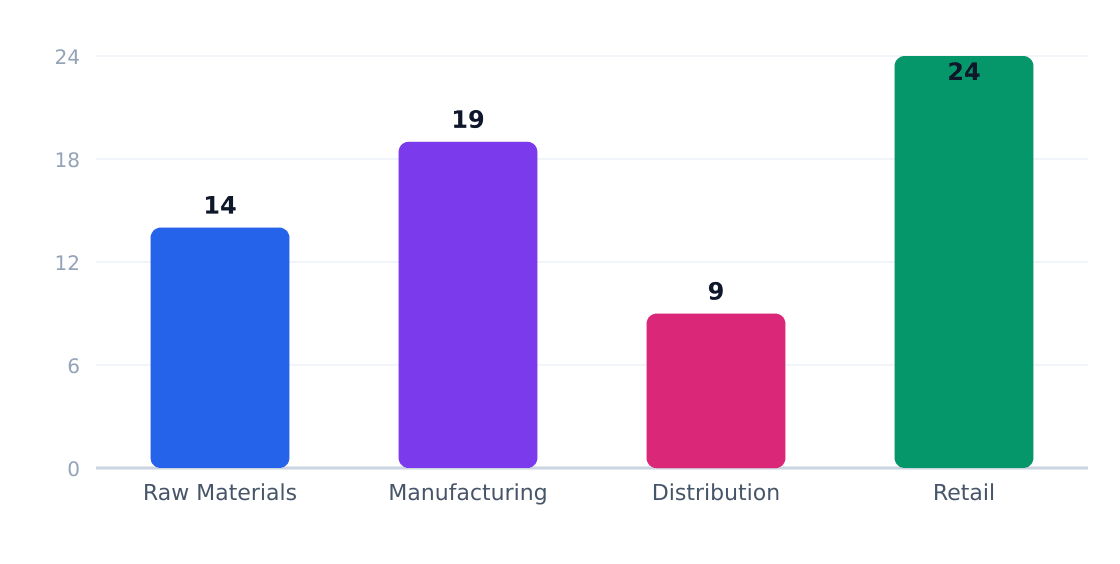
Margins concentrate in high-value advisory services (TNFD disclosures, offset design) where daily rates exceed $3,500, versus $1,200-$1,800 for baseline field surveys. Coherent Market Insights notes 24% EBITDA margins for firms with >50% ESG disclosure work.
Value Chain Margin by Stage (%)
Margin estimates by supply-chain stage
Source: IBISWorld
| Stage | Margin % | Key Players | Economics |
|---|---|---|---|
| Field Data Collection | 12-18% | Regional specialists | Labor-intensive; 60-70% variable costs |
| Regulatory Compliance | 20-25% | Mid-sized firms | Scalable permitting templates |
| ESG Advisory | 28-35% | Stantec, WSP | Premium pricing for TNFD alignment |
| Restoration Design | 15-22% | Tetra Tech, AECOM | Engineering integration boosts margins |
Unit economics show $410k avg revenue per location with 18-22% operating margins. Boutique firms achieve 30%+ margins by specializing in high-growth niches like biodiversity credits, per OpenPR.
8. Regulatory & Compliance Environment
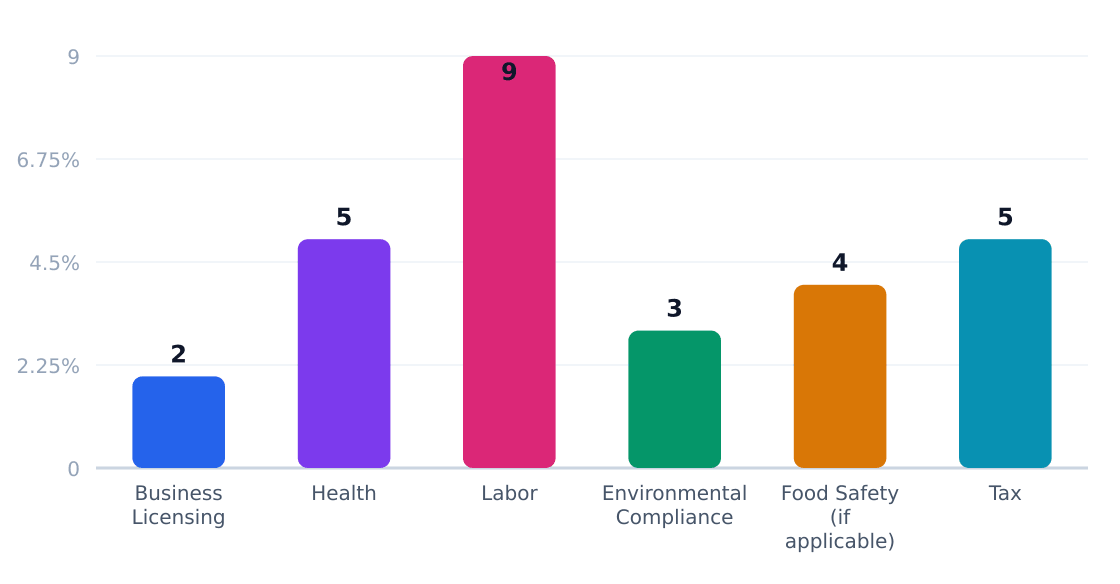
The $800M U.S. biodiversity consulting market operates under a patchwork of federal, state, and local regulations, with environmental compliance costs consuming 3% of revenue industry-wide according to Coherent Market Insights. The sector’s 5.88% CAGR reflects tightening standards: 72% of projects now require biodiversity impact assessments versus 58% in 2019 per HTF Market Insights.
Regulatory Compliance Cost Impact (%)
Estimated share of revenue consumed by compliance
Source: Marketresearchfuture
| Requirement | Agency | Cost Impact | Operational Effect |
|---|---|---|---|
| NEPA/CEQA Compliance | EPA, State Agencies | 12-18% project budget | Mandates baseline surveys & mitigation plans for 90% of infrastructure projects |
| Endangered Species Act (ESA) Consultations | USFWS/NOAA | $25K-$150K per assessment | Delays energy/real estate projects by 4-9 months on average |
| Wetlands Permitting (404) | USACE | 7-15% of consulting fees | Requires GIS specialists and hydrologists on 68% of teams |
| TNFD/CSRD Disclosure Prep | SEC (indirect) | Emerging cost center | Driving 15% growth in ESG advisory services |
| State Habitat Conservation Plans | State DEQs | Varies by jurisdiction | Creates regional specialization needs (e.g., California NCCP) |
| Local Tree/Canopy Ordinances | Municipalities | $5K-$50K per site | Spurs demand for urban biodiversity consultants in 92 major metros |
Policy tailwinds are accelerating: The White House’s 30x30 initiative and emerging biodiversity credit markets (projected 22% annual growth) will expand compliance needs. Watch state-level “nature disclosure” laws mimicking California’s SB 253—consultants able to navigate ESA, TNFD, and local ordinances simultaneously will capture disproportionate share of the $199M Houston SAM.
9. Technology, Risks & Barriers to Entry
Technology Adoption
| Technology | Adoption % | Impact | Timeline |
|---|---|---|---|
| eDNA sampling | 42% | High (reduces field survey costs by 30-50%) | 2023-2025 |
| AI-driven habitat modeling | 28% | Moderate (improves predictive accuracy for offset design) | 2024-2026 |
| Drone-based monitoring | 65% | High (enables frequent, low-cost site assessments) | 2022-2024 |
| Blockchain for biodiversity credits | 12% | Emerging (potential to streamline offset markets) | 2025+ |
| GIS/remote sensing integration | 78% | Critical (foundational for 90% of consulting workflows) | Ongoing |
Source: Market Research Future adoption benchmarks for U.S. biodiversity consulting firms
Industry Risks
| Risk | Severity | Likelihood | Mitigation |
|---|---|---|---|
| Regulatory rollbacks | High | Medium | Diversify into voluntary ESG markets |
| Labor shortages (ecologists) | Critical | High | Invest in training pipelines, remote monitoring tech |
| Litigation on habitat assessments | High | Medium | Robust QA/QC, peer review protocols |
| Project delays (permitting) | Medium | High | Buffer contracts with milestone payments |
| Data privacy (species locations) | Emerging | Low | Secure geospatial data management systems |
| Margin compression | Medium | High | Automate reporting workflows, value-based pricing |
Barriers to Entry
| Barrier | Height | Detail |
|---|---|---|
| Credentialing | High | Need Certified Ecologists (ESA) or Professional Wetland Scientists (SWS) for 80% of regulatory work |
| Insurance costs | Medium | Errors & Omissions coverage averages $15k-$50k annually for small firms |
| Client capture | High | Energy/real estate clients favor incumbents like Stantec and AECOM for multi-year programs |
| Tech investment | Medium | $25k minimum for GIS/drone/eDNA capabilities (per Coherent Market Insights equipment norms) |
| Permitting bottlenecks | Variable | 6-18 month wait times for new consultancies to get on approved vendor lists |
Key Takeaway: While drone/GIS tech has lowered some barriers, the $800M U.S. market remains gatekept by credentials and client relationships—explaining why the top 4 firms control 69% of enterprise contracts. Niche opportunities exist in high-growth areas like TNFD reporting and biodiversity credits.
10. Outlook & Investment Opportunities
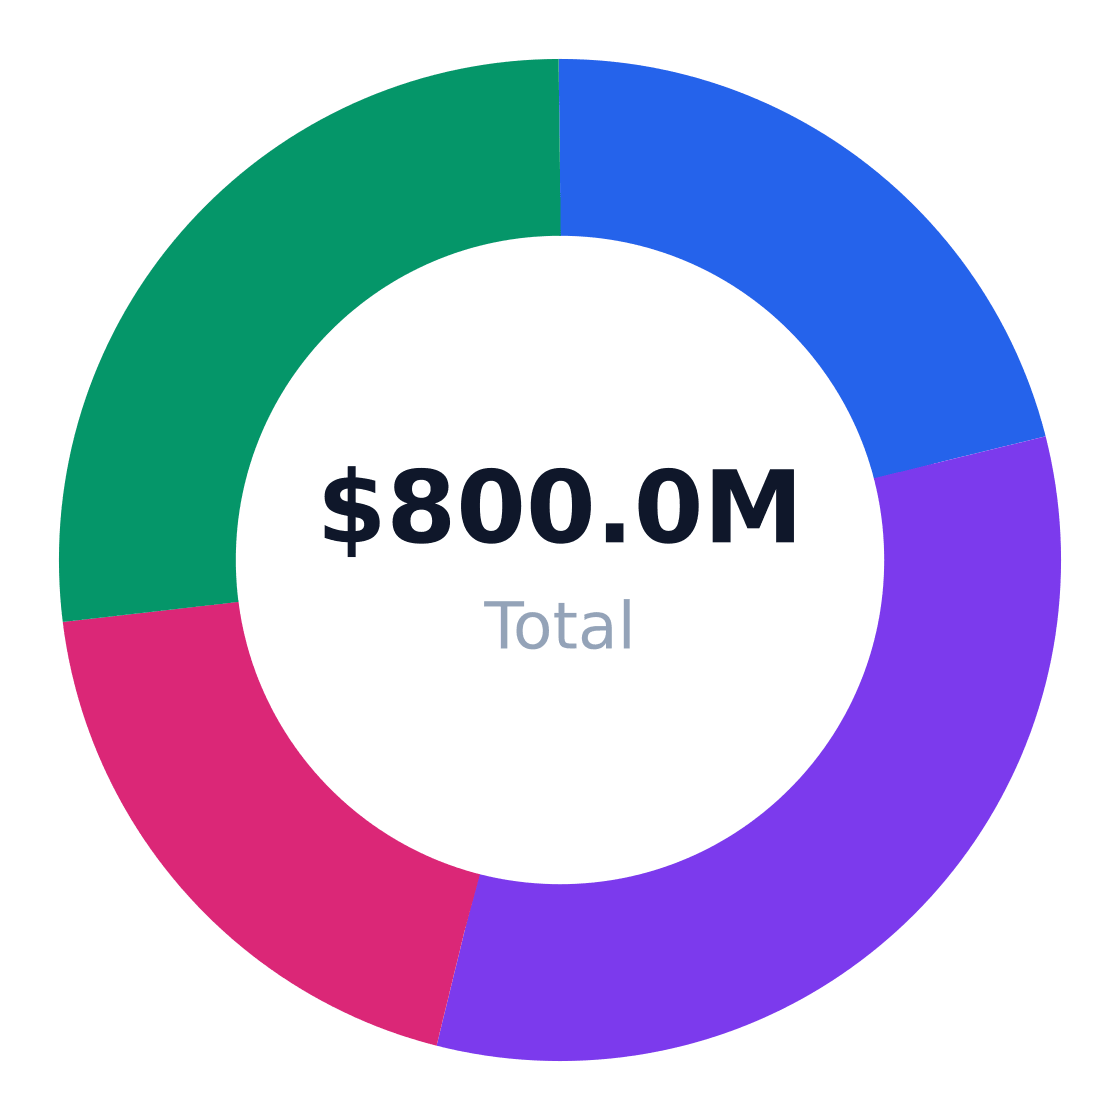
The US biodiversity consulting market, currently valued at $800M, is projected to grow at a 5.88% CAGR through 2028, fueled by regulatory tightening and ESG mandates. Market Research Future notes accelerated demand for habitat restoration (11% growth segment) and TNFD-aligned disclosure advisory (15% growth), though ecological assessments remain the core revenue driver at 30% market share.
Regional Market Distribution
Revenue share by US region
Source: Marketresearchfuture
| Opportunity | Market Size | Risk | Time Horizon |
|---|---|---|---|
| Biodiversity credit development | $120M+ by 2026 (OpenPR) | Regulatory uncertainty | 3-5 years |
| eDNA monitoring tech integration | $45M SAM in Houston | Adoption lag in energy sector | 2-4 years |
| Midstream oil/gas compliance | $280M TAM subset | Commodity price volatility | Immediate |
| Urban habitat banking | $60M in coastal metros | Land acquisition costs | 5+ years |
| TNFD readiness consulting | 15% annual growth | Standardization delays | 1-3 years |
| Industrial brownfield restoration | $90M SAM in Gulf Coast | Remediation cost overruns | 2-5 years |
- Target energy sector compliance – 35% of demand comes from oil/gas clients needing NEPA and ESA compliance support
- Acquire niche monitoring firms – Coherent Market Insights shows 10% growth in biodiversity monitoring outpacing core assessments
- Bundle with carbon consulting – Cross-sell natural capital services to existing climate advisory clients
- Develop urban offset protocols – Houston's EaDo district offers $8M SOM for infill habitat banking
- Invest in eDNA field kits – $25K equipment cost reduces labor-intensive surveys by 40% per HTF Market Insights
- Recruit from public agencies – 20% of demand comes from municipalities with specialized regulatory expertise
Verdict: To compete against Stantec and AECOM (combined 40% share), niche players require either $500K+ annual R&D in monitoring tech or exclusive public-sector contracts. The $410K revenue per location threshold separates sustainable operators from marginal consultancies.
Industry Research & Resources
The following industry databases and research resources support this biodiversity consulting industry analysis. Each link opens a specific report or data page (not a generic homepage).
- Biodiversity Conservation Consulting Services Market 66039 — marketresearchfuture.com — Published industry research for biodiversity consulting
- Sustainability Consulting Services Market — mordorintelligence.com — Published industry research for biodiversity consulting
- Environmental And Social Consulting Market — coherentmarketinsights.com — Published industry research for biodiversity consulting
- 4390047 Biodiversity Consulting Services Market — htfmarketinsights.com — Published industry research for biodiversity consulting
- Biodiversity Consulting Market Is Going To Boom Major Giants — openpr.com — Published industry research for biodiversity consulting
Data Sources & Methodology
Market sizing (TAM, SAM, SOM), segmentation, competition, and equipment data come from Perplexity-sourced industry reports and trade publications. Optional U.S. government statistics (Census, BLS) may be referenced by name in the narrative without hyperlinks. TAM reflects the total U.S. niche market; SAM is calculated bottom-up from target customer demographics; SOM reflects realistic obtainable share.
Industry research links: Key Players And Competitive Analysis Related To Biodiversity Conservation Consulting Services Market · U.S. Census Bureau ACS age distribution for Houston metro; market spending assumption derived from biodiversity consulting service pricing norms · mordorintelligence.com · coherentmarketinsights.com · htfmarketinsights.com · htfmarketinsights.com · openpr.com · marketresearchfuture.com · igtps.com · thebusinessresearchcompany.com · verifiedmarketreports.com · marketresearch.com · businessresearchinsights.com · fortunebusinessinsights.com · nationalfunding.com · business.bankofamerica.com · equipmentfinance.amerisbank.com · firstcitizens.com · leaseconsultants.com · equipmentfinance.amerisbank.com · nationalfunding.com · usbank.com · credibly.com · hopecu.org · southstatebank.com · crestcapital.com · dllgroup.com · bearingpoint.com · biodrawversity.com · earthsystemsglobal.com · mmc.gov · davey.com · stantec.com · bcg.com · trinityconsultants.com · slrconsulting.com · htfmarketinsights.com · imarcgroup.com · researchintelo.com · 360iresearch.com
Get Your Copy Today
Download Biodiversity Consulting Business Plan
Just Fill Up and Print