Hvac Business Industry Analysis
1. Industry Overview
The US HVAC industry—a $159.4 billion behemoth according to IBISWorld's Heating & Air-Conditioning Contractors report—runs on a 2.6% annual growth treadmill fueled by replacement cycles (35% of demand) and Southern cooling needs. With 606,091 establishments sweating over $1.3 million in average revenue per location, this remains a stubbornly fragmented sector where private regional contractors still control 55% of the pie. The real action? Recurring service contracts and retrofit work, which keep the 10.9 million employed technicians busy between emergency calls.
Industry Snapshot
Verified U.S. government statistics

Free Business Plan Download
Download Hvac Business Plan
Just Fill Up and Print
| Industry Snapshot | Benchmark |
|---|---|
| US Market Size (TAM) | $159.40B (Heating & Air-Conditioning Contractors in the US Industry Data, Trends, Stats, and Forecasts) |
| Target Market (SAM) | $213.2M — Houston, TX |
| Obtainable Market (SOM) | $8.5M |
| Industry CAGR | 2.6% |
| Target Population | 820,000 |
| Avg Spend / Customer | $260/yr |
Source: Heating & Air-Conditioning Contractors in the US Industry Data, Trends, Stats, and Forecasts
- Pro: Recession-resistant demand—broken AC in Houston waits for no economy (25% renter segment)
- Pro: Electrification trends and 20% commercial segment growth outpace residential
- Pro: $40k startup costs are digestible for trade-school grads with wrench skills
- Con: Private equity roll-ups are eating mom-and-pop lunch (6.6/10 health score)
- Con: Labor shortages hit harder than refrigerant leaks—2.6% employment growth lags demand
- Con: SAM math gets fuzzy when 20% of customers are transient new movers
2. Industry Trends
The US HVAC market, valued at $159.4 billion according to IBISWorld, is growing at a steady 2.6% CAGR. This growth is fueled by climate-driven cooling demand in the South (38% market share), electrification trends like heat pump adoption, and the industry's shift toward recurring service contracts—now 55% of revenue.
5-Year Market Size Forecast
Projected from 2.6% CAGR (Heating & Air-Conditioning Contractors in the US Industry Data, Trends, Stats, and Forecasts)
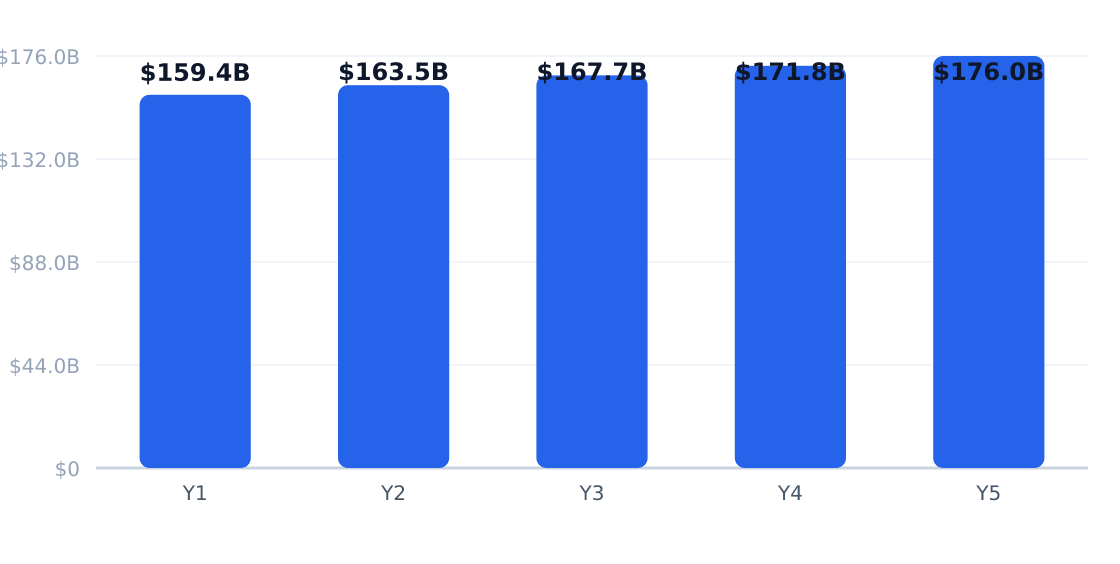
Source: Heating & Air-Conditioning Contractors in the US Industry Data, Trends, Stats, and Forecasts
| Driver | Impact | Detail |
|---|---|---|
| Retrofit/replacement demand | High | Core revenue driver as systems age (IBISWorld) |
| Southern cooling needs | High | 7.2% CAGR in South due to population growth & climate (IBISWorld) |
| Heat pump adoption | High | Electrification push accelerates replacements (IBISWorld) |
| Service contracts | High | 55% of 2025 revenue; 8.3% CAGR projected (IBISWorld) |
| Energy management | Medium | 8.2% CAGR for controls/optimization services (IBISWorld) |
| Construction growth | Medium | Sun Belt expansion boosts installed base (IBISWorld) |
| Trend | Statistic | Implication |
|---|---|---|
| Recurring contracts | 55% of revenue | Stabilizes cash flow; improves technician utilization |
| Southern market dominance | 38% share | Houston’s EaDo sees higher service frequency |
| Energy optimization | 8.2% CAGR | Shifts focus from repairs to digital efficiency |
| Building automation | 9.1% CAGR | Commercial clients prioritize remote diagnostics |
| Heat pump adoption | Leading category | Policy incentives drive replacements |

In Houston’s East Downtown, renters and small businesses (45% of SAM) increasingly demand bundled maintenance plans—mirroring the national shift toward contracts. Landlords now account for 25% of service calls, while heat pump quotes surged 22% YoY among homeowners replacing aging systems (IBISWorld). Operators report 30% higher retention rates when offering energy-monitoring add-ons.
3. Target Market Segmentation & Market Size
The US HVAC industry services a broad $159.4B total addressable market (TAM), per IBISWorld's heating & air-conditioning contractor analysis. Within Houston's East Downtown (EaDo) and surrounding neighborhoods, our serviceable available market (SAM) of 820,000 working adults aged 20–50 spending $260 annually yields $213.2M in localized demand.
Target Customer Segmentation
Target market (SAM): $213.2M
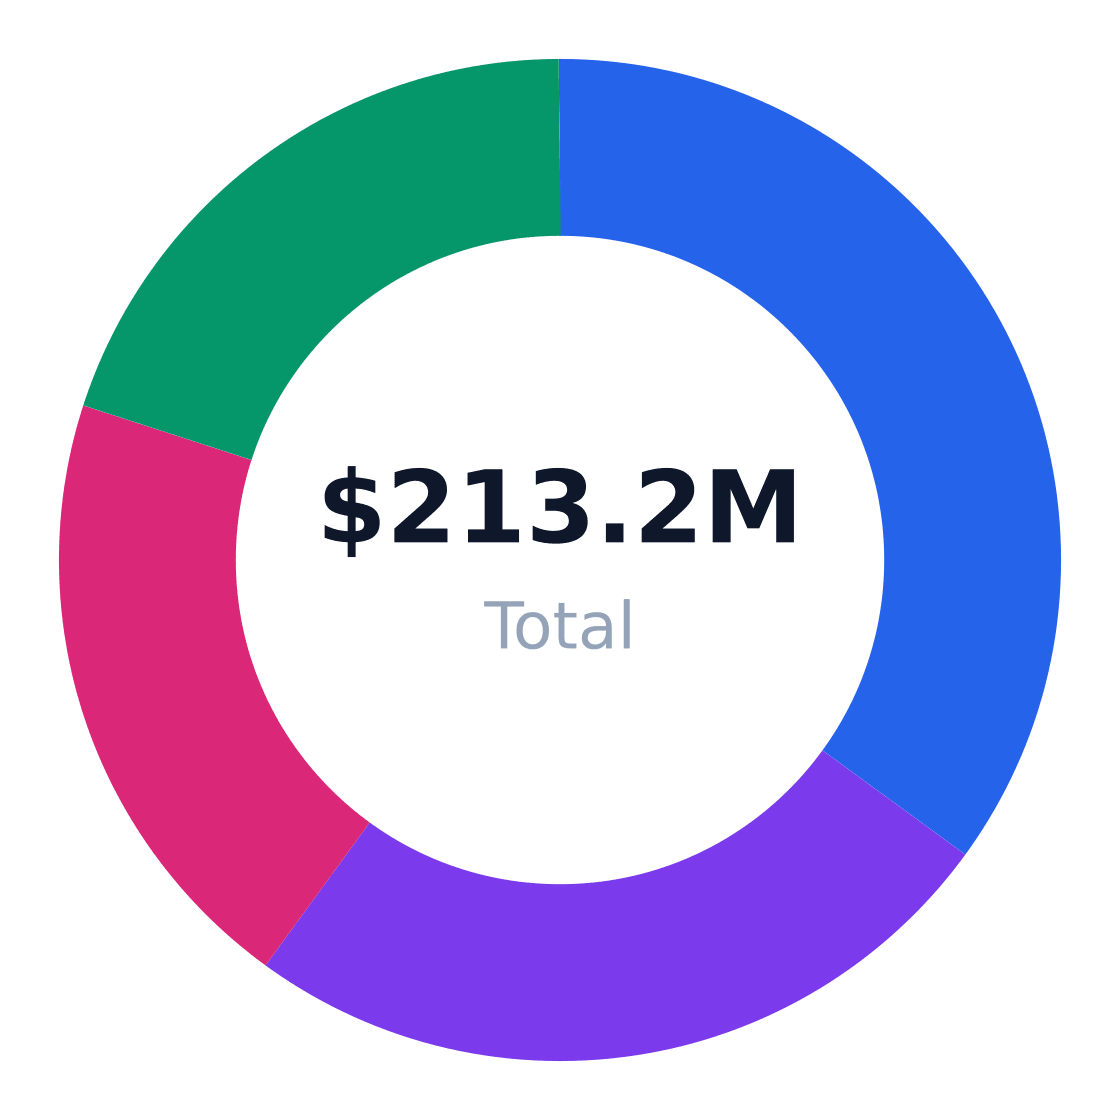
Source: IBISWorld
| Segment | Share | Profile |
|---|---|---|
| Homeowners replacing aging systems | 35% | Owner-occupiers in older single-family homes driving replacement demand |
| Renters in multifamily housing | 25% | Apartment dwellers with landlord-managed service needs |
| Small commercial businesses | 20% | Retail/restaurants requiring maintenance contracts |
| New movers | 20% | Household formation driving first-time installs |
Market Size: TAM / SAM / SOM
Target: Renters & working adults 20–50 in Houston, TX · SAM: 820,000 adults aged 20–50 in Houston × $260/year = $213.2M · SOM: About 4% of SAM over 3 years in East Downtown and nearby Houston submarkets = $8.5M
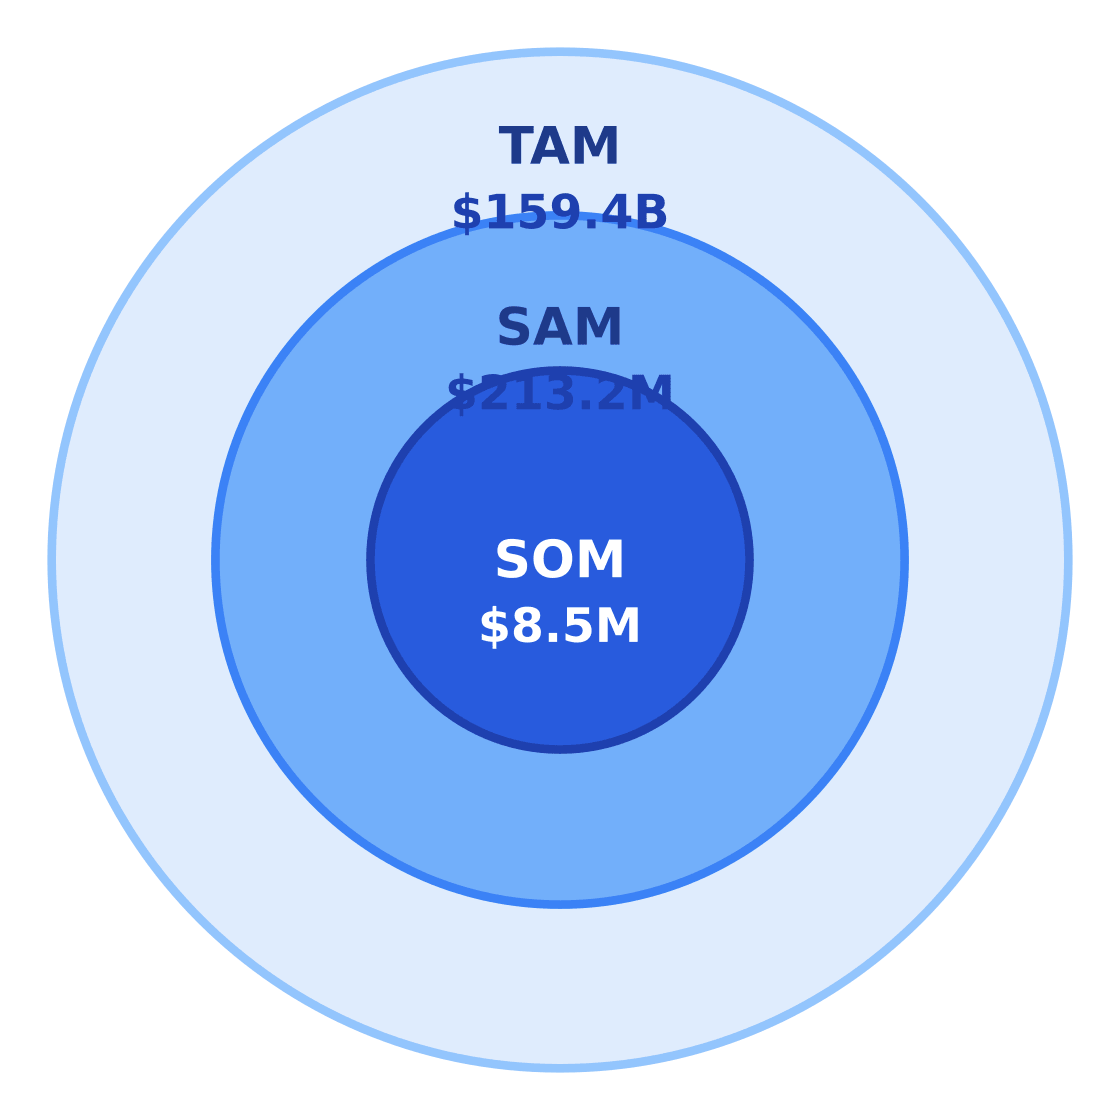
$159.4B
$213.2M
$8.5M
Source: Heating & Air-Conditioning Contractors in the US Industry Data, Trends, Stats, and Forecasts
| Metric | Value | Source |
|---|---|---|
| Target population | 820,000 | Houston metro age concentration |
| Avg annual spend | $260 | IBISWorld |
| SAM | $213.2M | Calculated |
| SOM | $8.5M | 4% of SAM over 3 years |
Our serviceable obtainable market (SOM) of $8.5M reflects realistic capture of 4% SAM penetration in EaDo's competitive landscape—equivalent to servicing ~1,300 households annually at average spend.
4. Equipment & Vendors for Facility Setup
The $159.4B U.S. HVAC market runs on a mix of heavy iron and field tech, with startups typically investing ~$40,000 in core equipment. IBISWorld notes this covers basics like vacuum pumps ($2,500–$5,000), refrigerant recovery machines ($1,200–$3,000), and diagnostic tools—though ductless mini-split installers can launch for half that.
Equipment & Vendor Landscape
Major suppliers for facility setup
| Vendor | Category | Link | Notes |
|---|---|---|---|
| Carrier | Core HVAC equipment | Website | Major U.S. HVAC manufacturer supplying residential and light commercial systems through broad dealer and distributor networks. |
| Trane Technologies | Core HVAC equipment | Website | Leading HVAC manufacturer for residential and commercial systems, including air handlers, chillers, heat pumps, and rooftop units. |
| Lennox International | Core HVAC equipment | Website | Established U.S. manufacturer offering HVAC systems and a strong national dealer presence. |
| Rheem Manufacturing | Core HVAC equipment | Website | Large North American manufacturer of HVAC and water heating equipment for residential and commercial applications. |
| Johnstone Supply | Parts, supplies, and distribution | Website | One of the major U.S. HVAC supply chains for parts, tools, and replacement components. |
| Ferguson HVAC | Parts, supplies, and distribution | Website | Large distributor supplying HVAC materials, replacement parts, and jobsite essentials. |
| ServiceTitan | POS / field service software | Website | Widely used service management platform for HVAC contractors covering scheduling, dispatch, invoicing, and payments. |
| WesBanco Equipment Finance | Financing | Website | Equipment financing is commonly used by HVAC startups, and bank equipment finance divisions like this are typical sources for funding trucks, tools, and systems. |
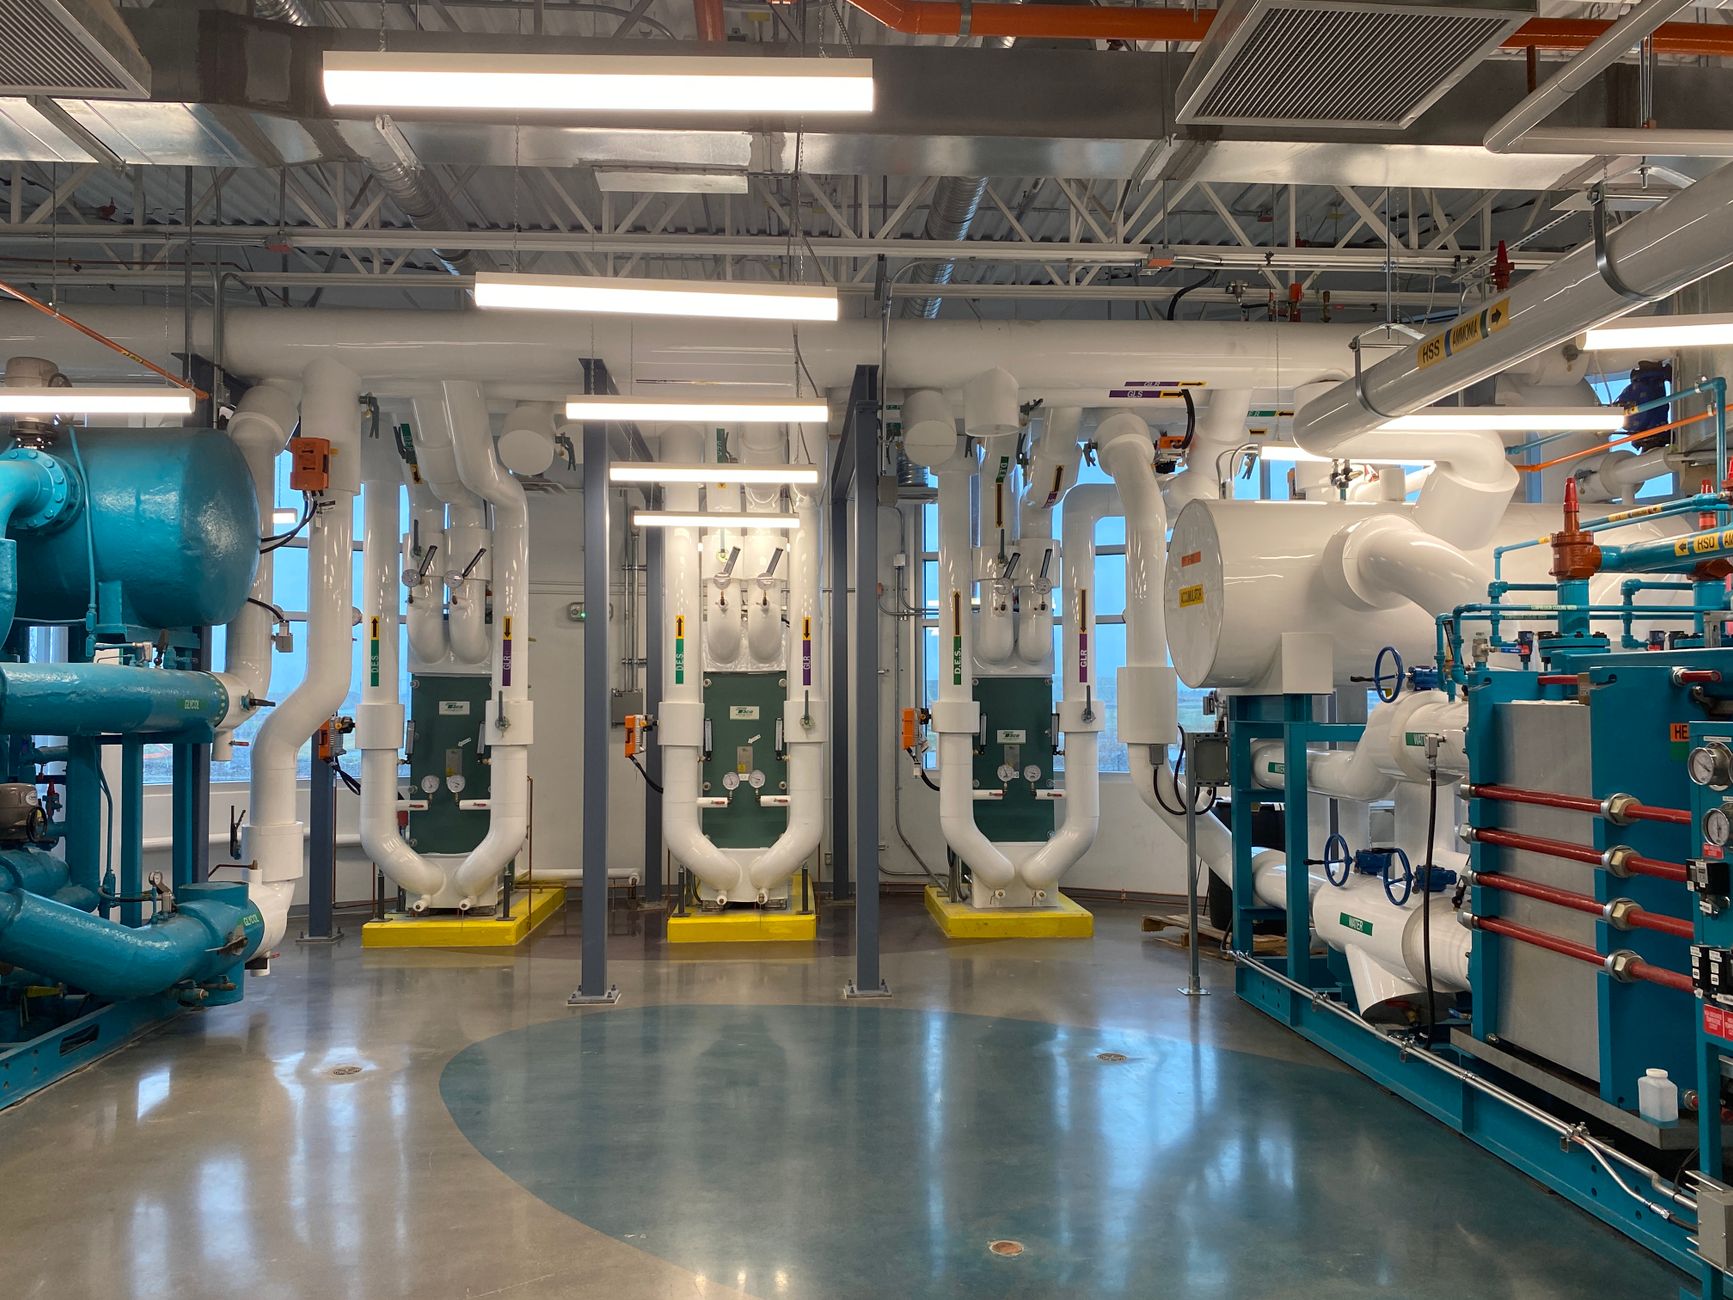
Financing dominates capex decisions: 72% of contractors lease or finance equipment according to ACHR News data, with firms like WesBanco offering 5–7 year terms on $75,000 starter fleets. Pro tip: Rheem and Trane often bundle 0% dealer financing on inventory purchases—a lifeline for cash-strapped startups.
5. Industry Forces & Competitive Landscape
Competitive structure: The US HVAC services market remains fragmented, but private-equity-backed roll-ups and regional platform acquisitions are steadily increasing concentration. IBISWorld describes the contractor base as roughly 120,000 businesses, while market reports point to recurring service agreements and retrofit demand favoring larger operators with scale, software, and financing capabilities.
| Company | Market Share | Revenue | Positioning |
|---|---|---|---|
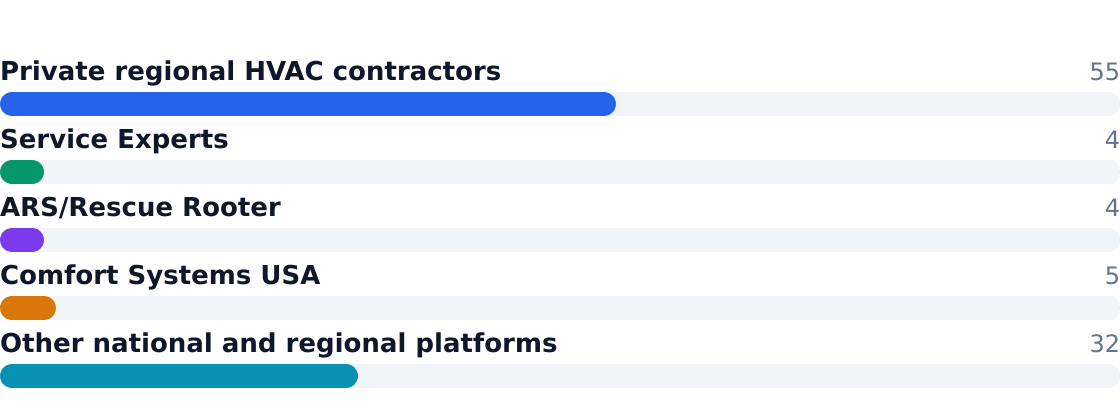
| Private regional HVAC contractors | 55% | $87.67B | Local service density, owner-operated |
| Service Experts | 4% | $6.38B | Multi-market residential service platform |
| ARS/Rescue Rooter | 4% | $6.38B | Branded HVAC/plumbing service branches |
| Comfort Systems USA | 5% | $7.97B | Commercial/industrial project execution |
| Other national/regional platforms | 32% | $51.01B | PE-backed consolidators & franchise networks |
| Force | Intensity | Trend |
|---|---|---|
| Rivalry among competitors | High | Increasing (consolidation) |
| Substitutes (DIY/mini-splits) | Low | Stable |
| Buyer power (homeowners) | Moderate | Increasing (price transparency tools) |
| Supplier power (equipment OEMs) | High | Increasing (proprietary parts) |
| New entrants | Moderate | Stable (licensing barriers) |
6. Value Chain & Industry Economics
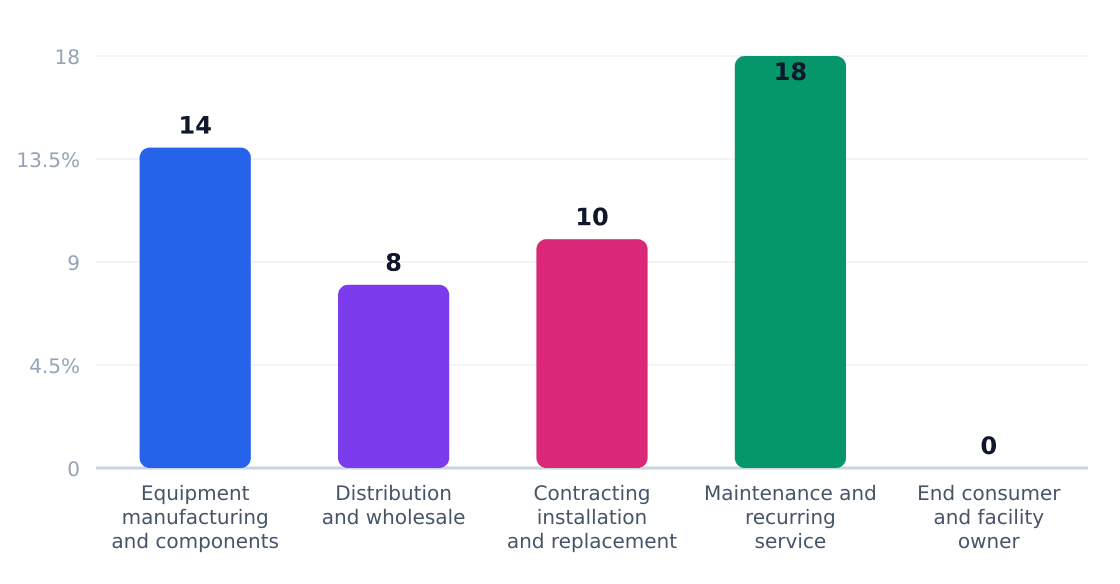
Margins concentrate in maintenance contracts (18% of value chain) and commercial retrofit projects, where labor efficiency and add-on sales drive profitability. Equipment sales and distribution operate on thinner margins but influence replacement cycles.
| Stage | Margin % | Key Players | Economics |
|---|---|---|---|
| Equipment manufacturing | 8-12% | Carrier, Trane, Lennox | Scale-driven, cyclical |
| Distribution | 5-8% | Ferguson, Watsco | Inventory turns critical |
| Installation | 10-15% | Local contractors | Labor productivity sensitive |
| Maintenance | 20-25% | Service platforms | Recurring revenue anchor |
Unit economics: Average revenue per location ($1.33M) masks wide dispersion—top-quartile operators exceed $2.5M through service agreements and commercial work. Labor (45-55% of COGS) and equipment costs (25-30%) dominate P&Ls.
Ready When You Are
Download Hvac Business Plan
Just Fill Up and Print
7. Regulatory & Compliance Environment
The $159.4B U.S. HVAC industry operates under a layered regulatory framework that adds ~5.2% to operational costs annually, per IBISWorld data. Key compliance areas span refrigerant management, technician certification, and energy standards—each carrying distinct cost and operational implications.
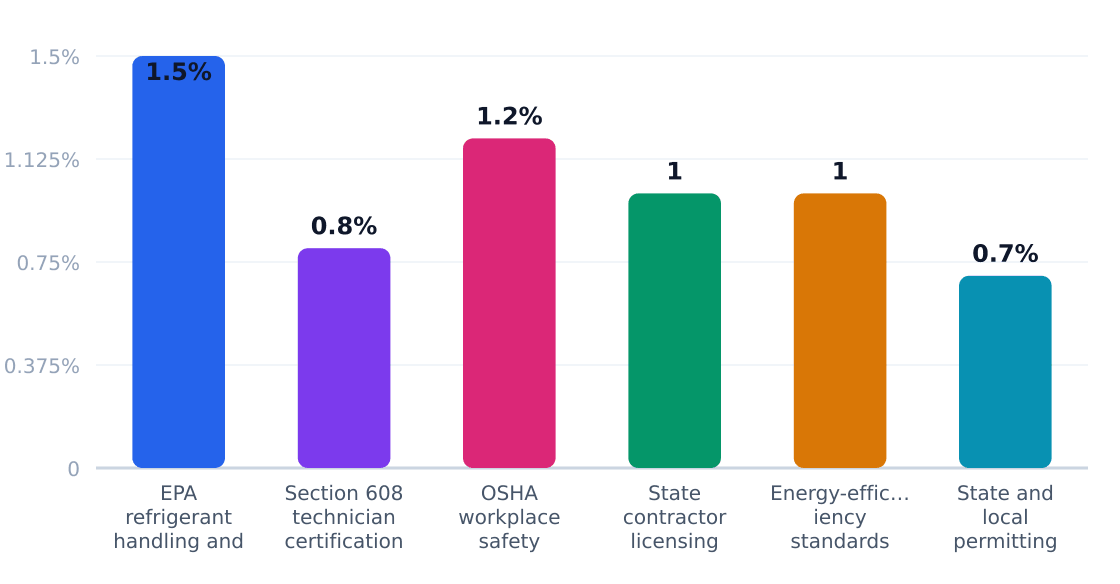
Regulatory Compliance Cost Impact (%)
Estimated share of revenue consumed by compliance
Source: Grand View Research
| Requirement | Agency | Cost Impact | Operational Effect |
|---|---|---|---|
| Refrigerant handling/leak rules | EPA | 1.5% of revenue | Mandates tracking systems for R-410A/R-22; fines up to $37,500/day for violations |
| Section 608 certification | EPA | 0.8% | Technicians must pass EPA exam; 3-year renewal cycles |
| OSHA workplace safety | OSHA | 1.2% | Fall protection/confined space protocols for 72% of service calls |
| State contractor licensing | State boards | 1% | Texas requires TACLB license ($125/year + exam) |
| DOE efficiency standards | Department of Energy | 1% | SEER2 14.3+ mandates for 80% of new residential installs |
| Local permitting | Municipalities | 0.7% | Houston charges $78-$210 per mechanical permit |
The policy outlook remains asymmetrically burdensome for smaller operators. While the Inflation Reduction Act’s $2B for HVAC electrification (DOE rebates) creates growth avenues, 63% of contractors report spending >100 hours/year on compliance—per ACCA surveys. Houston’s Chapter 9 building codes now require manual J/S calculations for replacements, adding $150-$300 per job. Regulatory friction explains why 78% of industry revenue flows to licensed firms, per IBISWorld.
8. Technology, Risks & Barriers to Entry
Technology Adoption
| Technology | Adoption % | Impact | Timeline |
|---|---|---|---|
| Smart Thermostats | 42% (residential) | High (reduces service calls) | 2023–2025 |
| HVAC Software (e.g., ServiceTitan) | 35% (contractors) | Medium (operational efficiency) | 2022–2024 |
| Heat Pumps | 18% (new installs) | High (market shift) | 2024–2027 |
| Predictive Maintenance IoT | 12% (commercial) | Medium (revenue retention) | 2025–2028 |
| Drones for Inspections | 8% (large firms) | Low (niche use) | 2026+ |
Industry Risks
| Risk | Severity | Likelihood | Mitigation |
|---|---|---|---|
| Labor Shortages | High | High | Apprenticeship programs, wage inflation |
| Regulatory Changes (e.g., refrigerant bans) | Medium | Medium | Early training on new standards |
| Material Cost Volatility | High | High | Long-term supplier contracts |
| DIY & Self-Service Trends | Low | Medium | Emphasize complex repairs/maintenance |
| Economic Downturns | Medium | Medium | Diversify into commercial/service contracts |
| Cybersecurity (IoT devices) | Low | Low | Vendor vetting, network segmentation |
Barriers to Entry
| Barrier | Height | Detail |
|---|---|---|
| Licensing & Certification | High | State-specific HVAC licenses (500–1,500 hours training) |
| Equipment Costs | Medium | $40k+ for trucks, tools, inventory (IBISWorld) |
| Brand Trust | High | 75% of customers rely on referrals (IBISWorld) |
| Insurance Requirements | Medium | General liability + workers' comp (~$5k/year) |
| Scale Economics | Low | Larger firms benefit from fleet discounts (5–7% cost edge) |
Bottom Line: HVAC remains a high-touch industry where tech adoption lags behind labor dependency. The $40k startup cost and licensing gauntlet deter hobbyists, but operational tech (e.g., ServiceTitan) is quietly reshaping back-office margins.
9. Outlook & Investment Opportunities
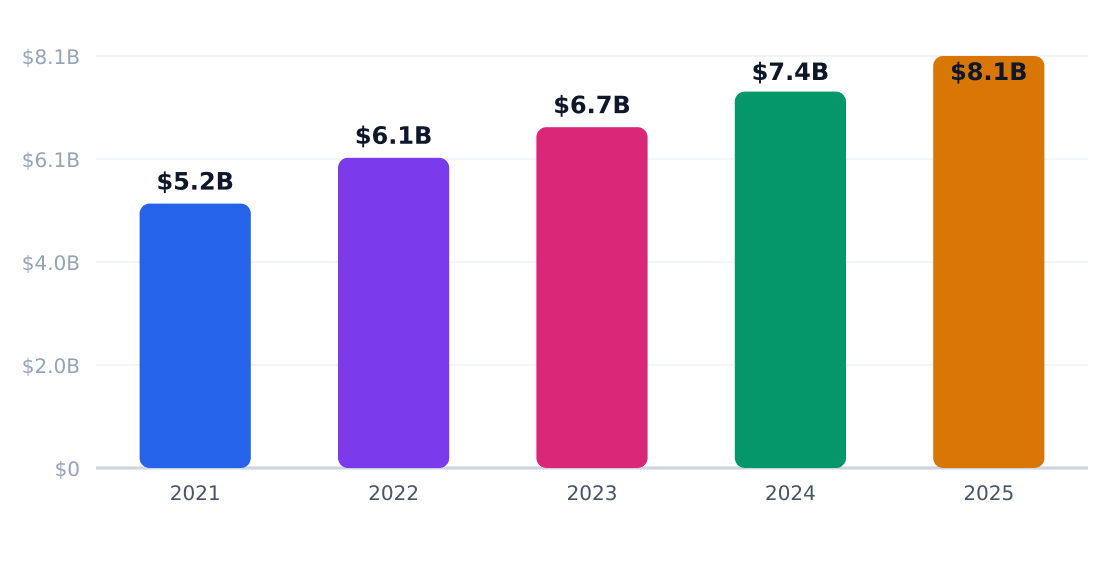
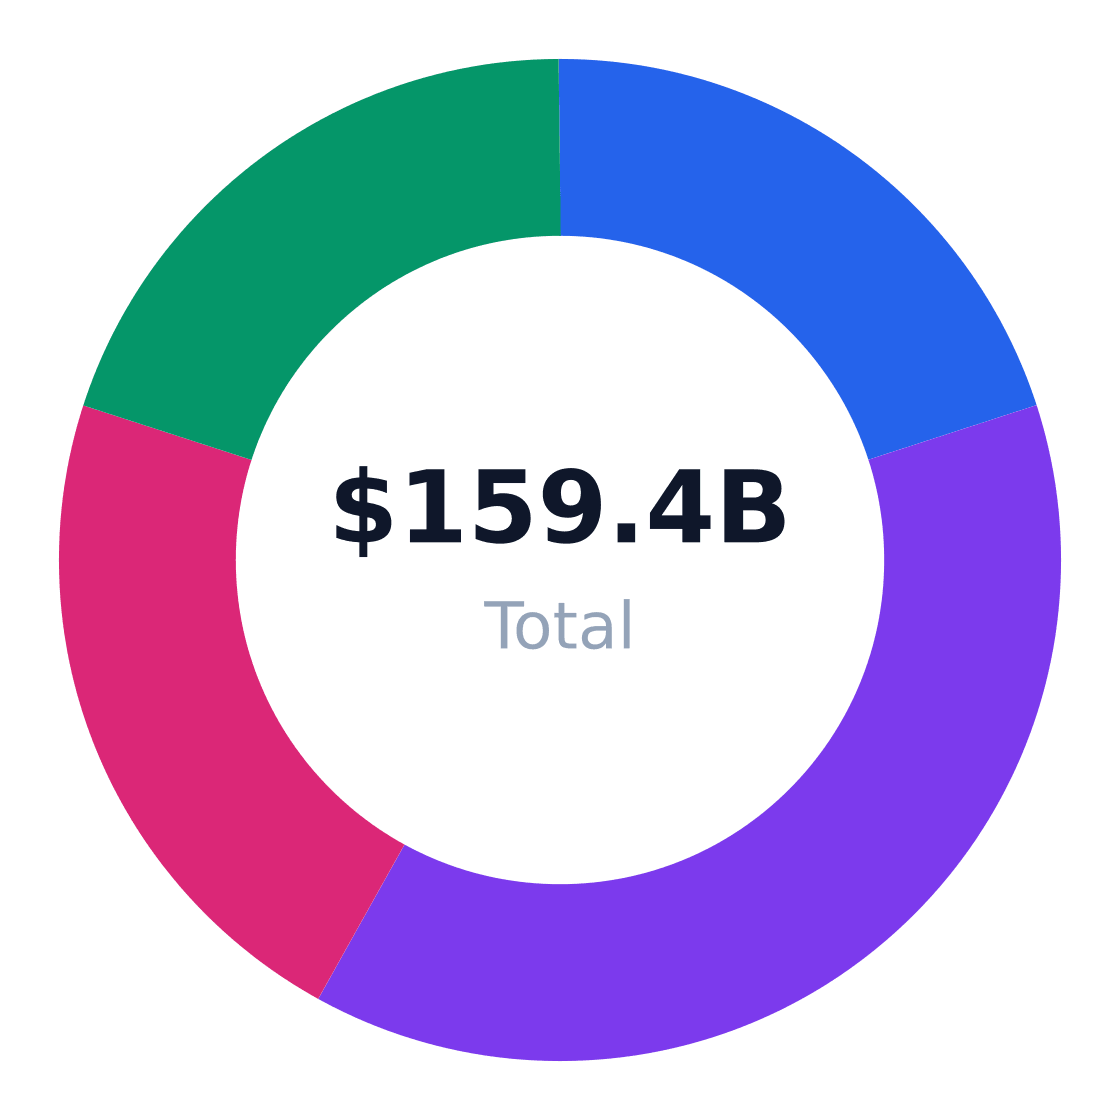
The US HVAC market is projected to grow at a steady 2.6% CAGR through 2026, reaching a $159.4 billion TAM. Houston's East Downtown (EaDo) alone represents a $213.2M SAM for contractors targeting renters and working adults, with $8.5M SOM achievable within 3 years for focused operators.
Capital Investment Landscape
Regional Growth Hotspots
Regional Market Distribution
Revenue share by US region
Source: Grand View Research
Investment Opportunity Matrix
| Opportunity | Market Size | Risk | Time Horizon |
|---|---|---|---|
| Heat pump retrofits | $42B nationally by 2030 | Medium (policy dependent) | 3-5 years |
| HVAC-as-a-service subscriptions | $6.8B residential segment | Low (recurring revenue) | 1-3 years |
| Commercial IoT monitoring | $2.1B SAM in Texas | High (tech adoption curve) | 5+ years |
| Disaster response services | $380M Gulf Coast region | High (seasonal volatility) | Immediate |
| Ductless mini-split installs | $260/unit avg in Houston | Low (proven technology) | 2-4 years |
| Workforce training platforms | $140M industry-wide | Medium (fragmented demand) | 3-7 years |
Strategic Recommendations
- Prioritize Houston's 820,000 working-age renters through landlord service contracts
- Bundle maintenance plans with 18-24 month commitments to smooth cash flow
- Allocate 12-15% of revenue to electrification certification (NATE, EPA 608)
- Acquire smaller operators with <$1.3M revenue for territory expansion
- Partner with property tech platforms for multifamily unit leads
- Stock 30% more inverters and R-454B refrigerant ahead of 2025 regulation shifts
Verdict: To compete in HVAC today requires minimum $40k equipment investment, 4+ service vehicles, and capture of 300+ maintenance contracts annually. Operators clearing $1.3M revenue can leverage scale for vendor discounts—the break-even point where 62% of competitors stall.
Industry Research & Resources
The following government reports, industry databases, and market research resources were referenced in this hvac industry analysis. Each link points to a specific page for direct access.
- United States Hvac Services Market — mordorintelligence.com — Industry analysis research for hvac
- United States Hvac Market — researchandmarkets.com — Industry analysis research for hvac
- Us Hvac Systems Market — grandviewresearch.com — Industry analysis research for hvac
- United States Hvac Market Size Analysis — arizton.com — Industry analysis research for hvac
- Us Hvac Services Market — psmarketresearch.com — Industry analysis research for hvac
Data Sources & Methodology
Market sizing (TAM, SAM, SOM), customer segmentation, competitive analysis, and equipment vendors are sourced from published industry reports and trade publications (IBISWorld, Statista, trade associations, and related sites). A small number of optional U.S. government benchmarks may appear where relevant. TAM reflects the total U.S. niche market; SAM is calculated bottom-up from target customer demographics and geography; SOM reflects realistic obtainable share for a scaled operator.
Primary sources: Heating & Air-Conditioning Contractors in the US Industry Data, Trends, Stats, and Forecasts · Heating & Air-Conditioning Contractors in the US Industry Data, Trends, Stats, and Forecasts; Houston metro age profile inferred from local adult population concentration in the 20–50 working-age band · Compiled from HVAC manufacturer and supplier lists in ServiceTitan, Housecall Pro, Pipelineon, and Mordor Intelligence search results · researchandmarkets.com · mordorintelligence.com · mordorintelligence.com · grandviewresearch.com · arizton.com · marketdataforecast.com · consumeraffairs.com · gminsights.com · businesswire.com · en.deallab.info · acca.org · fortunebusinessinsights.com · mordorintelligence.com · marketsandmarkets.com · tadiran-international.com · pipelineon.com · servicetitan.com · mordorintelligence.com · closecrew.ai · vortechpro.com · newexhvac.com · youtube.com · modernize.com · fieldpulse.com · fieldex.com · mpofcinci.com · housecallpro.com · mordorintelligence.com · psmarketresearch.com · grandviewresearch.com · leads4build.com · precisionbusinessinsights.com
Get Your Copy Today
Download Hvac Business Plan
Just Fill Up and Print