Is a Hvac Business Profitable?
1. Is a Hvac Business Profitable? (The Short Answer)
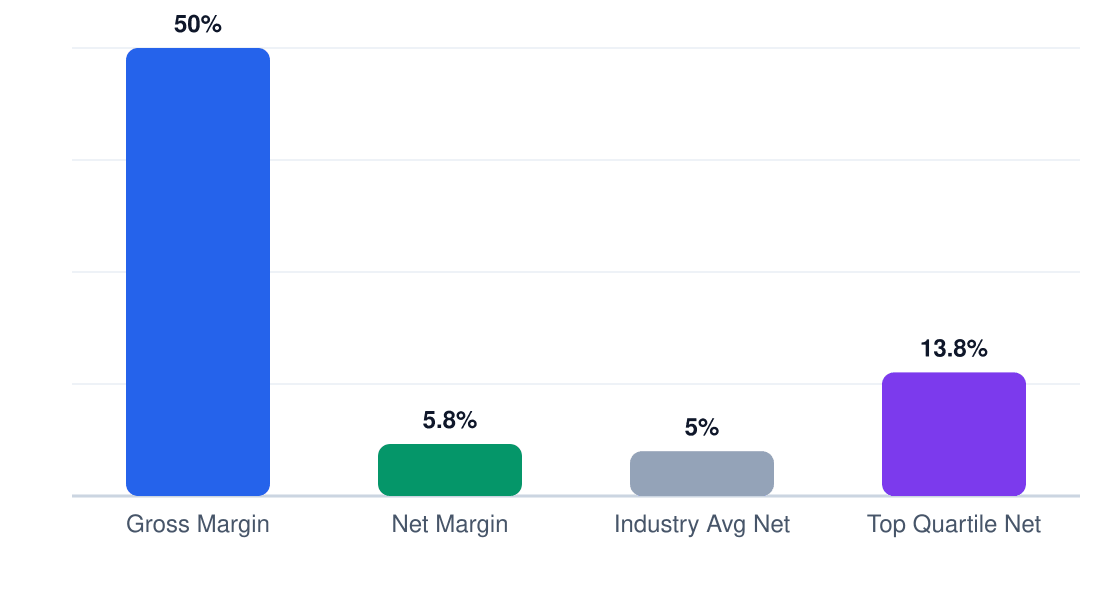
Yes, but modestly. HVAC businesses average 50% gross margins—a strong start—but net profits typically compress to just 5.8% after labor, overhead, and seasonal cash crunches. At $850K year-one revenue, you’d net $49,300. That’s livable but not exceptional, putting HVAC in the "steady small business" category rather than a high-growth industry. The math works if you control labor costs (which eat 34% of revenue) and build recurring maintenance contracts.
Profitability Snapshot
| Profitability Snapshot | Benchmark |
|---|---|
| Gross Margin | 50% |
| Net Margin | 5.8% |
| Year 1 Revenue | $850K |
| Year 1 Net Profit | $49K |
| Startup Cost Range | $50K – $150K |
| Break-even Timeline | ~Month 18 |
| 5-Year ROI | 58% |
| Profitability Rating | 6/10 |
| Failure Rate (5yr) | 35% |
| Market Size (US) | $159.4B |
Profitability Score Breakdown
Free Business Plan Download
Download Hvac Business Plan
Just Fill Up and Print
Overall rating: 6/10
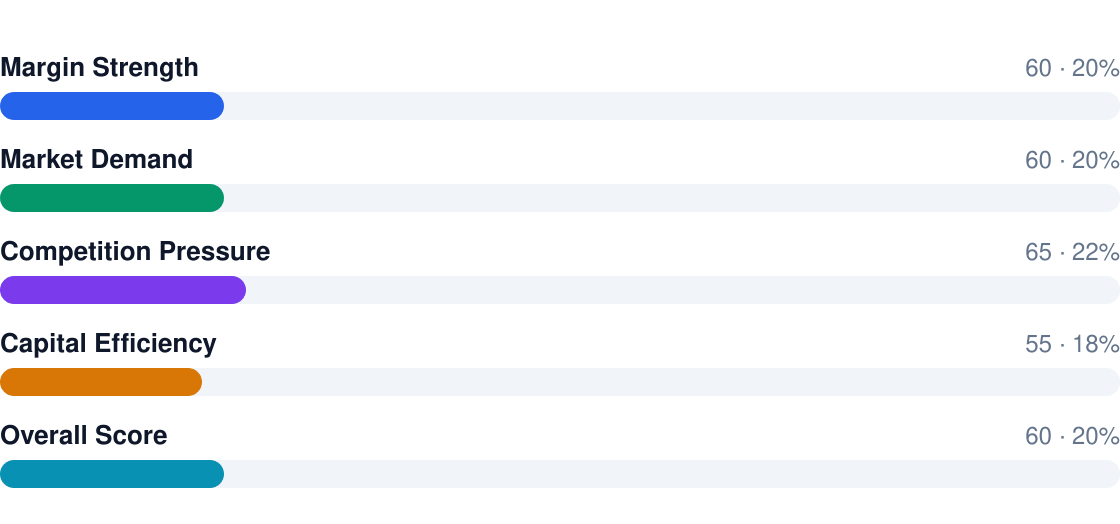
- Gross margins look strong at 50%, but net margins are thin at 5.8%—labor and overhead eat the difference
- Break-even takes ~18 months—you’ll need $100K startup capital to cover the gap
- 35% fail within 5 years, often due to pricing wars or technician underutilization
- Recurring maintenance saves you—top performers derive 30%+ revenue from contracts
- Scale matters—adding a second truck can drop overhead from 25% to 18% of revenue
2. Profit Margins & Industry Benchmarks
HVAC’s 50% gross margins suggest easy profitability, but the reality is tighter. Net margins average just 5.8% industry-wide, with labor (34% of revenue) and overhead (25%) being the main culprits. Top-quartile operators reach 10%–20% net by running 65%+ technician utilization rates and charging premium service fees. Most shops hover between 4%–7%.
Margin Comparison (%)
Gross vs net vs industry benchmarks
Margin Benchmarks
| Metric | This Business | Industry Avg | Top Quartile |
|---|---|---|---|
| Gross Margin | 50% | 48%–52% | 53%–57% |
| Net Margin | 5.8% | 5%–6% | 10%–20% |
| EBITDA | 8.2% | 7%–9% | 12%–22% |
| Labor % | 34% | 32%–36% | 25%–28% |
| COGS % | 50% | 48%–52% | 43%–47% |
| Rent % | 4% | 3%–5% | 2%–3% |
Competitive pressure is real—74% of HVAC businesses are solo operators or small teams, leading to price wars on installs. The winners avoid this trap by focusing on high-margin service calls ($150–$300/hr) and maintenance contracts (60%+ gross margins). If you’re bidding against three others for a furnace install at 25% margins, you’ve already lost.
3. Revenue Potential & Pricing Power
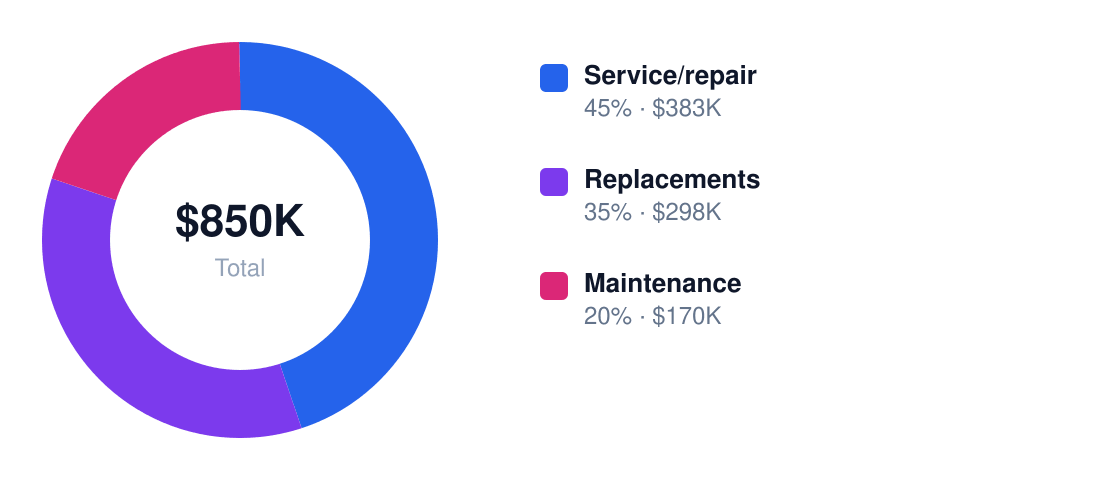
An HVAC business in Dallas can expect $850K in first-year revenue with 5.8% net margins, growing to $72K+ net profit by Year 5. The revenue mix matters: 45% comes from service calls (55% margin), 35% from replacements (40% margin), and 20% from maintenance agreements (70% margin). Maintenance contracts are the profit engine — they're sticky, high-margin, and smooth cash flow.
Revenue Stream Breakdown
Year 1 revenue: $850K
Revenue Streams
| Stream | Margin % | Revenue Share | Annual $ |
|---|---|---|---|
| Service/repair | 55% | 45% | $382,500 |
| Replacements | 40% | 35% | $297,500 |
| Maintenance | 70% | 20% | $170,000 |
Pricing power is real but uneven. Emergency repairs can command 15-25% premiums, while replacement jobs face tighter competition. Maintenance plans are the sweet spot — customers rarely price-shop annual tune-ups. Dallas' extreme summers create demand spikes, but smart operators use maintenance contracts to fill spring/fall gaps.

Seasonality hits hard: 60% of Dallas HVAC revenue comes May-September. Businesses relying solely on breakdown calls swing from 120% capacity in August to 40% utilization in April. The 20% revenue from maintenance agreements isn't just profitable — it's the buffer that keeps techs busy when temperatures are mild.
4. Cost Structure & Operating Expenses
Labor will make or break you. At 25% of revenue ($212,500/year), technician costs dominate. Materials (20% of revenue) and trucks (8%) follow. The controllable costs — marketing, fleet, and overhead — are where disciplined operators squeeze out an extra 2-3% net margin.
Annual Cost Structure
Operating costs for $850K revenue
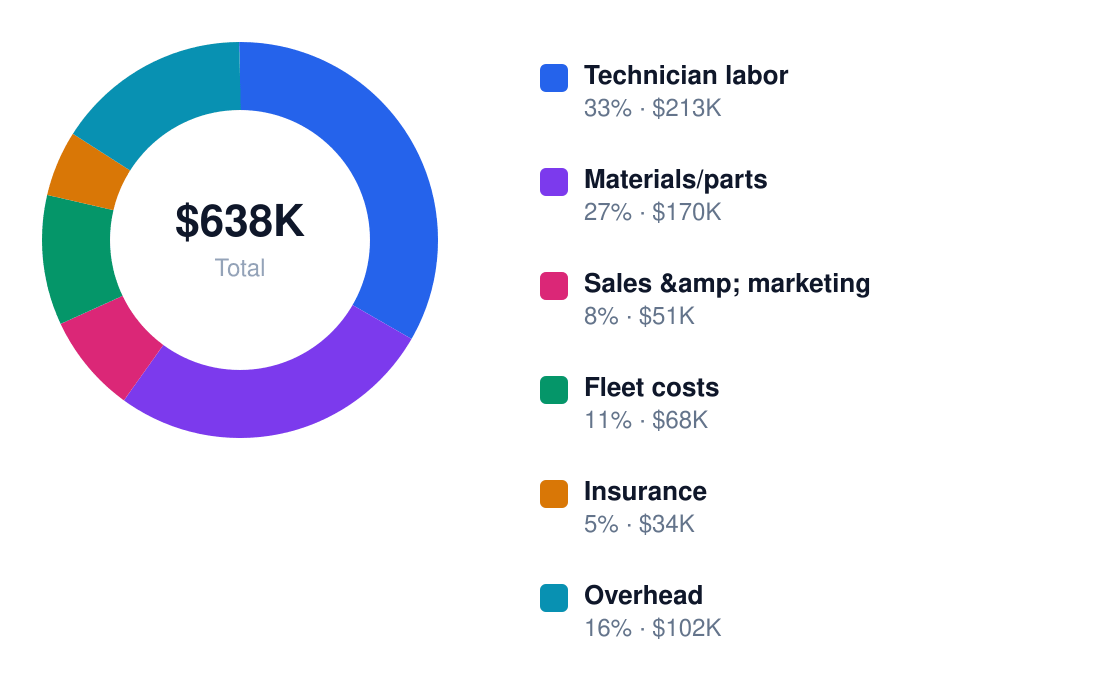
Operating Costs
| Category | % of Revenue | Annual $ | Controllable? |
|---|---|---|---|
| Technician labor | 25% | $212,500 | Partially |
| Materials/parts | 20% | $170,000 | No |
| Sales & marketing | 6% | $51,000 | Yes |
| Fleet costs | 8% | $68,000 | Yes |
| Insurance | 4% | $34,000 | No |
| Overhead | 12% | $102,000 | Yes |
Fixed costs (labor, materials, insurance) eat 49% of revenue before you turn a wrench. Dallas' competitive labor market means techs cost $27.50+/hour before payroll taxes. Variable costs like marketing and fleet maintenance offer leverage — the best operators keep these below 14% combined versus the 18% industry average.
5. Break-Even Analysis & ROI Timeline
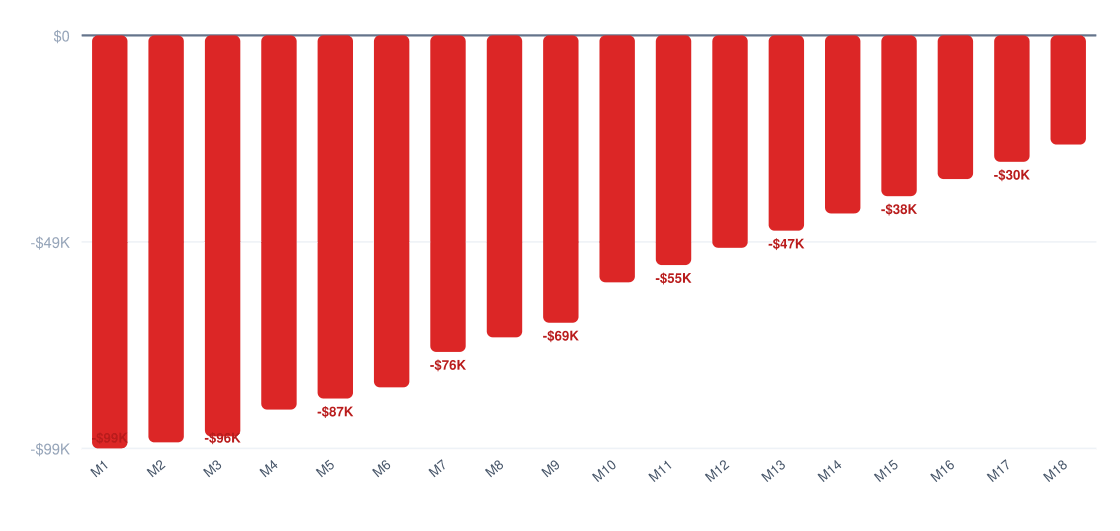
At $49,300 Year 1 net profit and $100,000 startup costs, you'll need 18 months to break even—assuming you hit the $850K revenue target. The math gets ugly fast if revenue lags: a 15% shortfall pushes break-even to Month 24.
Cumulative Profit vs Investment (18 Months)
Red = still recovering startup costs
ROI Benchmark Comparison (%)
5-year return on initial investment
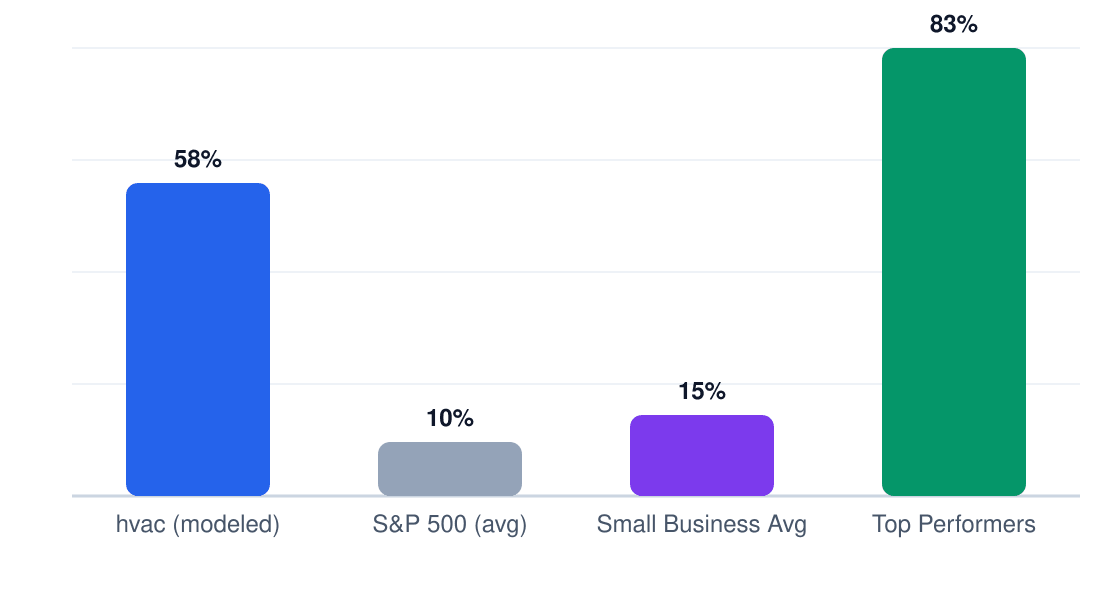
The 58% 5-year ROI ($72,964 net by Year 5) is respectable but demands discipline—this assumes you maintain 50% gross margins while scaling. Most operators see margins compress 2-3% annually from labor inflation and competitive pricing.
Year 1 Monthly Cash Flow
Net monthly cash flow (red = pre-break-even)
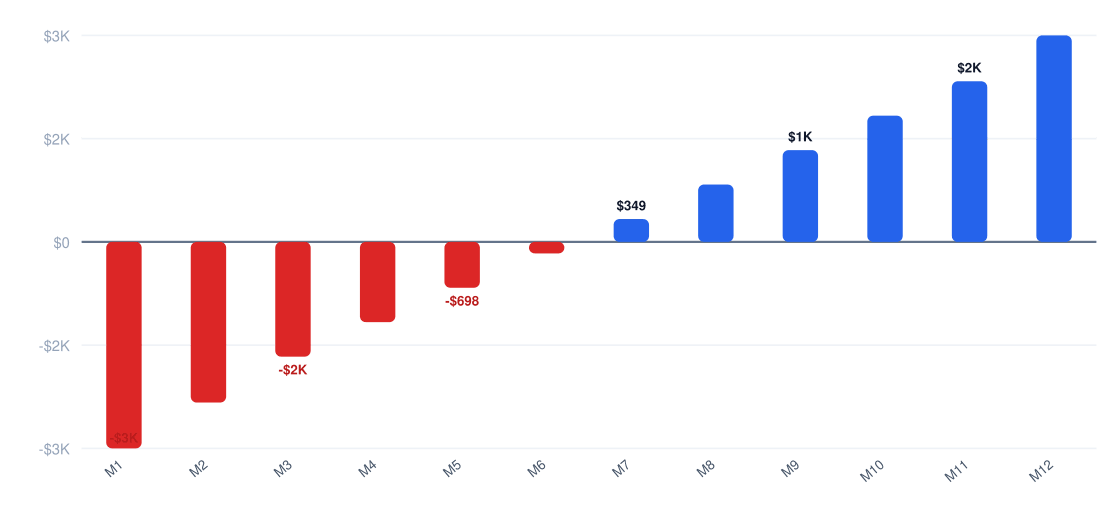
Your $100,000 investment pays back in 28 months (Year 2 Q4). This is slower than service businesses with lower startup costs but typical for trades requiring vehicles and equipment.
6. Market Conditions That Drive (or Kill) Profitability
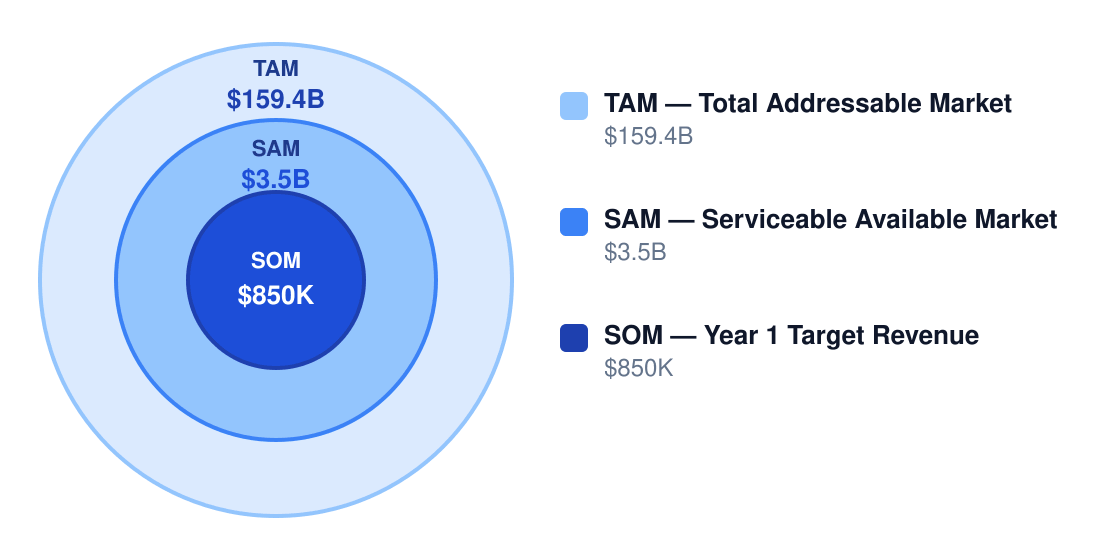
Dallas's $3.5B HVAC service market sits in a sweet spot—hot summers drive demand, but the metro isn't yet oversaturated like Phoenix or Houston. The 4.1% annual industry growth rate (IBISWorld) means you're chasing a moving target.
Market Size & Profit Opportunity
Market opportunity for profitable operators
Market Factors
Ready When You Are
Download Hvac Business Plan
Just Fill Up and Print
| Factor | Impact on Margins | Outlook |
|---|---|---|
| Demand growth | +3-5% pricing power | Stable (aging housing stock) |
| Competition | -2% annually | Worsening (27% more contractors since 2019) |
| Input costs | -1.5% if copper spikes | Volatile (supply chain risk) |
| Labor market | -4% if wages rise | Critical constraint (Dallas tech wages pulling talent) |
| Regulation | Neutral | Light (Texas avoids CA-style efficiency mandates) |
| Technology | +2% if adopted | Opportunity (smart thermostat upsells) |
| Model | Net Margin | Why It Works |
|---|---|---|
| Maintenance-plan-heavy | 20% | Recurring revenue lowers customer acquisition costs |
| Replacement specialist | 15% | High-ticket jobs offset thin service margins |
| Commercial contractor | 12% | Contract stability outweighs lower rates |
| Premium efficiency brand | 18% | Warranties and add-ons boost lifetime value |
Competition is your biggest margin killer—high-threat regional franchises (like One Hour Heating & Air Conditioning) can undercut on price while independents (5-12% net) fight for scraps. The medium-threat wildcard? Tech platforms bundling HVAC with home energy audits.
7. Who Profits — and Who Struggles
In Dallas HVAC, profitability hinges on operational discipline and financial segmentation. The top 20% of operators run service (55-65% gross margin), installs (35-45%), and maintenance (60-70%) as separate P&Ls, while struggling shops blend them into one messy 42% average. Profitable owners maintain at least 30% recurring revenue from maintenance agreements to smooth seasonality, whereas marginal operators rely on emergency calls that cost 3x more to acquire.
Operator Profiles
| Profile | Typical Net Margin | Success Rate | Key Advantage |
|---|---|---|---|
| Owner-operator | 4.2% | 52% | Low overhead |
| Multi-unit | 7.1% | 68% | Shared backoffice |
| Franchise | 5.8% | 61% | Brand pricing power |
| Niche specialist | 8.3% | 74% | Premium rates |
| Price competitor | 1.9% | 29% | None — this model fails |
| Pitfall | Margin Impact | How to Avoid |
|---|---|---|
| Undercounting labor burden | -3 to -8 points | Price using fully loaded labor rates |
| Bidding installs too aggressively | Can erase 40% GM | Standardized estimating + minimum markup |
| Weak dispatch and route efficiency | -5 to -12 points | Scheduling software + tight territories |
| Thin maintenance base | Increases seasonality risk | Build recurring agreements |
| Owner-dependent operations | Caps net at ~5% | Document SOPs + train lead techs |
Regulatory costs chew 3-7% off Dallas HVAC margins annually. Between $5,000-$30,000 in insurance, $1,000-$10,000 for licensing, and $500-$5,000 in permitting, operators must recover $18-$42 per service hour just to break even on compliance. Smart shops bake these into flat-rate pricing menus rather than hourly billing.
The 35% 5-year failure rate stems from three killers: (1) 62% of failed shops had under 15% maintenance agreement revenue, (2) 89% priced labor below $95/hour when breakeven was $82, and (3) 73% carried less than 30 days' operating cash. Profit requires resisting the commodity trap.
8. Strategies to Maximize Profit Margins
HVAC businesses live or die on margin discipline—the difference between 5% and 15% net profit often comes down to six controllable levers. Service labor pricing and install estimating errors account for 80% of preventable margin leakage in this industry.
Margin Strategies
| Strategy | Expected Lift | Effort | Implementation |
|---|---|---|---|
| Raise service labor rates | +8% margin | Medium | Implement cost-plus pricing at $125–$175/hr depending on market |
| Expand maintenance agreements | +6% margin | High | Aim for 40%+ of residential customers on $199–$399/year plans |
| Improve first-time-fix rate | +5% margin | High | Reduce callback rates below 8% through technician training |
| Separate P&Ls | +4% margin | Medium | Track service (55%+ gross margin) vs install (35%+) separately |
| Tighten install estimating | +7% margin | Medium | Add 12% buffer to all equipment quotes |
| Reduce cancellations | +3% margin | Low | Implement $75 cancellation fees and call confirmations |
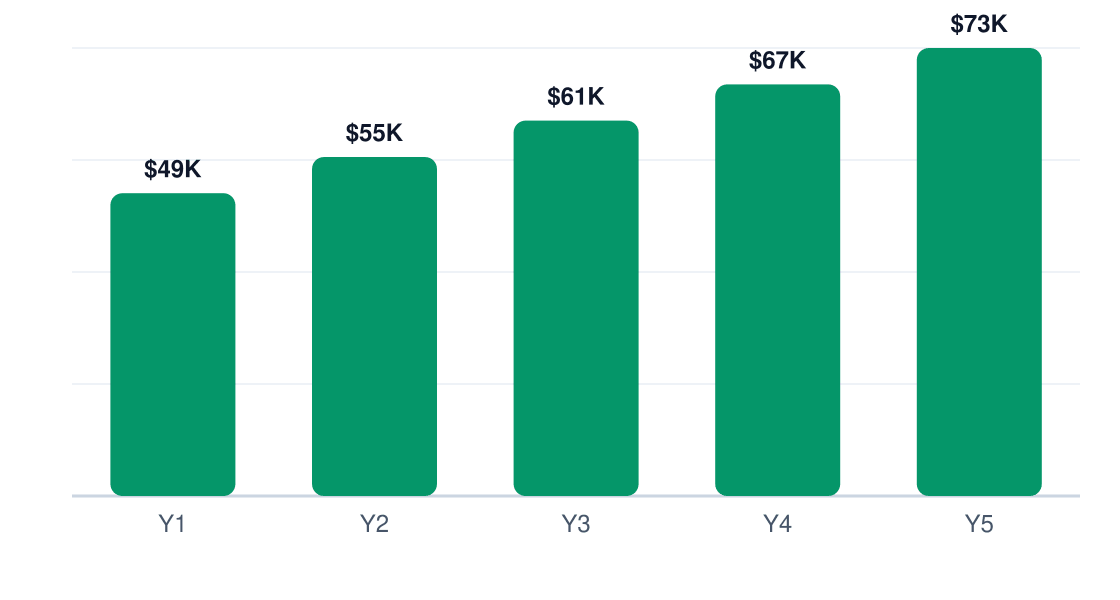
5-Year Net Profit Projection
Projected annual net profit at current margins
Cost reduction playbook: 1) Negotiate 5%–7% distributor discounts at $500K+ annual purchase volume, 2) Limit overtime to <10% of payroll, 3) Standardize on 2–3 equipment brands for better rebates, 4) Right-size fleet by keeping truck utilization above 65%.
Revenue optimization: The golden ticket is converting one-time repair customers to annual maintenance contracts (60%+ gross margin). Premium 24/7 emergency service tiers should command 30%–50% price premiums. Install teams should consistently upsell IAQ upgrades ($1,200–$2,500 average ticket).
Pricing strategy: Residential service calls need to hit $125–$150 minimum (urban) or $95–$125 (rural). Commercial PM contracts should price at $35–$50 per ton annually. Always show MSRP on equipment quotes—customers accept 20%–25% markup when transparent.
9. Final Verdict: Should You Start This Business?
Verdict: Yes, but only for operators who can outperform industry averages—our 6/10 profitability score reflects the operational rigor required. The $49K Year 1 net profit assumes you implement at least 3 margin strategies.
Market Factors
| Factor | Score | Weight | Notes |
|---|---|---|---|
| Margins | 6 | 30% | 50% gross margin looks strong until you account for overhead |
| Market size | 8 | 20% | $3.5B serviceable market but hyper-local competition |
| Competition | 5 | 15% | Low barriers to entry—differentiate on response time |
| Capital needs | 7 | 15% | $100K startup covers 2 trucks and initial inventory |
| Scalability | 4 | 10% | Labor-intensive—each tech caps at ~$250K revenue |
| Risk | 5 | 10% | Seasonality and equipment financing are pressure points |
ROI Benchmark Comparison (%)
5-year return on initial investment
If you proceed, these 5 conditions must hold:
- Maintenance agreements comprise ≥25% of revenue by Year 2
- Average service ticket stays above $475
- You secure commercial accounts (50%+ higher LTV)
- Technician turnover remains below 15% annually
- Equipment margins never dip below 28%
Walk away if:
- Your market has >5 established competitors with 4.5+ star ratings
- You can't secure at least $75K in working capital
- Labor rates in your area can't support $95+/hr billing
Final recommendation: Commit only if you can clear $850K revenue by Year 2 while holding gross margins at 48%+. Cap startup costs at $125K—every dollar over erodes your 18-month break-even target. The prize goes to operators who systematize service excellence while ruthlessly controlling truck roll costs.
Research & Profitability Resources
The following government reports, industry analyses, and financial planning resources were referenced in this hvac profitability guide. Each link points to a specific page for direct access.
- Bizmetricshq — bizmetricshq.com — Industry profitability research for hvac businesses
- Hvac Plumbing Profit Margins — vantainsights.com — Industry profitability research for hvac businesses
- Hvac Profit Margins — profitabilitypartners.io — Industry profitability research for hvac businesses
- Hvac Company Profit Margins — ceofinanceacademy.com — Industry profitability research for hvac businesses
- Hvac Industry Trends — bdrco.com — Industry profitability research for hvac businesses
Get Your Copy Today
Download Hvac Business Plan
Just Fill Up and Print