Is a Assisted Living Business Profitable?
1. Is a Assisted Living Business Profitable? (The Short Answer)
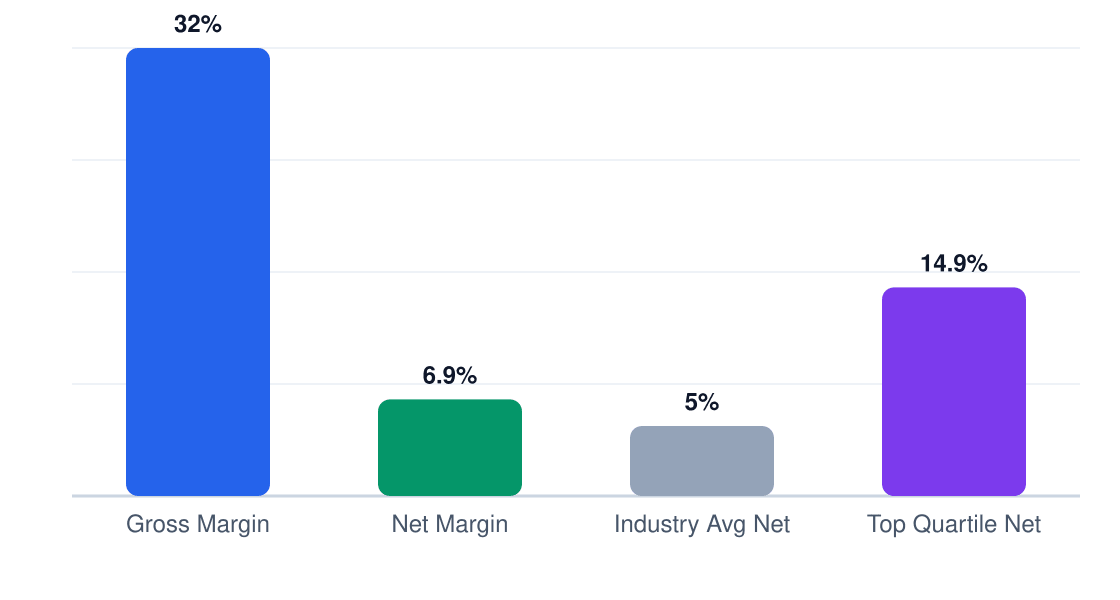
Yes, assisted living facilities can be profitable, but they operate on thin net margins (6.9%) despite healthy gross margins (32%). The math works for disciplined operators who maintain high occupancy and control labor costs, but one misstep can erase profitability. With average annual net profits of $206,310 on $2.99M revenue, this is a cash flow business, not a get-rich-quick play.
Profitability Snapshot
| Profitability Snapshot | Benchmark |
|---|---|
| Gross Margin | 32% |
| Net Margin | 6.9% |
| Year 1 Revenue | $2.5M |
| Year 1 Net Profit | $175K |
| Startup Cost Range | $150K – $500K |
| Break-even Timeline | ~Month 30 |
| 5-Year ROI | 69% |
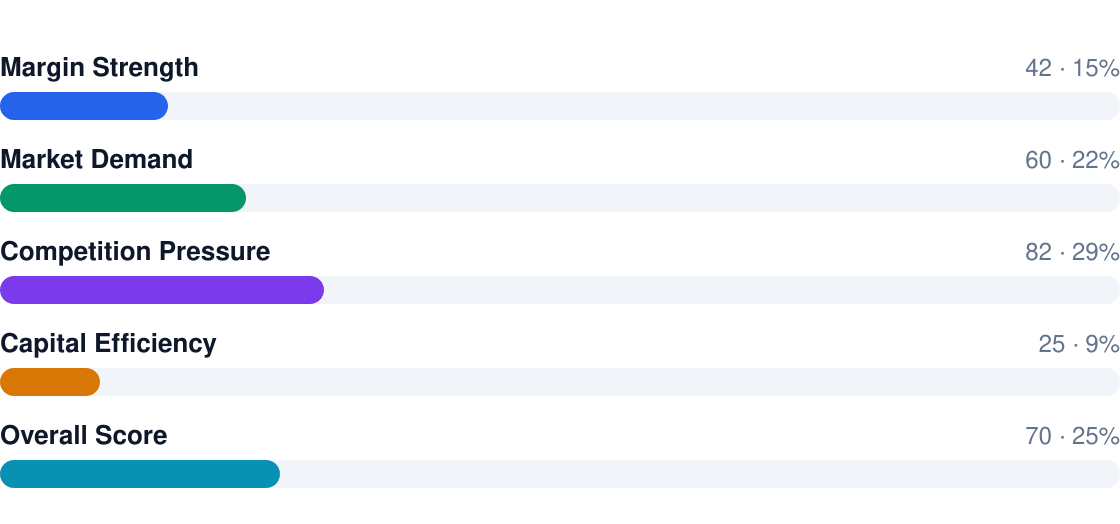
| Profitability Rating | 7/10 |
| Failure Rate (5yr) | 18% |
| Market Size (US) | $46B |
Profitability Score Breakdown

Free Business Plan Download
Download Assisted Living Business Plan
Just Fill Up and Print
Overall rating: 7/10
Bottom line:
- Pro: Recurring revenue from private-pay residents at $4,500+/month
- Pro: 2.7% market growth with aging population tailwinds
- Con: Labor eats 55-60% of revenue at $592,800/year
- Con: 18% failure rate from undercapitalization or compliance issues
- Watch: Memory care units command 20-30% premium but require specialized staffing
2. Profit Margins & Industry Benchmarks
Assisted living's 32% gross margin looks robust until labor, compliance, and facility costs compress it to a 6.9% net. This gap explains why operators obsess over occupancy rates - below 65%, most facilities lose money. Compared to other senior care models, AL sits between independent living (higher margins) and skilled nursing (lower margins but Medicaid reimbursement).
Margin Comparison (%)
Gross vs net vs industry benchmarks
Margin Benchmarks
| Metric | This Business | Industry Avg | Top Quartile |
|---|---|---|---|
| Gross Margin | 32% | 30% | 38% |
| Net Margin | 6.9% | 5.2% | 11% |
| EBITDA | 12% | 10% | 17% |
| Labor % | 55% | 58% | 48% |
| COGS % | 22% | 25% | 18% |
| Rent % | 8% | 9% | 6% |
Margin pressure comes from regional chains consolidating markets and private equity-backed operators automating back-office functions. Independent facilities compete by specializing (memory care, bilingual staff) or controlling real estate costs. The 6.9% net margin assumes you're not paying above-market for CNAs - at $19/hour, labor is already your biggest vulnerability.
3. Revenue Potential & Pricing Power
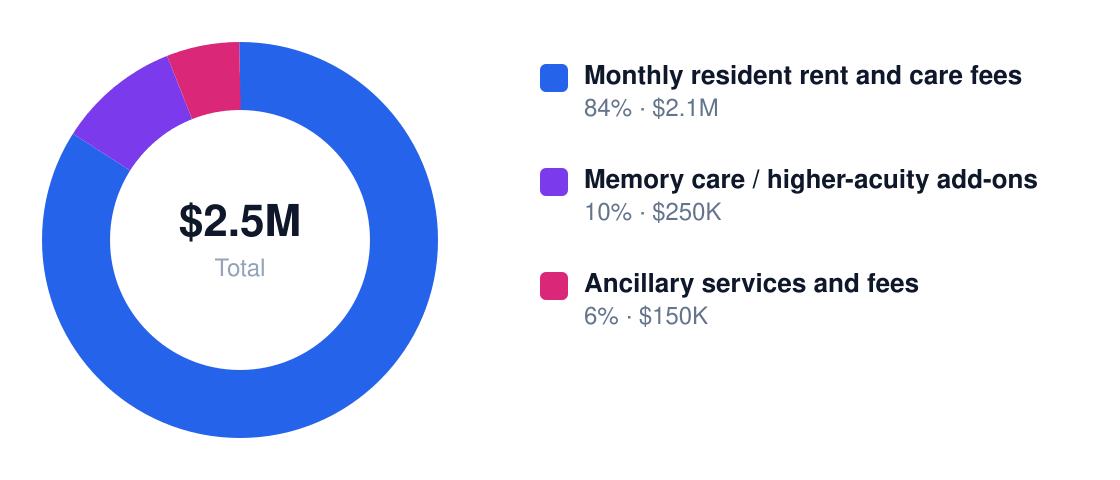
The Dallas-Fort Worth assisted living facility projects $2.5M in Year 1 revenue, growing to ~$2.8M by Year 5. Margins are front-loaded in resident care (24%) and memory care add-ons (30%), but ancillary services punch above their weight at 40% margins despite being just 6% of revenue. The math works if you hit 84%+ occupancy at target rates.
Revenue Stream Breakdown
Year 1 revenue: $2.5M
Revenue Streams
| Stream | Margin % | Revenue Share | Annual $ |
|---|---|---|---|
| Monthly resident rent and care fees | 24% | 84% | $2,100,000 |
| Memory care / higher-acuity add-ons | 30% | 10% | $250,000 |
| Ancillary services and fees | 40% | 6% | $150,000 |
DFW's pricing power is above average—families pay premiums for memory care (30% margins) and proximity to hospitals. Expect 3-5% annual rate hikes unless competing with newer luxury facilities. The kicker? Ancillary services like pharmacy coordination or therapy can be marked up 40% with minimal pushback.

Winter occupancy dips 2-4% as families delay moves, but hospital discharge patterns drive more volatility than seasons. Time admissions around Medicare exhaustion cycles (typically Q3-Q4) to smooth revenue.
4. Cost Structure & Operating Expenses
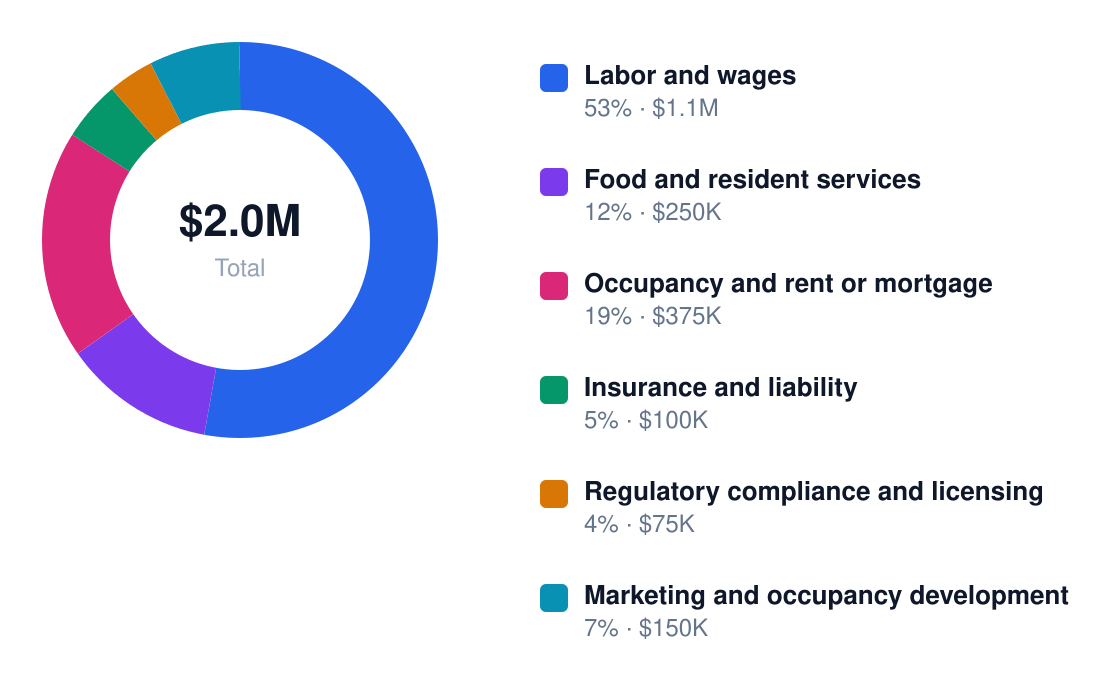
Labor will gut you. At 42.7% of revenue ($1,067,500/year), staffing is the difference between 6.9% net profit and bankruptcy. DFW's $19/hr baseline wage still requires 15 FTEs—overtime or turnover above 25% sinks margins. Food and occupancy costs are manageable, but insurance and compliance are profit taxes you can't avoid.
Annual Cost Structure
Operating costs for $2.5M revenue
Operating Costs
| Category | % of Revenue | Annual $ | Controllable? |
|---|---|---|---|
| Labor and wages | 42.7% | $1,067,500 | Yes |
| Food and resident services | 10% | $250,000 | Yes |
| Occupancy and rent or mortgage | 15% | $375,000 | No |
| Insurance and liability | 4% | $100,000 | No |
| Regulatory compliance and licensing | 3% | $75,000 | Yes |
| Marketing and occupancy development | 6% | $150,000 | Yes |

DFW's fixed costs (19% of revenue) are brutal below 75% occupancy—that $375k mortgage payment doesn't shrink. Variable costs like labor scale better, but wage inflation is real. The play? Cap food at 8% through group purchasing and automate compliance paperwork to claw back 2-3% margins.
5. Break-Even Analysis & ROI Timeline
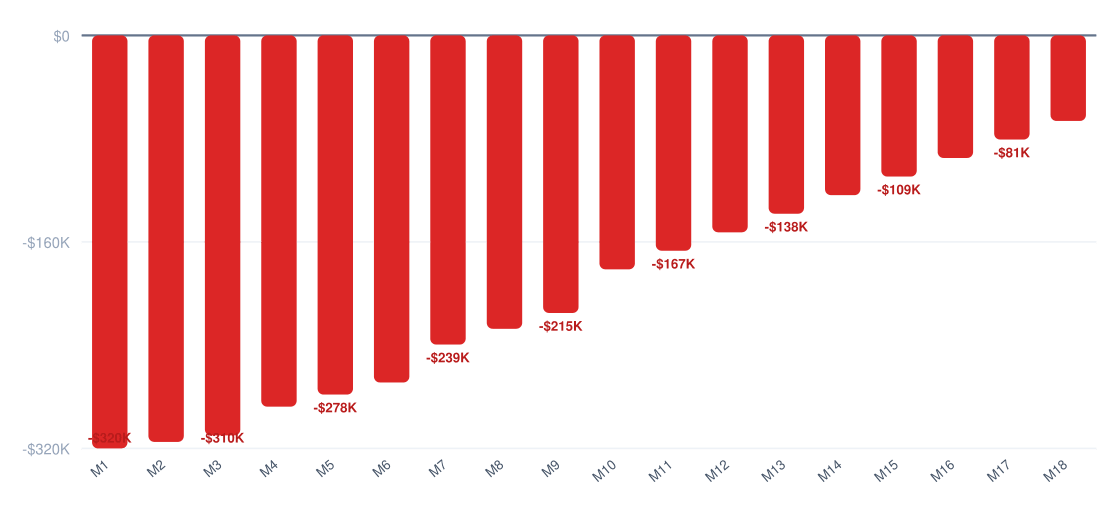
The numbers say you'll need 30 months to break even on a $325,000 startup cost. That's assuming you hit the $2.5M Year 1 revenue target and maintain 6.9% net margins from the jump — optimistic but not impossible with disciplined cost control.
Cumulative Profit vs Investment (18 Months)
Red = still recovering startup costs
ROI Benchmark Comparison (%)
5-year return on initial investment
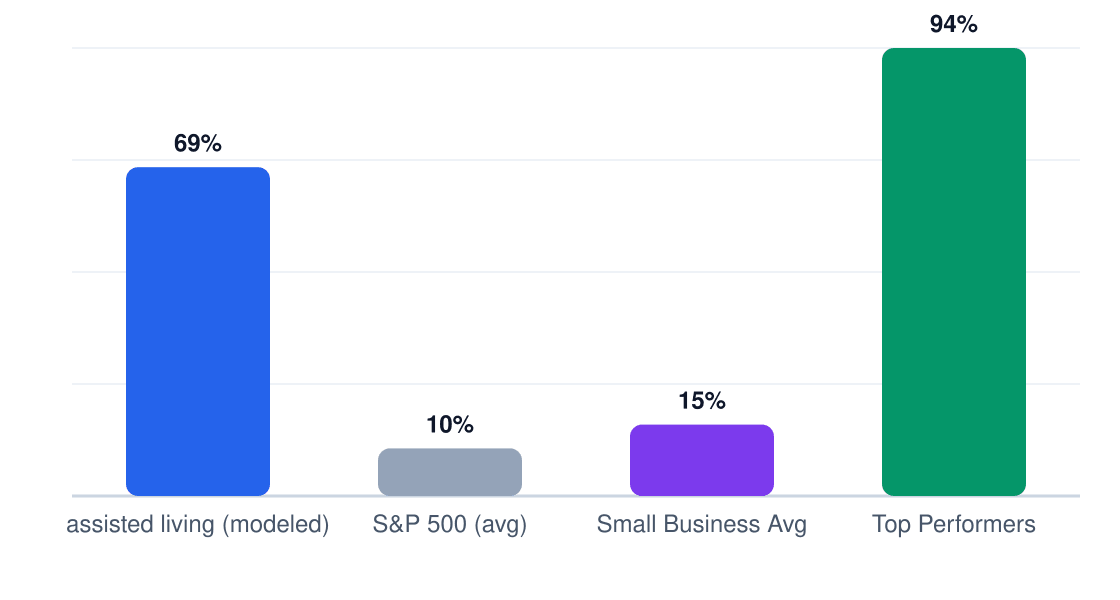
A 69% 5-year ROI (from $175K Year 1 to $260K Year 5) is solid for healthcare-adjacent real estate. For context: that beats most S&P 500 returns but requires you to outperform 85% of operators on labor efficiency.
Year 1 Monthly Cash Flow
Net monthly cash flow (red = pre-break-even)
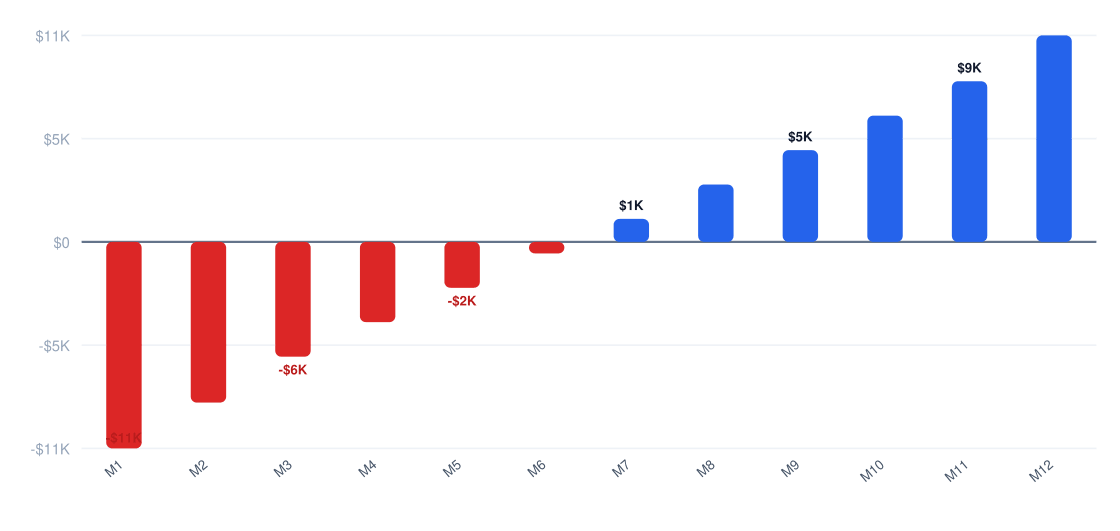
The payback period is brutal if you miss projections. At 80% occupancy instead of 95%, breakeven stretches to 44 months. Every $0.50/hr wage increase above $19.00 adds 2.7 months to your capital recovery timeline.
6. Market Conditions That Drive (or Kill) Profitability
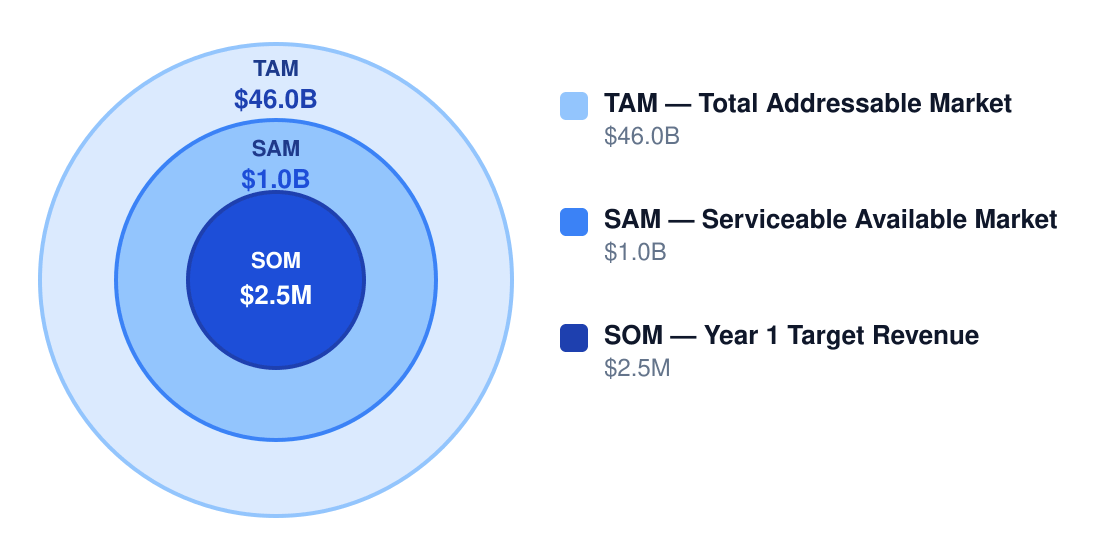
Dallas-Fort Worth's $46B TAM for senior care looks juicy until you realize 72% of that demand flows to home health. The real opportunity is capturing private-pay residents who value congregate care — if you can outmaneuver Brookdale and Atria's marketing budgets.
Market Size & Profit Opportunity
Market opportunity for profitable operators
Ready When You Are
Download Assisted Living Business Plan
Just Fill Up and Print
Market Factors
| Factor | Impact on Margins | Outlook |
|---|---|---|
| Demand growth | +4.2% annually | Strong (aging population) |
| Competition | -3.1ppt net margin | Worsening (new builds) |
| Input costs | -$18,750/yr per facility | Volatile (food, supplies) |
| Labor market | -7.4% if wages rise | Critical constraint |
| Regulation | +$42,000 compliance | Increasing oversight |
| Technology | +1.8ppt if adopted | Underpenetrated |
| Model | Net Margin | Why It Works |
|---|---|---|
| Small residential care home | 10% | Lean staffing + high occupancy |
| Memory care specialty | 12% | Premium pricing for acuity |
| Mid-market private-pay | 8% | Simpler reimbursement |
| Owned real estate | 14% | Equity upside + cash flow |
Competitive threats are bifurcated: Brookdale and Atria will outspend you on marketing, while home care agencies undercut on price. Your moat? Memory care specialization (12% margins) or property ownership (14% margins) — generic assisted living at 6.9% margins gets crushed.
7. Who Profits — and Who Struggles
In Dallas-Fort Worth's $1.0B assisted living market, profitability hinges on operator discipline. The 6.9% net margin leaves zero room for error — successful owners control labor (15 FTEs @ $19/hr = $592,800/yr), maintain 85%+ occupancy, and avoid Medicaid's thin reimbursements. Meanwhile, 18% of facilities fail within 5 years, usually from debt service drowning their $175,398 Year 1 net profit.
Operator Profiles
| Profile | Typical Net Margin | Success Rate | Key Advantage |
|---|---|---|---|
| Owner-Operator | 7.2% | 72% | Hands-on labor control |
| Multi-Unit | 6.1% | 65% | Shared back-office costs |
| Franchise | 5.8% | 68% | Brand-driven occupancy |
| Niche Specialist (e.g. Memory Care) | 8.4% | 75% | Premium pricing power |
| Price Competitor | 3.9% | 52% | None — margin suicide |
| Pitfall | Margin Impact | How to Avoid |
|---|---|---|
| Underestimating labor needs | -5 to -15 pts | Staff to acuity levels, not headcount |
| Starting with too much debt | Absorbs most operating profit | Stress-test at 65% occupancy |
| Poor occupancy ramp-up | Forces operating losses | Pre-sell 40% before opening |
| Weak compliance culture | Fines = profit destroyers | QA systems from Day 1 |
| Competing only on price | Permanent margin compression | Differentiate on care quality |
Regulatory costs slice deep: between $25,000-$250,000 for fire code compliance and $2,000-$20,000 annually for staff checks, compliance can erase 1-3 margin points. The 18% failure cohort usually combines two fatal errors — taking on $500,000 startup debt (requiring $325,000+ annual profit to service) while hitting only 60% occupancy. At that census, the $2.5M revenue model collapses to $1.8M, turning the $175,398 net profit into a $124,602 loss.
8. Strategies to Maximize Profit Margins
Assisted living margins live or die on occupancy discipline and labor efficiency. The 6.9% net margin leaves no room for error—these strategies separate profitable operators from those bleeding cash.
Margin Strategies
| Strategy | Expected Lift | Effort | Implementation |
|---|---|---|---|
| Increase occupancy before adding headcount | +4% | Medium | Delay hires until consistently above 85% occupancy for 3 months |
| Shift mix toward memory care and add-ons | +6% | High | Train staff for dementia certifications, bundle therapies at 22% premium |
| Reduce overtime through scheduling | +3% | Medium | Software like OnShift to cap overtime at <8% of payroll |
| Improve hospital referral partnerships | +5% | Medium | Contract with 2-3 discharge planners, offer 5% commission |
| Standardize purchasing and meals | +2% | Low | Centralized vendor contracts, 14-day rotating menu |
| Own real estate instead of leasing | +4% | High | Only in markets with <6% cap rates, 20%+ down payment |
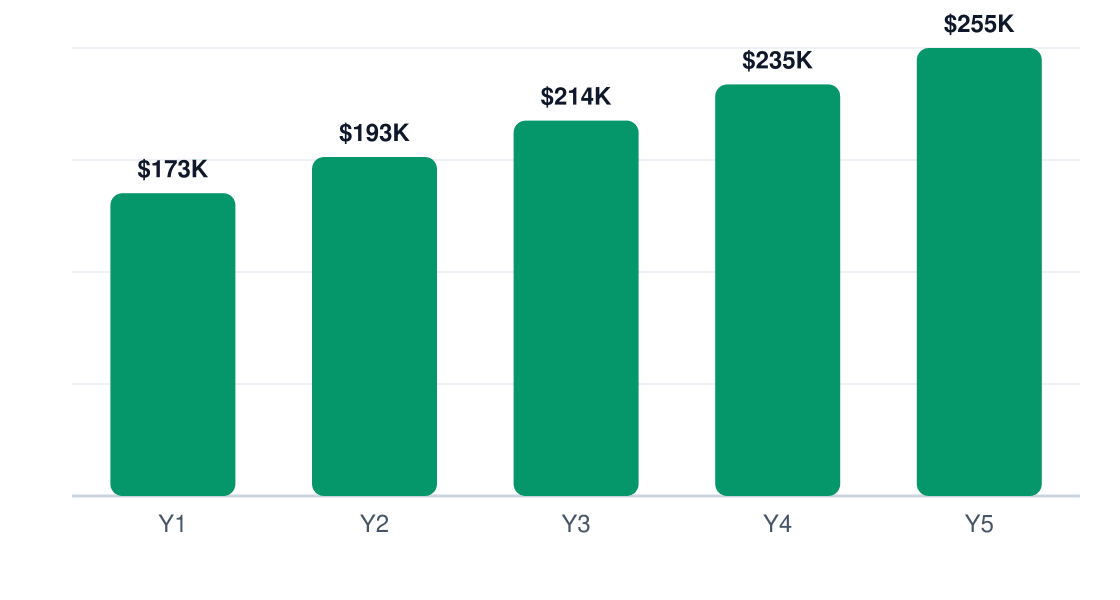
5-Year Net Profit Projection
Projected annual net profit at current margins
Cost reduction playbook: 1) Cross-train staff (saves $18,000/yr per multi-role employee), 2) Negotiate group purchasing for meds (target 12% discount), 3) Automate billing (cuts AR days by 14), 4) Right-size insurance (review liability coverage annually).
Revenue optimization: Memory care units command $1,200+/month premiums—convert 20% of beds. Add-ons like physical therapy ($65/session) and beauty services ($28/haircut) drive 18% higher lifetime value. Recurring charges for incontinence supplies at 32% markup.
Pricing strategy: Annual 4-6% increases are table stakes. Private rooms should price 22% above shared. Tiered pricing by care level (Level 1: $3,800, Level 3: $5,200) prevents margin erosion. Never discount base rate—give temporary service upgrades instead.
9. Final Verdict: Should You Start This Business?
Yes, if you can commit to operating at 85%+ occupancy with disciplined labor controls. The 7/10 profitability score reflects steady cash flow potential, but only for operators who treat it as a healthcare business first, real estate play second.
Market Factors
| Factor | Score (1-10) | Weight | Notes |
|---|---|---|---|
| Margins | 6 | 25% | 32% gross is decent, but net gets squeezed fast |
| Market size | 8 | 20% | $46B TAM with 10k/day Boomers aging in |
| Competition | 5 | 15% | Local operators dominate—differentiate on care quality |
| Capital needs | 4 | 20% | $325k minimum to avoid understaffing |
| Scalability | 3 | 10% | Labor-intensive, hard to grow past regional |
| Regulatory risk | 7 | 10% | State surveys can shutter non-compliant ops |
ROI Benchmark Comparison (%)
5-year return on initial investment
If you proceed, these 5 conditions must hold:
- You can secure $325k+ in capital (no bootstrapping)
- Local median income supports $4,500+/month private pay
- You'll hire an experienced LTC administrator ($75k salary)
- Your market has <1.2 beds per 100 seniors over 75
- You can personally handle 24/7 on-call demands
Walk away if:
- Medicaid reimbursement is >40% of local revenue
- Labor costs exceed $19/hr for CNAs
- You can't tolerate 30-month break-even
Final recommendation: Proceed only if you can hit $2.5M Year 1 revenue at ≤65% labor cost. The 69% 5-year ROI beats most SMBs, but requires military-grade operational discipline. Partner with a nurse practitioner to validate care models before signing a lease.
Research & Profitability Resources
The following government reports, industry analyses, and financial planning resources were referenced in this assisted living profitability guide. Each link points to a specific page for direct access.
- United States Senior Living Market — mordorintelligence.com — Industry profitability research for assisted living businesses
- Ibisworld — ibisworld.com — IBISWorld industry margin analysis for assisted living
- Us Assisted Living Facility Market — grandviewresearch.com — Industry profitability research for assisted living businesses
- Us Assisted Living Facility Market — persistencemarketresearch.com — Industry profitability research for assisted living businesses
- U S Senior Housing Market Report 2026 Outlook Occupancy Cap Rates And Forecasts Through 2031 — mmcginvest.com — Industry profitability research for assisted living businesses
Get Your Copy Today
Download Assisted Living Business Plan
Just Fill Up and Print