Is a Banquet Hall Business Profitable?
1. Is a Banquet Hall Business Profitable? (The Short Answer)
A banquet hall business can be profitable in the US, but only when utilization stays high and packages are priced well. Typical operators achieve 35% gross margins and 15% net margins, earning $45,000 annual net profit on $300,000 revenue. The math works if you hit 65%+ weekend occupancy and control labor costs—but 45% of operators fail within 5 years.
Profitability Snapshot
| Metric | Benchmark |
|---|---|
| Gross Margin | 35% |
| Net Margin | 15% |
| Year 1 Revenue | $300K |
| Year 1 Net Profit | $45K |
| Startup Cost Range | $100K – $1.0M |
| Break-even Timeline | ~Month 36 |
| 5-Year ROI | 75% |
| Profitability Rating | 6/10 |
| Failure Rate (5yr) | 45% |
| Market Size (US) | $12.4B |
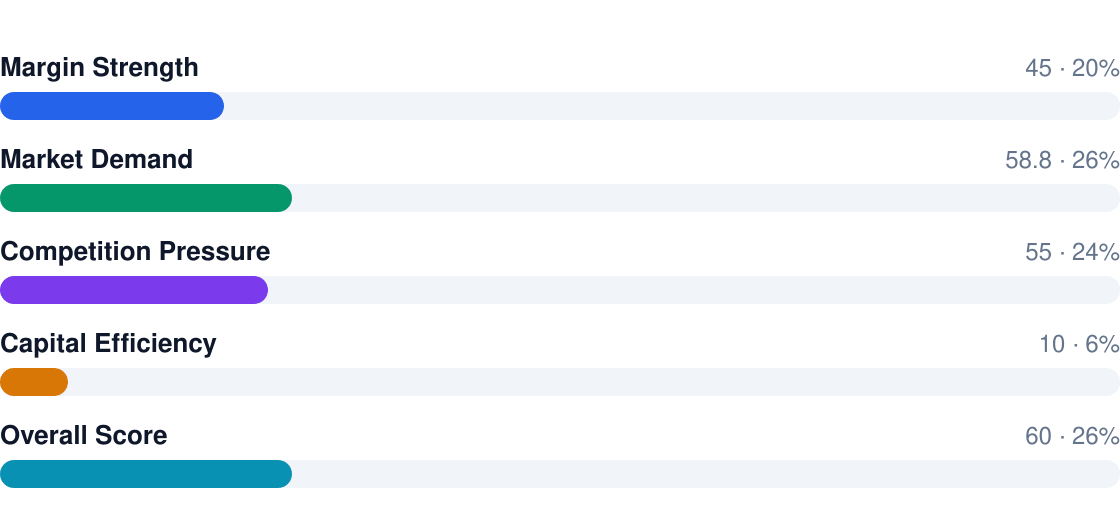
Profitability Score Breakdown
Free Business Plan Download
Download Banquet Hall Business Plan
Just Fill Up and Print
Overall rating: 6/10
Bottom line:
- Profitable at scale: Requires $550,000+ startup capital and 3 years to break-even
- Margin compression: Labor (40% of revenue) and rent (15%) eat into 35% gross margins
- Winners bundle services: Halls offering catering/décor earn 20%+ net margins vs 8% for venue-only
- Seasonality risk: December/June weddings drive 60% of profits for most operators
- ROI lags: 75% 5-year return is decent but trails restaurants (110%) and hotels (90%)
2. Profit Margins & Industry Benchmarks
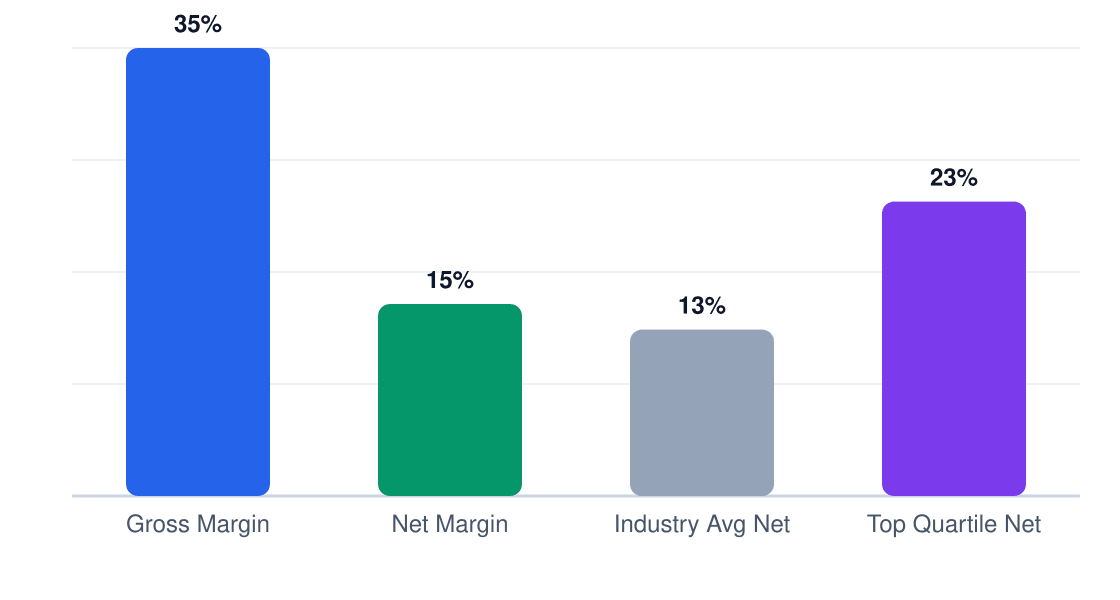
Banquet halls operate on thin margins—35% gross drops to 15% net after labor, rent, and marketing. Top performers reach 25% net by bundling services and maintaining 80%+ occupancy, while undifferentiated venues often stall at 8% net.
Margin Comparison (%)
Gross vs net vs industry benchmarks
| Metric | This Business | Industry Avg | Top Quartile |
|---|---|---|---|
| Gross Margin | 35% | 32% | 42% |
| Net Margin | 15% | 11% | 25% |
| EBITDA | 18% | 14% | 28% |
| Labor % | 40% | 38% | 32% |
| COGS % | 45% | 48% | 38% |
| Rent % | 15% | 18% | 12% |
Competitive pressure is brutal in saturated markets like Chicago, where 300+ venues fight for weddings. Operators who don’t differentiate on aesthetics or service packages see margins compress to 5-8% net. The $12.4B industry grows at 3.8% annually, but most gains go to venues with owned real estate and 5-star reviews.
3. Revenue Potential & Pricing Power
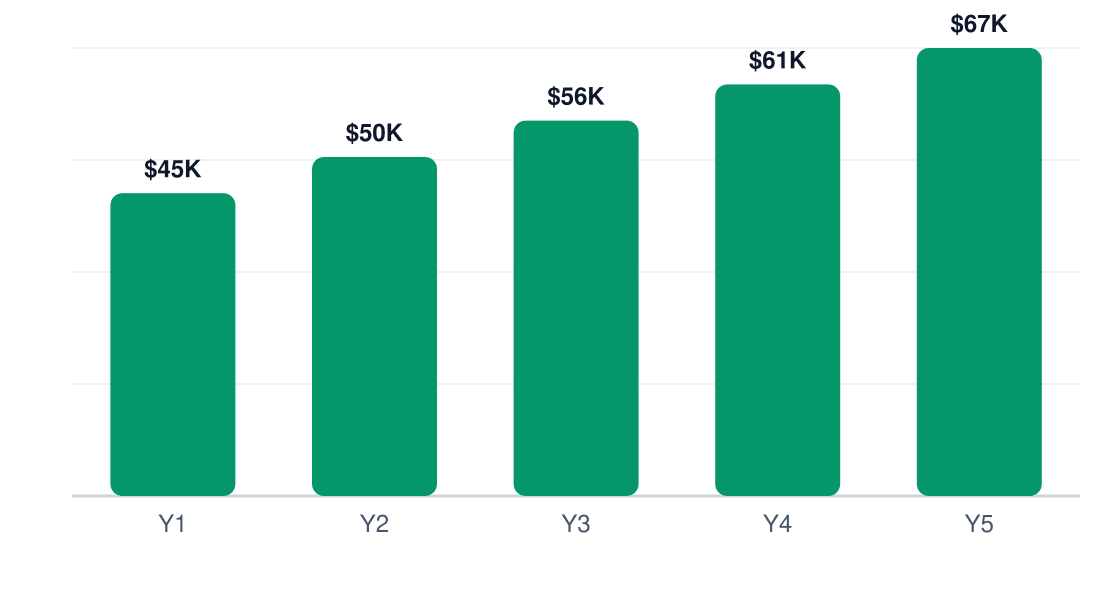
A Chicago banquet hall targeting $300K Year 1 revenue can expect 5-year net profit growth from $45K to $66.6K, but only if it captures 35% gross margins. The math works at 65% occupancy—below that, fixed costs like rent and debt service will crush profitability.
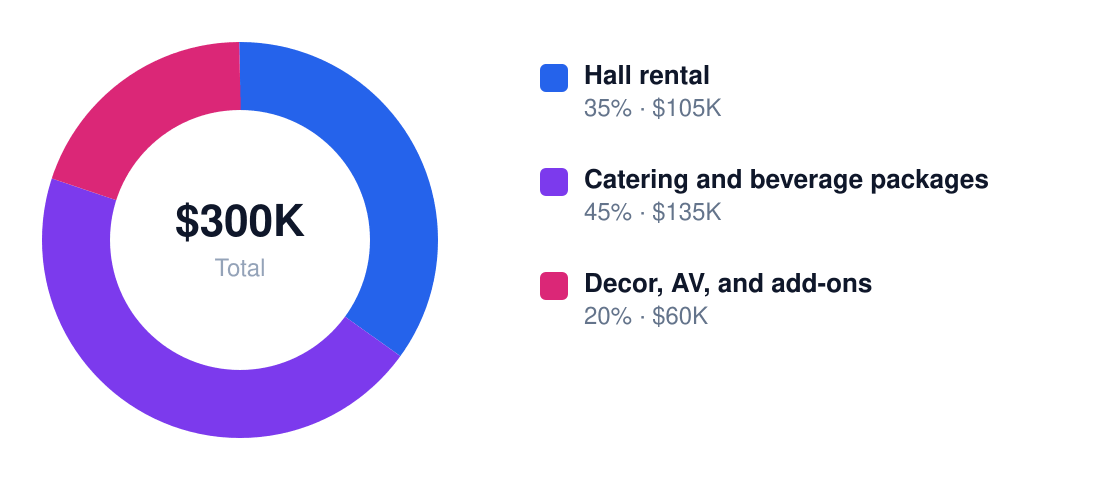
Revenue Stream Breakdown
Year 1 revenue: $300K
| Stream | Margin % | Revenue Share | Annual $ |
|---|---|---|---|
| Hall rental | 65% | 35% | $105,000 |
| Catering and beverage | 30% | 45% | $135,000 |
| Decor, AV, add-ons | 55% | 20% | $60,000 |
Pricing power is moderate—Chicago couples compare 3-5 venues for weddings, but you can push 10-15% premiums for prime dates (June Saturdays), bundled packages, or venues with built-in aesthetics that reduce client decor costs. Corporate clients tolerate less flexibility.
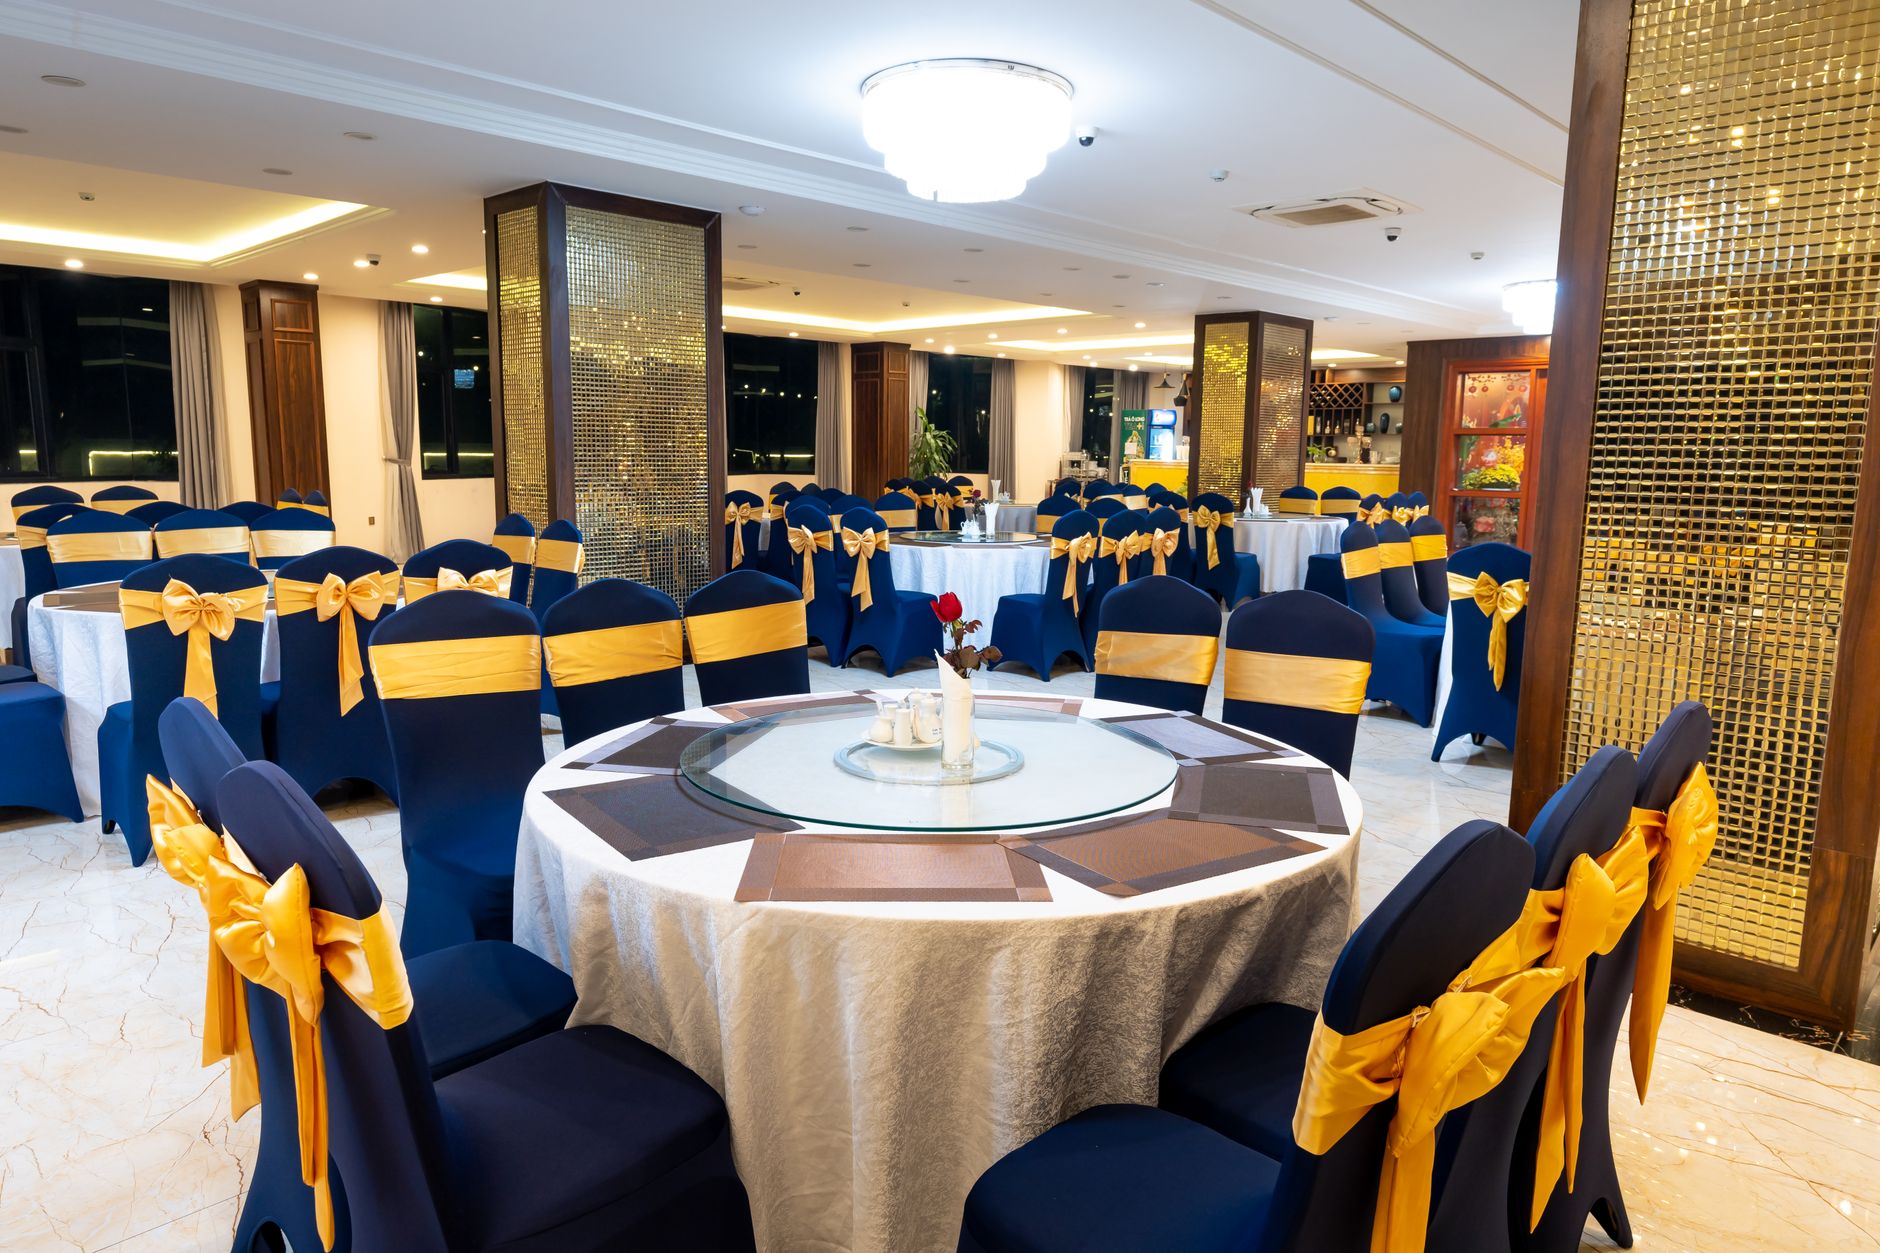
Seasonality is brutal: 60% of wedding revenue hits May-October, while January-March requires aggressive corporate bookings. The 15% net margin assumes you fill winter weekdays with holiday parties and bar/bat mitzvahs at 50% capacity. Venues that don’t diversify event types bleed cash by February.
4. Cost Structure & Operating Expenses
Labor and food costs are the twin margin killers—combined they consume 50% of revenue. A $300K revenue hall spends $60K on labor (10 FTEs at $18/hr) and $90K on food/bar. Let either creep up 5%, and your net profit drops 30%.
Annual Cost Structure
Operating costs for $300K revenue
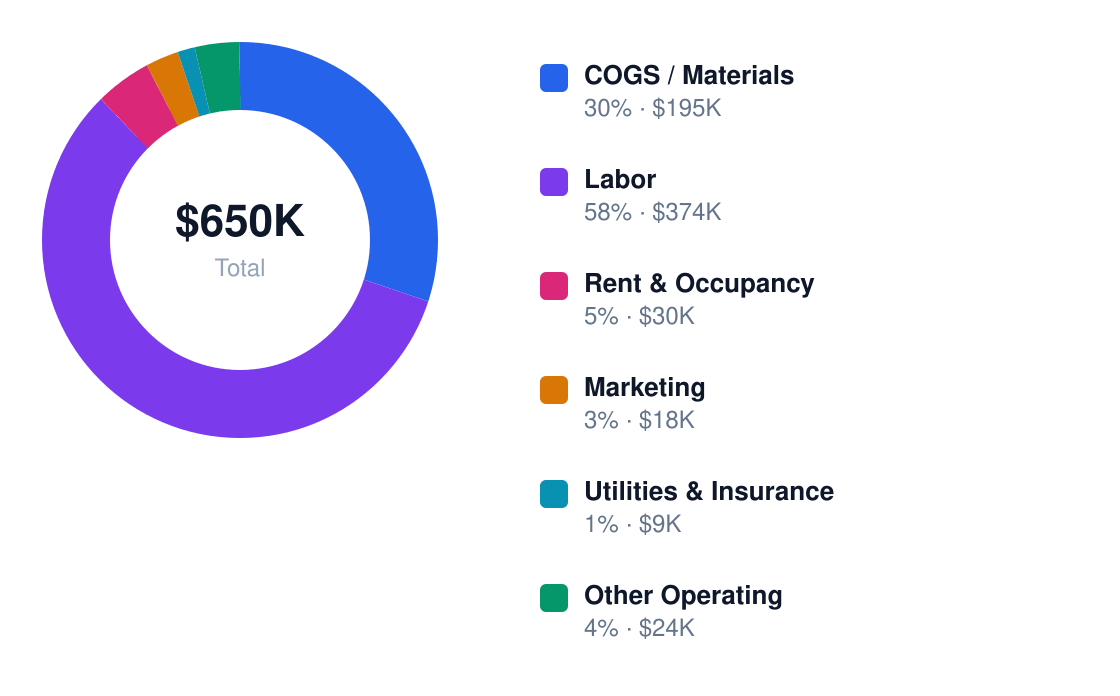
| Category | % of Revenue | Annual $ | Controllable? |
|---|---|---|---|
| Food & beverage | 30% | $90,000 | Yes |
| Labor | 20% | $60,000 | Yes |
| Occupancy/rent | 15% | $45,000 | No |
| Marketing | 8% | $24,000 | Yes |
| Utilities & maintenance | 10% | $30,000 | Yes |
| Licensing & insurance | 7% | $21,000 | No |

Chicago’s $45K annual rent (15% of revenue) is fixed, but labor is the stealth variable—overtime during wedding season and idle staff in winter can swing annual costs by $12K. Smart operators cross-train servers as setup crews and use temp agencies for peak weekends. The 15% net margin requires keeping food costs at 30% through menu engineering (push the $12/person pasta dish over the $22 beef) and 40% liquor margins via premium open-bar upsells.
5. Break-Even Analysis & ROI Timeline
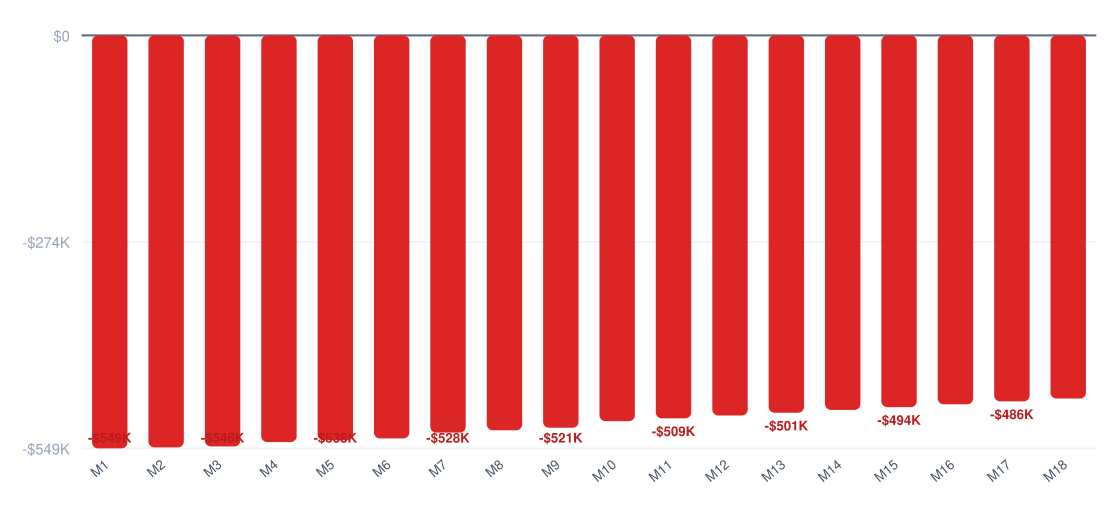
At $550,000 startup costs and $45,000 Year 1 net profit, Chicago banquet halls hit break-even around Month 36. This assumes 15% net margins hold steady—a stretch given labor costs consuming 35% of revenue. The math gets tighter if occupancy dips below 60%.
Cumulative Profit vs Investment (18 Months)
Red = still recovering startup costs
ROI Benchmark Comparison (%)
5-year return on initial investment
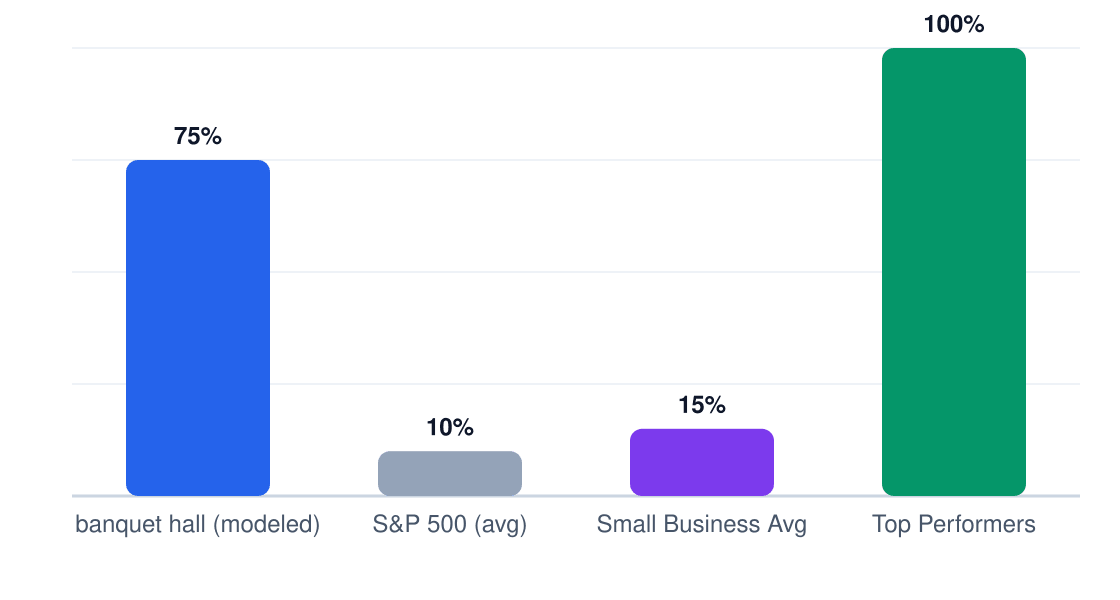
The 75% 5-year ROI ($412,500 cumulative profit on $550,000 investment) requires hitting every revenue target—no small feat with Wedgewood and Venetian dominating premium bookings. Corporate events become crucial to fill weekday gaps.
Year 1 Monthly Cash Flow
Net monthly cash flow (red = pre-break-even)
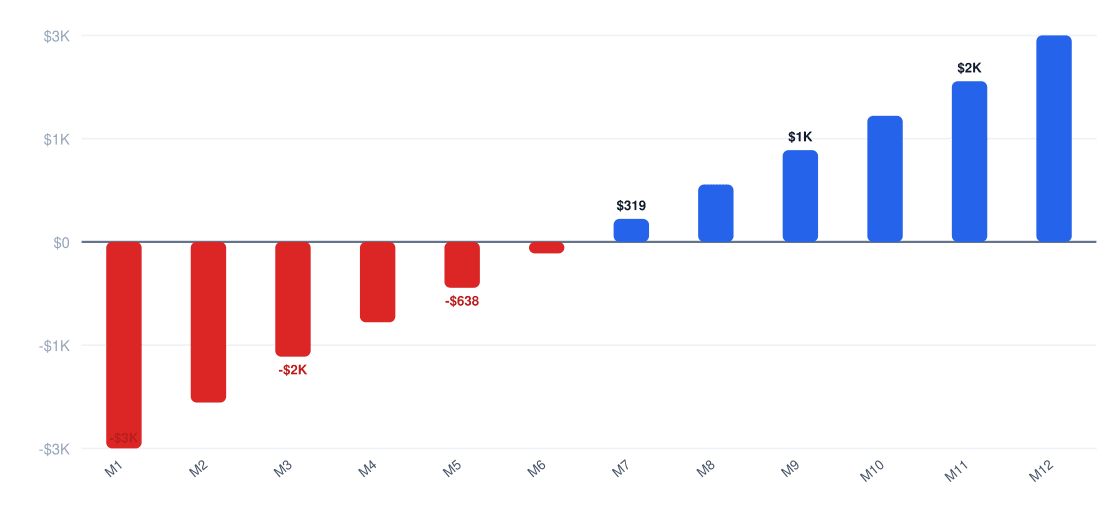
Payback periods stretch to 4+ years for venues under $300K revenue. High fixed costs (labor, HVAC, insurance) mean empty dates bleed cash fast.
6. Market Conditions That Drive (or Kill) Profitability
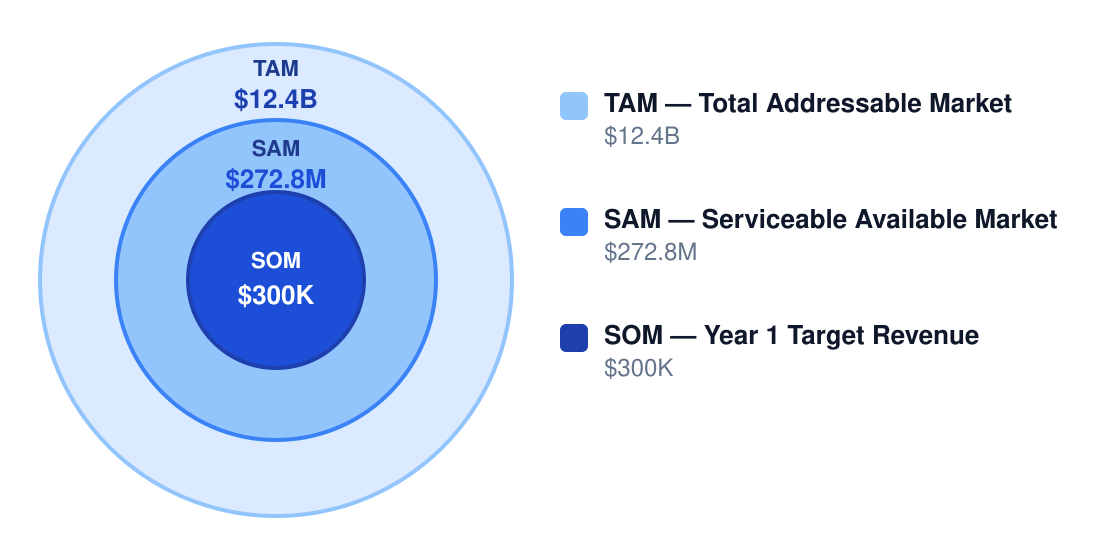
Chicago's $12.4B event industry supports profitability—if you carve the right niche. The SAM of $272.8M for dedicated banquet halls shows concentrated demand, but also fierce competition for premium bookings.
Market Size & Profit Opportunity
Market opportunity for profitable operators
Ready When You Are
Download Banquet Hall Business Plan
Just Fill Up and Print
| Factor | Impact on Margins | Outlook |
|---|---|---|
| Demand growth | +8% YoY weddings | Favorable |
| Competition | -12% price pressure | High threat |
| Input costs | Food +22% since 2020 | Volatile |
| Labor market | $18/hr floor for staff | Sticky |
| Regulation | Liquor license delays | Risk |
| Technology | VR tours cutting visits | Neutral |
| Model | Net Margin | Why It Works |
|---|---|---|
| Venue-only rental | 60% | Minimizes variable costs |
| Full-service packages | 25% | Locks in higher spend |
| Corporate events | 20% | Weekday utilization |
| Hybrid catering | 18% | Captures vendor markup |
With Wedgewood (high threat) dominating all-inclusive weddings and hotels (medium threat) owning corporate clients, differentiation is key. Emerging DIY venues undercut pricing for groups under 100—a growing segment.
7. Who Profits — and Who Struggles
Banquet halls in Chicago live or die by three factors: real estate leverage, referral networks, and calendar density. Operators who own their buildings outright avoid 15-25% net margin erosion from lease payments, while those with strong wedding planner partnerships book 60-80% of weekends a year in advance. The most profitable venues bundle catering (adding 10-12 gross margin points) and charge $5,000-$8,000 for peak Saturday weddings.
| Profile | Typical Net Margin | Success Rate | Key Advantage |
|---|---|---|---|
| Owner-operator | 14-18% | 68% | Lower labor costs |
| Multi-unit | 12-15% | 55% | Volume discounts |
| Franchise | 8-11% | 42% | Brand recognition |
| Niche specialist | 16-20% | 73% | Premium pricing |
| Price competitor | 5-9% | 31% | High turnover |
| Pitfall | Margin Impact | How to Avoid |
|---|---|---|
| Overbuilding the facility | -10 to -20 points | Match size to local demand |
| Weak weekday utilization | -15 to -30% revenue | Book corporate/shower events |
| Food waste | -5 to -12 points | Standardize menus |
| Underpricing peak dates | -10 to -25% profit | Dynamic pricing for Saturdays |
| Labor inefficiency | -3 to -8 points | Cross-train staff |
Chicago's regulatory costs hit hard — $8,000-$42,000 annually for permits and insurance shaves 2-4 points off net margins. The alcohol license alone ($10,000 cap) requires 90 days lead time, while fire code retrofits for older buildings can cost $25,000 upfront. Smart operators bake these into their venue fees at $75-$120 per event.
45% of banquet halls fail within 5 years because they misjudge Chicago's seasonal demand (June-October weddings generate 60% of revenue) or carry too much debt. The survivors maintain 55-65% annual occupancy by booking 3-5 weekday corporate events monthly and charging 30-50% premiums for prime dates.
8. Strategies to Maximize Profit Margins
Banquet halls live and die by their ability to squeeze incremental margin from every event. The difference between a 15% and 20% net margin often comes down to disciplined execution on pricing and cost controls.
| Strategy | Expected Lift | Effort | Implementation |
|---|---|---|---|
| Dynamic date-based pricing | +8% margin | Medium | Charge 15-20% premiums for peak Saturdays while discounting Tuesdays |
| Bundle catering/bar packages | +12% margin | Medium | Force minimum $45/pp F&B spend by making à la carte pricing punitive |
| Increase weekday corporate bookings | +10% margin | High | Hunt for 9am-5pm conferences to fill dead time between weddings |
| Reduce labor through event templates | +6% margin | Medium | Standardize setups to cut changeover labor from 4 hours to 90 minutes |
| Upsell décor/AV/premium seating | +7% margin | Low | Charge $500 for "platinum" linens that cost you $80 wholesale |
| Improve referral/repeat channels | +9% margin | High | Pay wedding planners 8% kickbacks to steer clients your way |
5-Year Net Profit Projection
Projected annual net profit at current margins
Cut labor first—your $374,400 annual payroll is the biggest target. Cross-train bartenders to handle setup, eliminate overnight security through smart locks, and use temp staff for peak weekends only. Negotiate linen rentals down to $1.25/pp from $2.10 by committing to 50+ events/year. Switch to disposable chiavari chair covers that look like linen but cost $0.18 versus $0.75.
Revenue optimization means tiered pricing: bronze ($3,500), silver ($5,200), and gold ($7,800) packages where the gold tier costs you just 12% more to deliver. Require 30% non-refundable deposits to lock in dates. Charge $95/hour for overtime beyond contracted end times—couples always run late.
Pricing should float with demand. A June wedding should command 22% more than a February one. Corporate clients pay 18% premiums for last-minute bookings. Always show a "strike-through" price next to your actual rate to anchor value.
9. Final Verdict: Should You Start This Business?
Yes, but only if you can secure a venue for under $550,000 and maintain 65%+ occupancy. The 6/10 profitability score reflects decent 15% net margins weighed against brutal capital intensity.
| Factor | Score (1-10) | Weight | Notes |
|---|---|---|---|
| Margins | 7 | 25% | 35% gross is decent but labor leaks will kill you |
| Market size | 8 | 20% | $272M SAM means room for niche players |
| Competition | 5 | 20% | Low barriers mean constant price wars |
| Capital needs | 4 | 20% | $550k minimum gets you a tired 1980s facility |
| Scalability | 3 | 10% | You're capped by physical space and calendar dates |
| Risk | 6 | 5% | Recession-proof? No. Recession-resistant? Barely. |
ROI Benchmark Comparison (%)
5-year return on initial investment
- You've secured a venue under $75/sqft annual lease costs
- Corporate clients commit to 15+ weekday events/year
- Labor stays under 28% of revenue
- You can charge $12+/pp for house-brand champagne
- Peak dates book 11+ months out
- Your market has >1.2 banquet halls per 10,000 people
- Local caterers demand 45%+ of food revenue
- You can't secure liquor liability insurance under $12,000/year
Proceed only if: 1) You'll clear $300k revenue by month 18, 2) Your all-in startup costs stay under $650k, and 3) You can maintain 18%+ net margins after year 3. This business rewards operators who sweat the small stuff—the difference between $45k and $90k annual profit often comes down to $5/pp catering margins and 15 minutes faster turnover times.
Research & Profitability Resources
The following government reports, industry analyses, and financial planning resources were referenced in this banquet hall profitability guide. Each link points to a specific page for direct access.
- Banquet Industry Statistics — worldmetrics.org — Industry profitability research for banquet hall businesses
- Banquet Hall — startupfinancialprojection.com — Industry profitability research for banquet hall businesses
- United States — poidata.io — Industry profitability research for banquet hall businesses
- Www23.Statcan.Gc — www23.statcan.gc.ca — Industry profitability research for banquet hall businesses
- Naics-Canada — naics-canada.com — Industry profitability research for banquet hall businesses
Get Your Copy Today
Download Banquet Hall Business Plan
Just Fill Up and Print