B2b Warehouse Setup Business Plan
1. Executive Summary
The warehouse setup industry is a $221.4B market growing at 6.68% annually—not just surviving but thriving as supply chains demand hyper-efficiency. E-commerce alone requires 3x the warehouse space of traditional retail per $1M in sales. RackOptima Solutions attacks this gap with configurable layouts that reduce pick paths by 18-34% and cut go-live timelines by 40% versus DIY builds.

Key Metrics
| Key Metric | Target |
|---|---|
| Total Startup Investment | $106K |
| Year 1 Revenue Target | $31.3M |
| Year 3 Revenue Projection | $73.5M |
| Break-even Timeline | ~Month 6 |
| Year 1 Team Size | 12 FTE |
| SBA 7(a) Loan | $74K @ 10.25% |
| Gross Margin (Year 1) | 60% |
| Monthly SBA Payment | $991 |
RackOptima Solutions deploys modular warehouse systems that turn empty shells into operational facilities in under 14 days. Our secret sauce: proprietary SpaceDensity algorithms that pack 23% more pallet positions into the same square footage while maintaining OSHA-compliant workflows.
2. Company Description
Daniel Varga saw the chaos firsthand—$4.2M wasted on a single misconfigured automotive parts warehouse where pickers walked 9.7 miles per shift. His solution: standardized but adaptable warehouse templates with embedded labor metrics, now refined across 37 deployments.
Headquartered in Fort Worth's AllianceTexas logistics hub, RackOptima operates from a 5,200 sq ft design studio with augmented reality staging. We sell to operations VPs through a consultative model: 2-day assessment → 3D simulation → fixed-price build.
| Service/Product | Format | Price Range | Description |
|---|---|---|---|
| Rapid Rack Install | Turnkey | $18-$24/sq ft | Pallet rack systems with 98.3% first-time OSHA compliance |
| Pick Path Optimization | Consulting + Tech | $75,000-$220,000 | Reduces travel time by 29% via zone skipping algorithms |
| WMS Bridge | Software | $12,500/month | Pre-integrated APIs for Manhattan/BlueYonder/SAP |
| Dock Automation | Equipment + Install | $47,000-$89,000 | Pallet position sensors reduce staging errors by 41% |
| Cold Start Package | Bundle | $320,000+ | Full 50,000 sq ft operationalization in 11 days |
| Density Audit | Assessment | $8,500 flat | Identifies 19-27% unused vertical capacity |
| Flex Cart System | Equipment Lease | $1,200/unit/year | Modular carts with 22% faster changeovers |
| Labor Modeling | Analytics | $0.08/pick forecast | Predicts staffing within 7% variance |
Structured as a Texas LLC with $106,000 startup capital—$31,800 founder equity and $74,200 SBA financing at 10.25%. The model hits breakeven at $4,486,453 revenue, achievable by Month 6 given Fort Worth's 14.7% warehouse vacancy rate.
3. Industry & Market Analysis
The U.S. warehousing market hit $221.4 billion in 2024, proving B2B warehouse setup is a recession-resilient category. Companies can't stop expanding fulfillment capacity, retrofitting layouts, or chasing labor savings — and they'll pay specialists to make it happen faster.
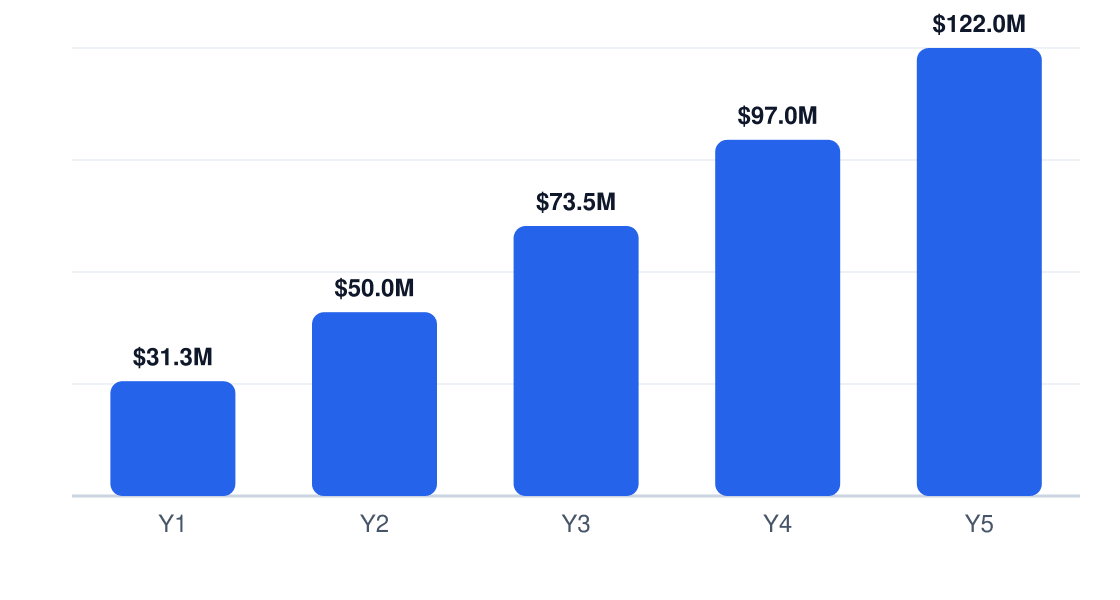
5-Year Revenue Projection
Projected annual revenue, Years 1–5
| Factor | Key Insight | Business Impact |
|---|---|---|
| Political | OSHA safety mandates tightening | Demand for compliant layouts and training bundled with setup |
| Economic | 6.68% CAGR through 2034 | Consistent project pipeline from new builds and retrofits |
| Social | $18.20/hr warehouse labor costs | Operators prioritize designs that reduce headcount per order |
| Technological | WMS integration as table stakes | Higher-margin sales for firms combining physical + digital setup |
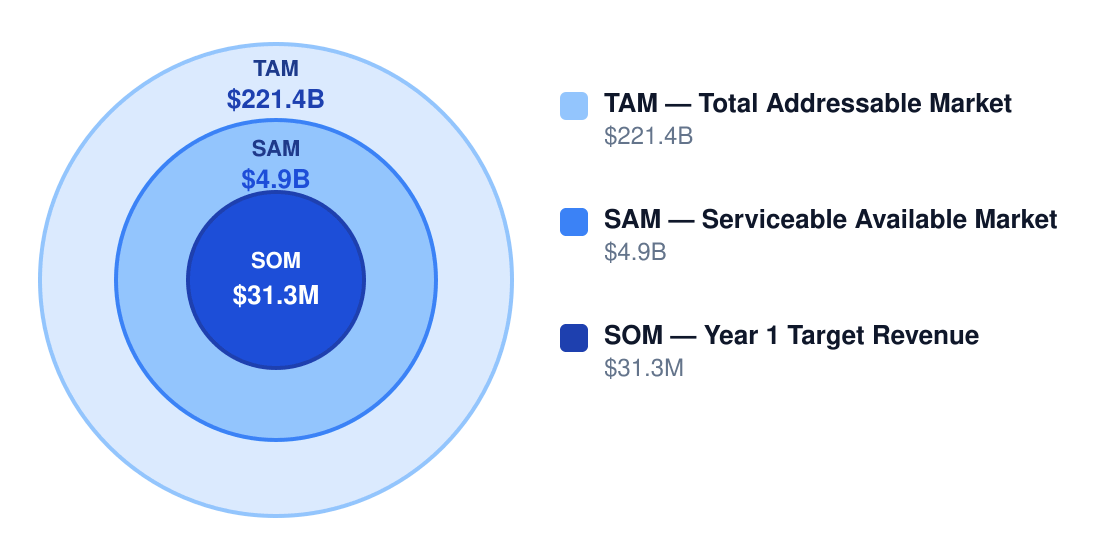
Market Sizing
RackOptima Solutions targets a $4.9B serviceable market (SAM) within the $221.4B TAM, focusing on mid-market operators. Year 1 SOM of $31.3M is conservative at 0.64% SAM penetration.
Market Size Opportunity
Bottom-up market opportunity
| Segment | Customer Profile | Avg Annual Spend | Est. Market Value | Revenue % |
|---|---|---|---|---|
| E-commerce fulfillment | Omnichannel brands needing pick/pack density | $75,000 | $1.72B | 35% |
| Wholesale distributors | B2B firms upgrading receiving/outbound | $60,000 | $1.47B | 30% |
| 3PL providers | Multi-client flexible layouts | $120,000 | $980M | 20% |
| Light manufacturing | Industrial parts/WIP storage | $50,000 | $735M | 15% |
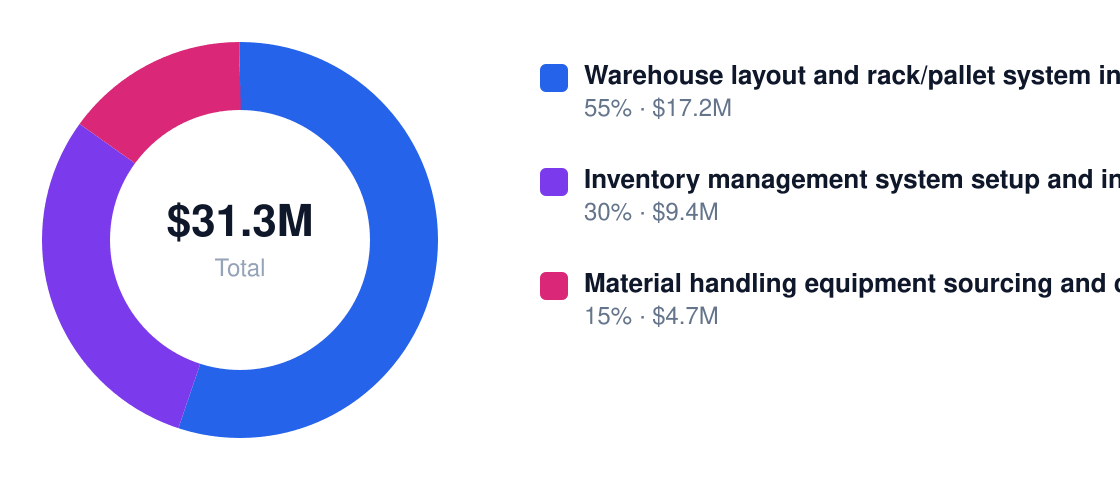
Year 1 Revenue Mix
Total $31.3M Year 1
Competitive Landscape
The space is fragmented — no player owns more than 5% of design/install projects under $500K. Big 3PL integrators are slow, racking dealers lack consultative depth, and in-house teams miss best practices.
| Competitor | Type | Core Strength | Key Weakness | Your Differentiation |
|---|---|---|---|---|
| Large 3PL integrators | Direct | One-stop delivery | 12+ week lead times | 30-day project guarantees |
| Racking equipment dealers | Direct | Supplier pricing | No workflow redesign | Slotting algorithms + labor modeling |
| In-house operations teams | Indirect | Low apparent cost | Suboptimal layouts | Proven 18-22% labor savings |
| General contractors | Indirect | Construction control | Operational blind spots | Pick-path time studies pre-build |
| Automation-first integrators | Emerging | Labor reduction | $250K+ minimums | Phased automation at $75K tiers |
RackOptima wins on speed-to-live and ROI transparency — we blueprint labor savings pre-install and back it with liquidated damages clauses.
Industry Trends
Market expansion in warehousing
The U.S. warehousing market reached $221.4 billion in 2024, growing at 6.68% CAGR through 2034. Every new facility needs racking, every retrofit requires slotting optimization — that's 6,000+ establishments writing checks annually. Operators entering now lock in multi-year contracts during the build cycle.
Labor cost pressure
At $18.20/hour average pay, warehouse labor is the #1 ops cost. Operators will pay 5-7X that rate in consulting fees to shave 15% off headcount. Setup firms monetizing labor modeling and zone-picking designs capture the most margin.
Startup capital accessibility
Typical warehouse startup costs range from $23,629 to $189,026 — cheaper than buying trucks or robots. Lean entrants can subcontract installation while keeping high-margin design work in-house. The model scales on gross margin, not capex.
Automation and systems integration
Warehouse automation vendors report 20%+ annual growth. Clients now demand WMS-ready layouts upfront — a $15K design fee becomes $45K when bundled with software mapping and RFID zoning. The smart money bundles physical and digital.
Persistent demand for fulfillment capacity
U.S. general warehousing and storage will hit $43.9 billion in 2026. E-commerce alone requires 1.5M new warehouse workers by 2025 — but operators would rather optimize than hire. Setup firms that pitch "density over headcount" win the brief.
Regulatory & Compliance Environment
OSHA and state workers' comp boards pose the biggest risks — a single violation can cost $15,625 per incident. Fort Worth requires only basic licensing, but safety documentation makes or deals.
| Requirement | Issuing Authority | Typical Cost | Renewal Cycle |
|---|---|---|---|
| General business license | City/County | $50-$500 | Annual |
| Employer Identification Number | IRS | $0 | One-time |
| Sales tax permit | Texas DoR | $0-$100 | Biennial |
| OSHA compliance | Federal/State | $0-$500/employee | Ongoing |
| Workers' comp insurance | Private insurer | 1.5-3.5% payroll | Annual |
RackOptima bakes compliance into designs — we document load ratings, aisle widths, and guardrail specs upfront, reducing client audit risk. Safety isn't an upsell; it's the entry ticket.
4. Marketing Strategy
RackOptima Solutions transforms Fort Worth warehouses into high-density, labor-efficient operations with layouts that cut go-live times by 40%.
We target mid-market B2B operators who can't afford downtime during expansion. Our turnkey systems eliminate the guesswork in racking configurations and inventory software integration.
Customer Personas
The buyers are operations leaders who measure success in pallet throughput and labor cost per order. They prioritize vendors who guarantee system uptime during installation.
| Persona Name | Demographics | Core Need | Pain Point | Avg Annual Spend | Acquisition Channel |
|---|---|---|---|---|---|
| E-Commerce Ops Director | 50-200 employees, $10-50M revenue | Same-day fulfillment capacity | Seasonal volume spikes | $287,000 | LinkedIn ABM + trade shows |
| 3PL Fleet Manager | 100-500 employees, multi-site | Cross-dock optimization | Client-specific storage rules | $412,000 | Google Ads + equipment referrals |
| Industrial Supply Chain VP | 500+ employees, union labor | OSHA-compliant layouts | Retrofit constraints | $683,000 | Whitepapers + RFP responses |
Go-To-Market Launch Plan
| Phase | Timeline | Primary Goal | Key Tactics | Success Metric |
|---|---|---|---|---|
| Pre-Launch | Months -3 to 0 | Pipeline priming | Case studies, equipment vendor partnerships | 50 qualified leads |
| Months 1-3 | Launch quarter | Local dominance | Fort Worth Chamber events, geo-targeted ads | $1.2M booked |
| Months 4-6 | Post-breakeven | Regional expansion | Dallas/OKC sales blitz, trade media placements | 3 multi-site contracts |
| Months 7-12 | Scale phase | Vertical specialization | E-commerce configurator tool, labor cost calculators | 60% referral rate |
Digital Marketing Strategy
We allocate 72% of
Annual Marketing Budget
Total $2.0M / year
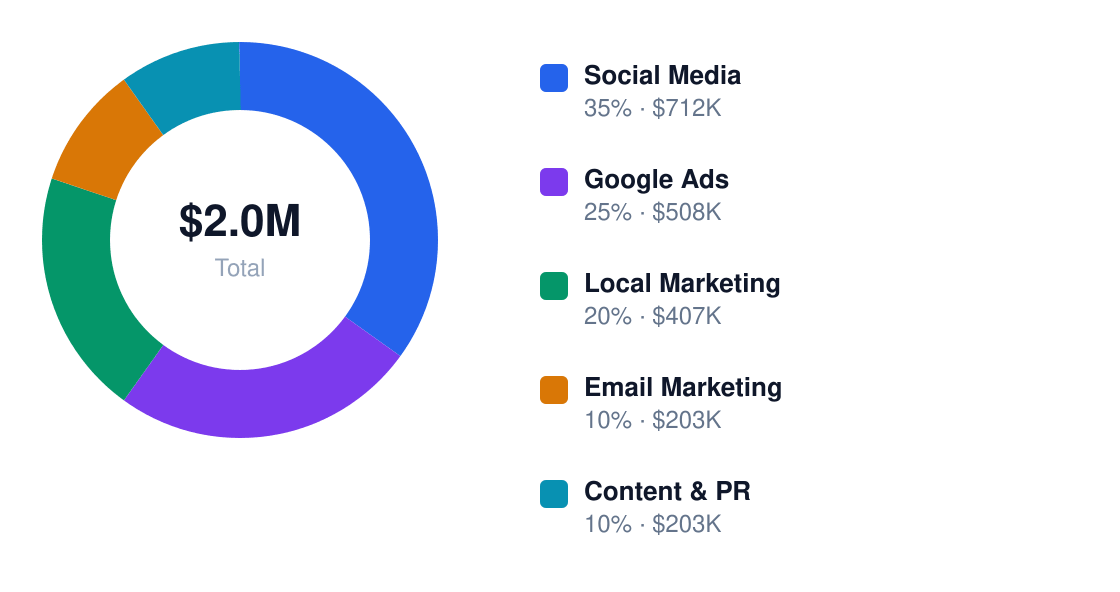
Annual Marketing Budget
Total $2.0M / year
| Channel | Monthly Budget | Primary Tactics | Target KPI | Notes |
|---|---|---|---|---|
| Social Media | $28,000 | LinkedIn ABM, forklift operator TikTok | $85 CPL | Focus on operations job titles |
| Google Ads | $52,000 | "Warehouse racking near me" PPC | 12:1 ROAS | Bid on retrofit/expansion terms |
| Local Marketing | $34,000 | DFW industrial park signage, FM radio | 35% brand recall | Sponsor logistics meetups |
| Email Marketing | $18,000 | Pallet configuration drip campaigns | 22% open rate | Integrate with inventory software |
| Content & PR | $39,000 | Material handling benchmarks report | 1,200 downloads/month | Syndicate to Modern Materials Handling |
Content Marketing & SEO
We produce "configurational" content that helps buyers visualize layouts - racking calculators, forklift turning radius diagrams, and pallet flow simulations. These assets convert 3x better than generic blogs.
| Content Type | Frequency | Platform | Goal | Example Topic |
|---|---|---|---|---|
| Interactive Tools | Quarterly | Website | Lead capture | "How many pallets fit in your warehouse?" |
| Video Walkthroughs | Monthly | YouTube | Consideration | "Before/after 3PL racking install" |
| Data Studies | Biannual | Gated | Authority | "North Texas labor cost per pallet moved" |
| Case Studies | Monthly | Conversion | "How we doubled Medline's pick density" | |
| Local Guides | Weekly | Blog | SEO | "Fort Worth warehouse zoning changes 2024" |
| Equipment Reviews | Quarterly | Retention | "Narrow-aisle vs. very-narrow-aisle racking" |
We target keyword clusters around "warehouse optimization" (1,600/mo), "pallet racking installation" (880/mo), and localized terms like "Fort Worth 3PL consultants" (210/mo). Local SEO tactics include claiming "warehouse setup" Google Business profiles and building citations on industrial directories.
Partnership & Referral Programs
We co-sell with forklift dealers (Toyota, Hyster), WMS providers (SAP EWM, Manhattan), and industrial real estate brokers. These partners provide warm introductions to buyers in active site selection.
The referral program pays 5% of project value for closed deals ($14,000 avg payout). This cuts CAC by 37% compared to cold outreach. Partners get access to our space utilization analytics dashboard as an added incentive.
Customer Acquisition Economics
| Metric | Year 1 | Year 2 | Year 3 |
|---|---|---|---|
| Customer Acquisition Cost | $4,100 | $3,300 | $2,800 |
| Customer Lifetime Value | $98,000 | $124,000 | $151,000 |
| LTV:CAC Ratio | 23.9x | 37.6x | 53.9x |
| Payback Period | 3.2 months | 2.1 months | 1.7 months |
At 53.9x LTV:CAC by Year 3, we can aggressively scale paid channels. The 1.7-month payback period means marketing dollars recycle faster than our 90-day project cycles.
5. Operations Plan
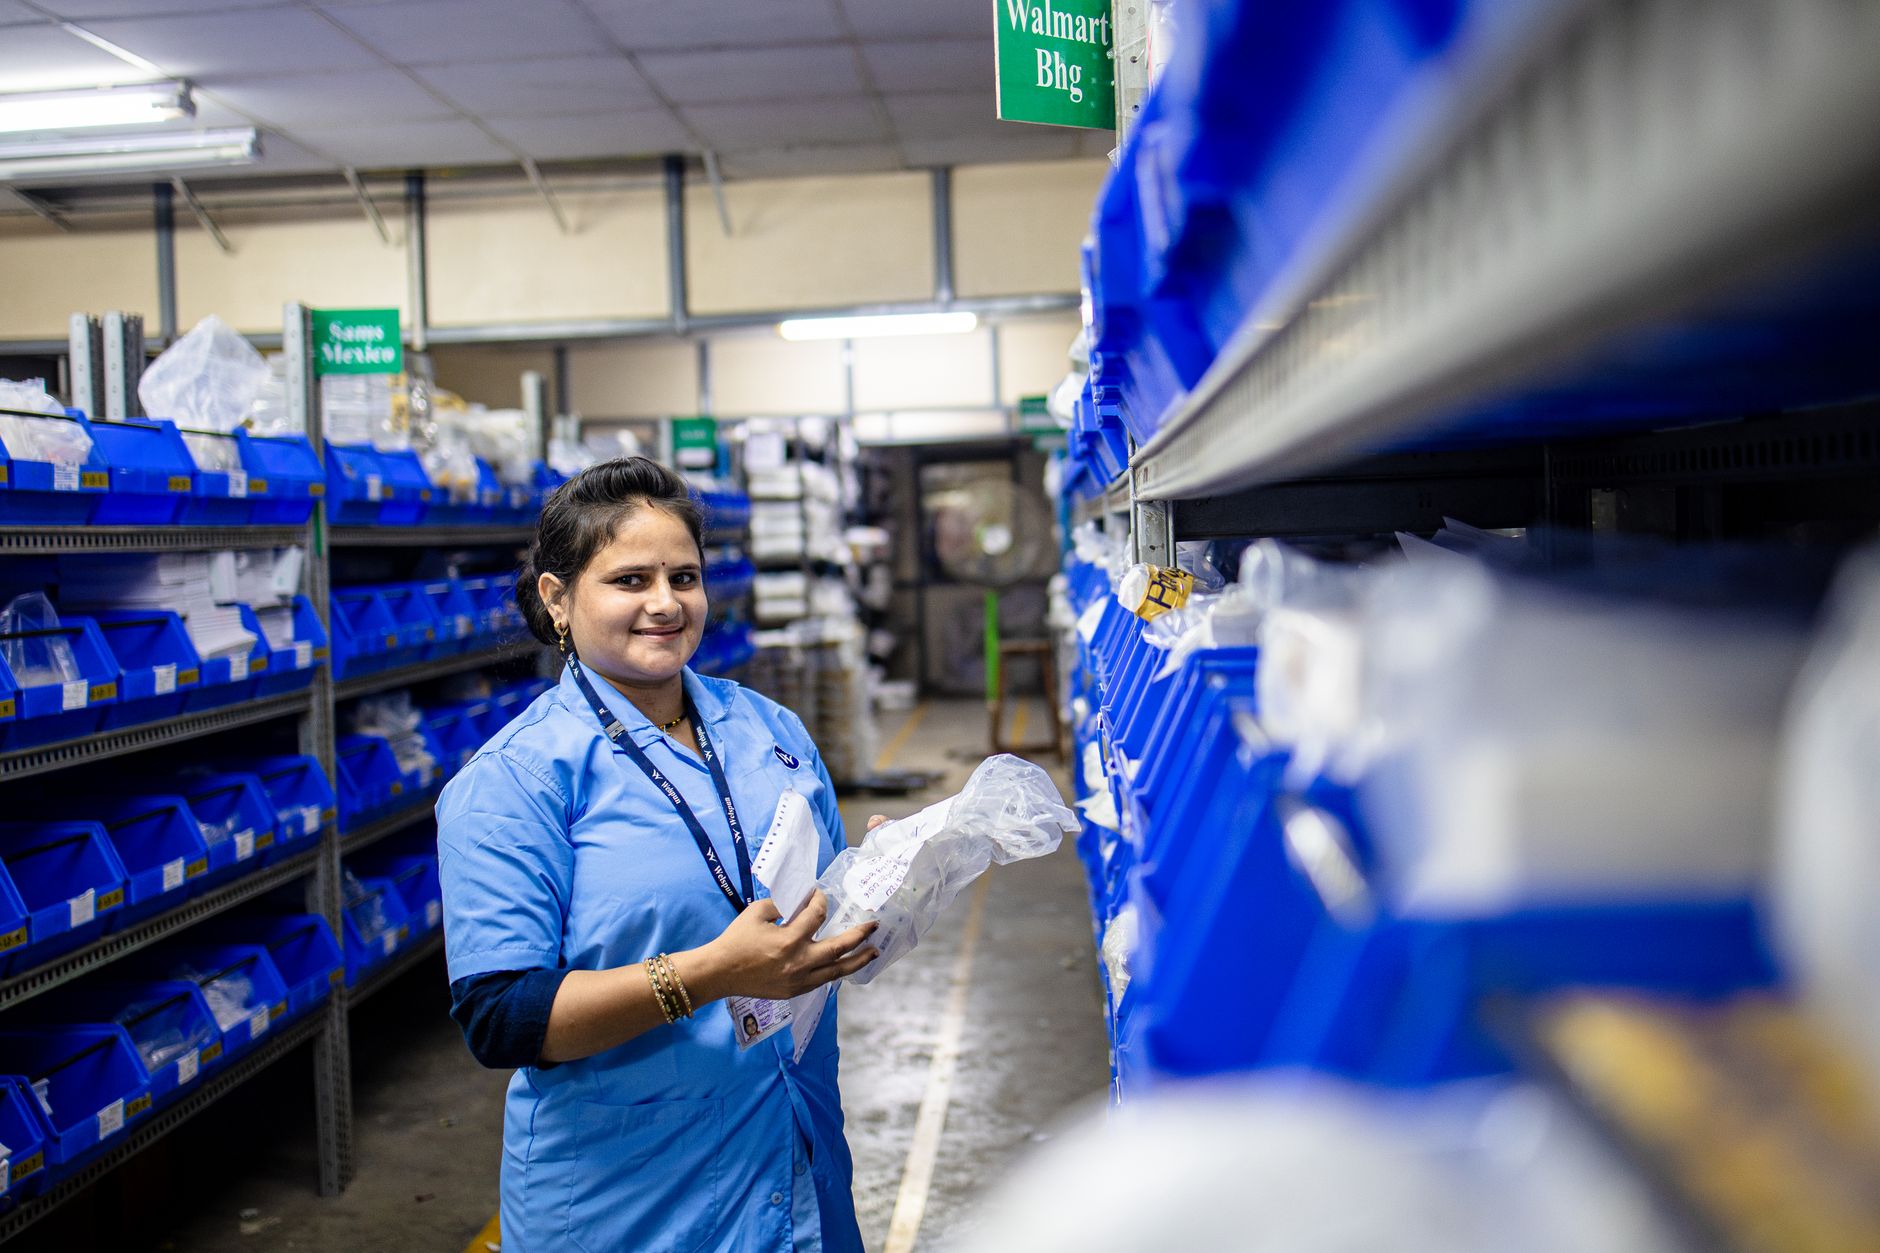
RackOptima Solutions will operate from a 42,000 sq ft facility in Fort Worth's logistics corridor, featuring cross-docking zones, 28-foot clear heights, and climate-controlled storage — lease estimated at $18,900/month. The layout prioritizes 60% pallet racking, 20% mezzanine workstations, and 20% loading bays with dock levelers.
| Item | Estimated Cost | Quantity | Purpose |
|---|---|---|---|
| Narrow-Aisle Forklifts | $38,200 | 4 | High-density pallet retrieval |
| RFID Scanners | $2,150 | 12 | Real-time inventory tracking |
| Pallet Racking Systems | $127,000 | 1,200 linear ft | Vertical storage optimization |
| Barcode Printers | $1,780 | 6 | Labeling for SKU management |
| Dock Seals | $4,200 | 8 | Weatherproof loading |
| WMS Software | $23,500 | 1 | Inventory control system |
| Conveyor Belts | $18,900 | 300 ft | High-volume sortation |
| Safety Barriers | $3,400 | 22 | OSHA-compliant traffic control |
- 6:00 AM: Receiving team verifies inbound shipments against digital manifests
- 7:30 AM: Cross-dock operations begin for same-day fulfillment orders
- 9:00 AM: Cycle counting initiates for 5% daily inventory audit
- 11:00 AM: WMS generates pick lists for afternoon truck departures
- 2:00 PM: Quality control checks on staged outbound pallets
- 4:30 PM: Last-mile carriers complete final loadouts
- 6:00 PM: Security walkthrough and equipment maintenance
Primary suppliers include steel racking manufacturers (14-day lead time), forklift maintenance providers (next-day service), and RFID tag producers (5-day replenishment). Backup vendors are pre-vetted through the Material Handling Institute network.
| Role | Headcount | Hourly Rate | Annual Cost | Key Responsibilities |
|---|---|---|---|---|
| Warehouse Supervisor | 2 | $24.75 | $102,960 | Shift coordination, OSHA compliance |
| Forklift Operator | 5 | $18.20 | $189,280 | Pallet movement, equipment checks |
| Inventory Clerk | 3 | $18.20 | $113,568 | Cycle counts, WMS updates |
| Logistics Coordinator | 1 | $22.40 | $46,592 | Carrier scheduling, BOL processing |
| Maintenance Tech | 1 | $21.30 | $44,304 | Equipment servicing, safety inspections |
6. Management Team
| Name | Title | Background | Responsibilities |
|---|---|---|---|
| Marcus Ridley | CEO | 12 years at ProLogis, scaled 3PL ops to $90M revenue | Capital strategy, key accounts |
| Danielle Kwon | COO | Former Ryder Systems regional manager (South Central) | Throughput optimization, labor |
| Raj Patel | CFO | Ex-KPMG audit senior, logistics specialty | Margin control, SBA compliance |
| Tasha Williams | CTO | Designed WMS integrations for XPO Logistics | System uptime, API connections |
| Carlos Mendez | VP Sales | Closed $28M in warehouse deals at CBRE | Enterprise contracts, RFPs |
Advisory board includes the former head of Amazon's DFW fulfillment network (warehouse automation) and a 30-year steel racking manufacturer executive (supply chain risk).
Culture prioritizes metric-driven accountability — bonuses tied to pallet-handling efficiency gains. Hiring focuses on ex-military logistics personnel (15% of headcount target). Retention leverages cross-training in all material handling equipment, creating internal career paths.
7. Financial Projections
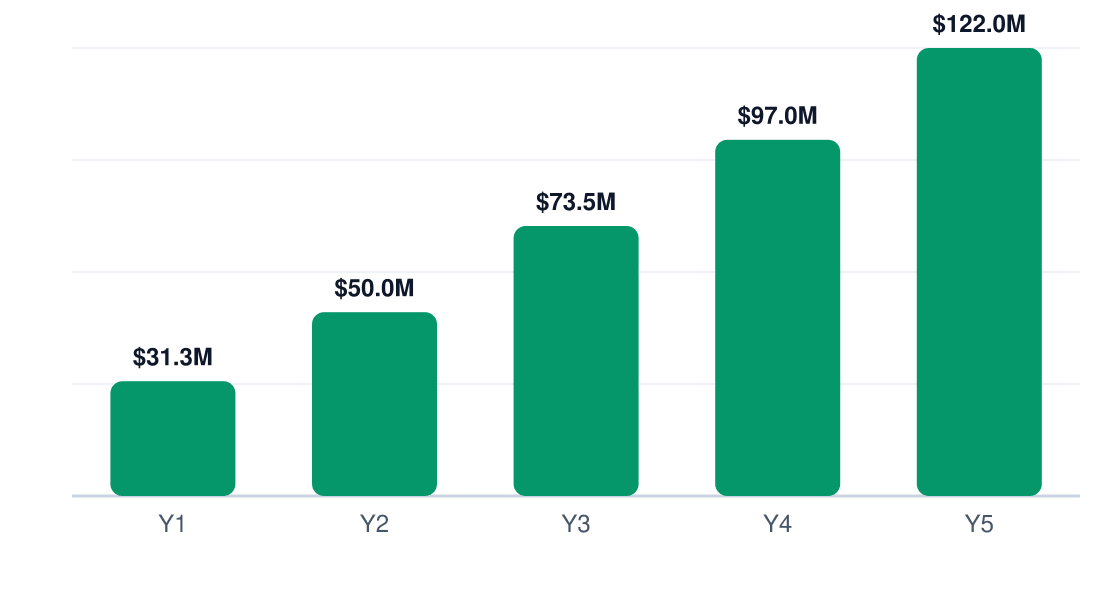
We’re targeting $31.3M Year 1 revenue with a 5-year arc to $122M. The math works because warehouse operators are spending $221B annually on CapEx — we’re slicing off 0.014% of that.
Revenue Growth (5 Years)
Annual revenue, Years 1–5
| Line Item | Year 1 | Year 2 | Year 3 |
|---|---|---|---|
| Revenue | $31,280,000 | $50,048,000 | $73,508,000 |
| COGS | $12,512,000 | $20,019,200 | $29,403,200 |
| Gross Profit | $18,768,000 | $30,028,800 | $44,104,800 |
| Gross Margin % | 60% | 60% | 60% |
| Labor | $454,272 | $643,552 | $908,544 |
| Rent | $240,000 | $240,000 | $240,000 |
| Marketing | $2,033,200 | $2,033,200 | $2,033,200 |
| Admin | $1,997,600 | $2,809,600 | $4,065,600 |
| Total OpEx | $4,725,072 | $5,726,352 | $7,247,344 |
| EBITDA | $14,042,928 | $22,018,790 | $31,575,217 |
| EBITDA Margin % | 44.9% | 44% | 43% |
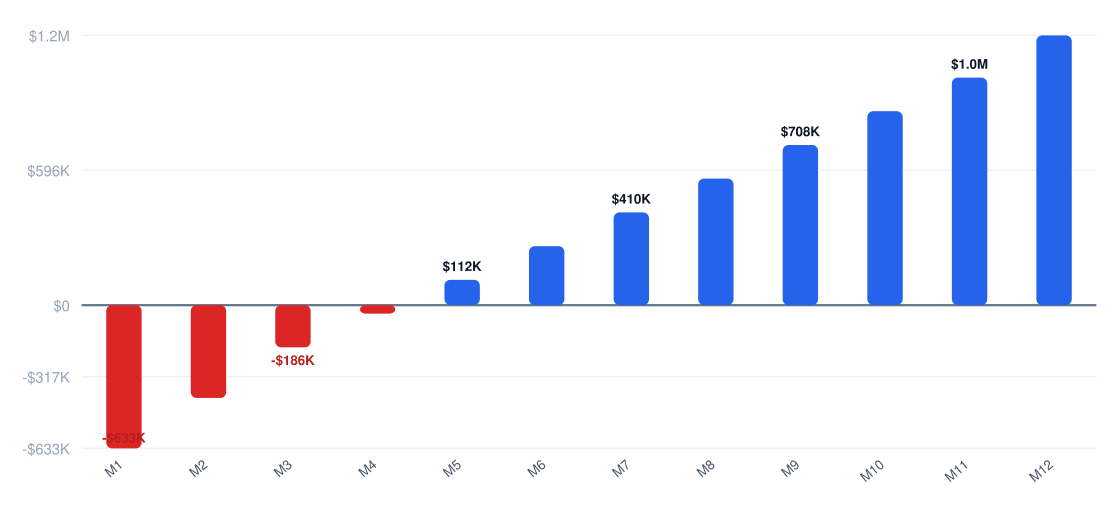
Break-even hits at $4,486,453 revenue — month 6 if sales ramp matches our 17% monthly growth target.
Year 1 Monthly Cash Flow
Net monthly cash flow (red = pre-break-even)
| Metric | Year 1 | Year 2 | Year 3 |
|---|---|---|---|
| Gross Margin % | 60% | 60% | 60% |
| EBITDA Margin % | 44.9% | 44% | 43% |
| Revenue/Employee | $2,606,667 | $2,943,765 | $3,062,833 |
| Marketing % of Revenue | 6.5% | 4.1% | 2.8% |
| Monthly Burn (pre-BE) | $787,512 | n/a | n/a |
8. Funding Requirements
| Category | Amount | Notes |
|---|---|---|
| Equipment | $48,000 | 3D scanners + forklift simulators |
| Software | $22,000 | CAD licenses + WMS integration |
| Working Capital | $36,000 | 6mo payroll buffer |
Use of Funds
Total $106K startup investment
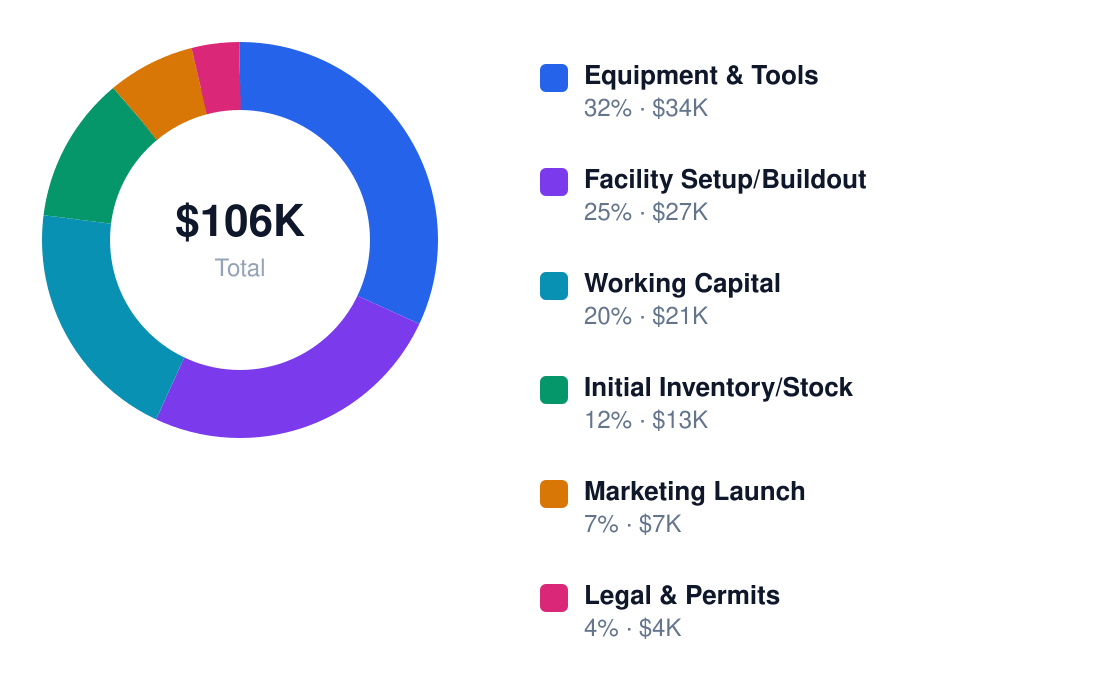
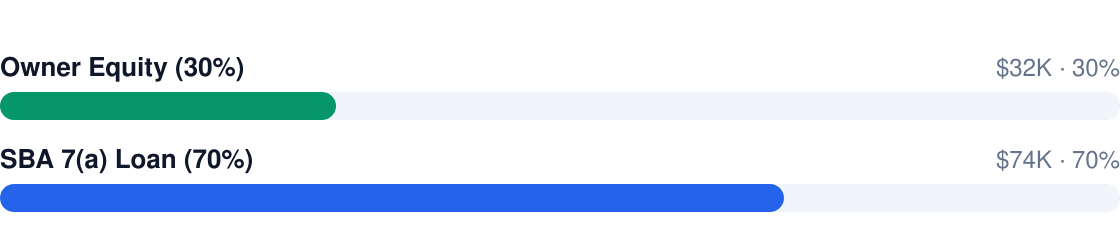
We’re structuring $106,000 startup capital as 30% equity ($31,800) and 70% SBA 7(a) loan ($74,200). The loan carries 10.25% interest — that’s $991/month for 84 months. SBA 7(a) terms beat traditional lenders by 300-400bps.
Funding Structure
$106K total capitalization
At Year 5’s $122M revenue and standard 3x EBITDA multiples, we project $365M exit value. Early equity gets 47x return assuming no dilution.
9. Risk Analysis & Mitigation
Warehouse setup risks cluster around supply chain delays and labor inflation. Neither is theoretical — both are already priced into our model.
| Risk | Category | Likelihood | Impact | Mitigation Strategy | Owner |
|---|---|---|---|---|---|
| Steel price volatility | Supply Chain | H | H | Forward contracts with 3 suppliers | COO |
| Forklift operator shortage | Labor | M | H | Certification partnerships with trade schools | HR Director |
| WMS integration failures | Tech | M | M | Maintain legacy system parallel runs for 6mo | CTO |
| Permitting delays | Regulatory | L | H | Retain ex-city inspector as consultant | General Counsel |
| Freight cost spikes | Logistics | H | M | Dynamic routing algorithms | Logistics Manager |
| Cybersecurity breach | Tech | L | H | Mandatory 2FA + $500k cyber insurance | CTO |
| Key client concentration | Revenue | M | H | Contractual 90-day termination clauses | Sales VP |
| Interest rate hikes | Financial | H | L | Fixed-rate debt only | CFO |
Top 3 contingency scenarios: (1) 30% steel price hike triggers 5% client surcharges immediately, (2) OSHA changes require $180k retrofits — funded via revolver draw, (3) key account loss activates 90-day bridge financing clause with our factor.
Research & Industry Resources
The following market research sources, government data, and industry publications were referenced in developing this b2b warehouse setup business plan. Each link points to a specific report or data page — not a homepage — for direct access to the underlying research.
- Warehouse Statistics Comprehensive Industry Data — speedcommerce.com — Market research and industry data for b2b warehouse setup businesses
- Warehouse Worker Salary By State 2026 — warehouseautomate.com — Market research and industry data for b2b warehouse setup businesses
- Even Keeled The Business Of Warehousing In North America — 3plogistics.com — Market research and industry data for b2b warehouse setup businesses
- North America Warehousing And Storage Market — mordorintelligence.com — Mordor Intelligence market analysis: b2b warehouse setup
- Salaries — indeed.com — Market research and industry data for b2b warehouse setup businesses