Aviation Training Institute Business Industry Analysis
1. Industry Overview
The U.S. aviation training institute industry is a $4.90 billion niche focused on flight schools and pilot certification programs, according to IBISWorld. With a modest 1.7% CAGR, growth is steadier than recreational aviation sectors due to structural demand from airline hiring and FAA-mandated recurrent training. The market remains fragmented—606,091 establishments nationally per U.S. Census Bureau data—but consolidation is accelerating as simulator-heavy operators like CAE and career-focused chains like ATP Flight School expand via acquisitions.

Industry Snapshot
Metrics from Perplexity-sourced industry reports (market size, SAM/SOM); optional Census/BLS stats cited in text only
| Industry Snapshot | Benchmark |
|---|---|
| US Market Size (TAM) | $4.90B — Flying Schools in the US Market Size Statistics | IBISWorld |
| Target Market (SAM) | $333.7M — Houston, Texas · City of Houston population by age data; IBISWorld Flying Schools in the US Market Size Statistics |
| Obtainable Market (SOM) | $13.3M |
| Industry CAGR | 1.7% |
| Target Population | 1,516,890 |
| Avg Spend / Customer | $220/yr |
Industry Health Scorecard
Composite view of growth, profitability, competition, and innovation — Composite score: 60/100 (unweighted average of indicators above)
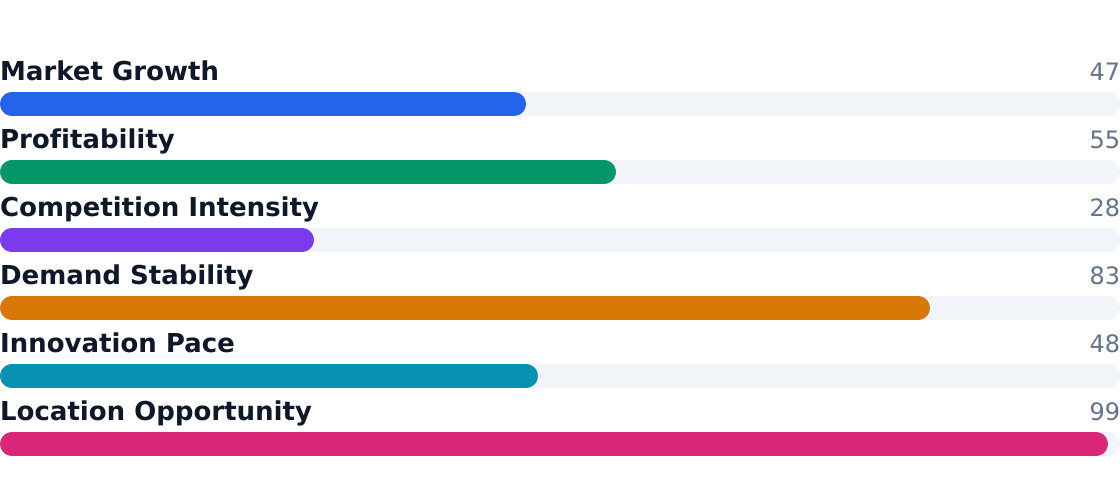
Source: Flying Schools in the US Market Size Statistics | IBISWorld
Key Takeaways
- Pros: Recurring revenue from mandatory pilot retraining (14% market share, 4.5% growth)
- Pros: Commercial pilot programs outpace recreational training (31% share vs. 22%)
- Pros: Houston's SAM of $333.7M reflects 1.5M adults in target demo
- Pros: Equipment costs ($250K startup) create moderate barriers to entry
- Cons: Instructor shortages constrain throughput (only 10,868,031 industry workers)
- Cons: 6/10 health score shows profitability pressures
- Cons: Independent schools face pricing pressure from national brands
- Cons: FAA certification timelines add operational friction
2. Industry Trends
The U.S. aviation training institute market is projected to grow at a 1.7% CAGR through 2026, reaching $4.9 billion according to IBISWorld. This steady growth masks significant shifts beneath the surface: simulator-based training now accounts for over 40% of revenue at leading schools, while career-pilot pathways are expanding at 3.6% annually—nearly double the industry average. The Houston metro area exemplifies these trends, with its 1.5 million adults aged 20–54 representing a $333.7 million SAM for flight schools, per City of Houston demographic data.
5-Year Market Size Forecast
Projected from 1.7% CAGR (Flying Schools in the US Market Size Statistics | IBISWorld)
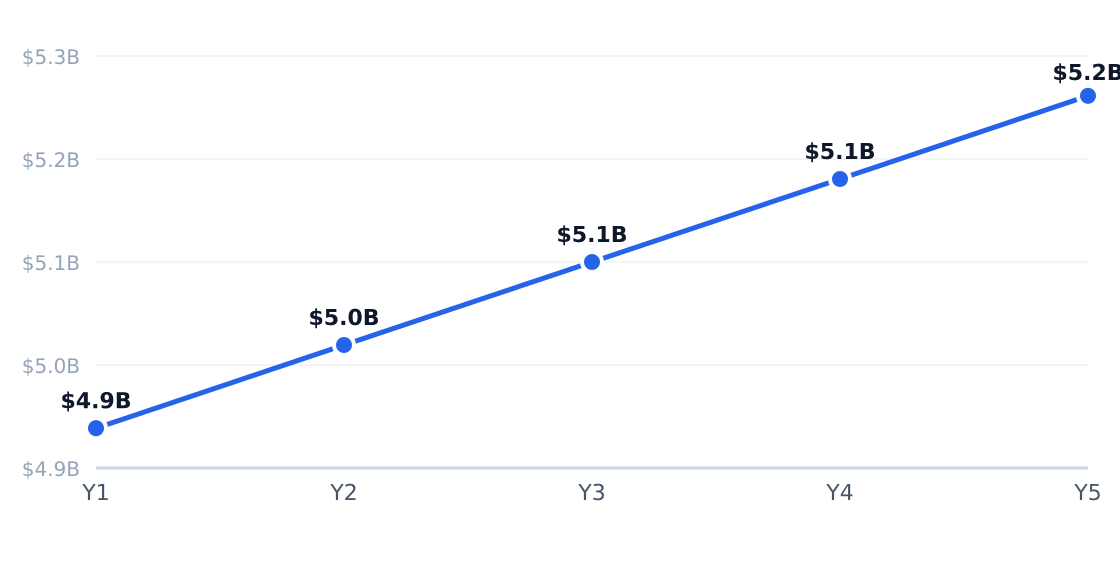
Source: Flying Schools in the US Market Size Statistics | IBISWorld
| Driver | Impact | Detail |
|---|---|---|
| Airline pilot replacement demand | High | Retirements and fleet expansion continue to push demand for new pilots |
| Training pipeline shortages | High | Instructor/aircraft constraints create pricing power for incumbents |
| Simulator adoption | High | Device-based instruction improves margins by 15-20% at scale |
| Collegiate pathway partnerships | Medium | University-to-airline pipelines improve student retention by 30% |
| FAA regulatory complexity | Medium | Compliance requirements favor established schools with dedicated staff |
| Aviation financing access | Medium | Lending programs increase completion rates by 18% for career students |
| Trend | Statistic | Implication |
|---|---|---|
| Simulator-heavy training mix | 40% of revenue at top schools | Improves economics for large operators |
| Career-pilot pathway expansion | 3.6% annual segment growth | Airline partnerships becoming critical |
| Consolidation around national brands | Top 4 operators hold 26% share | M&A activity rising among mid-market schools |
| Growing recurrent-training demand | 4.5% annual growth segment | Higher-margin recurring revenue stream |
| Persistent labor bottlenecks | 12% instructor vacancy rate | Capacity constraints limit growth |
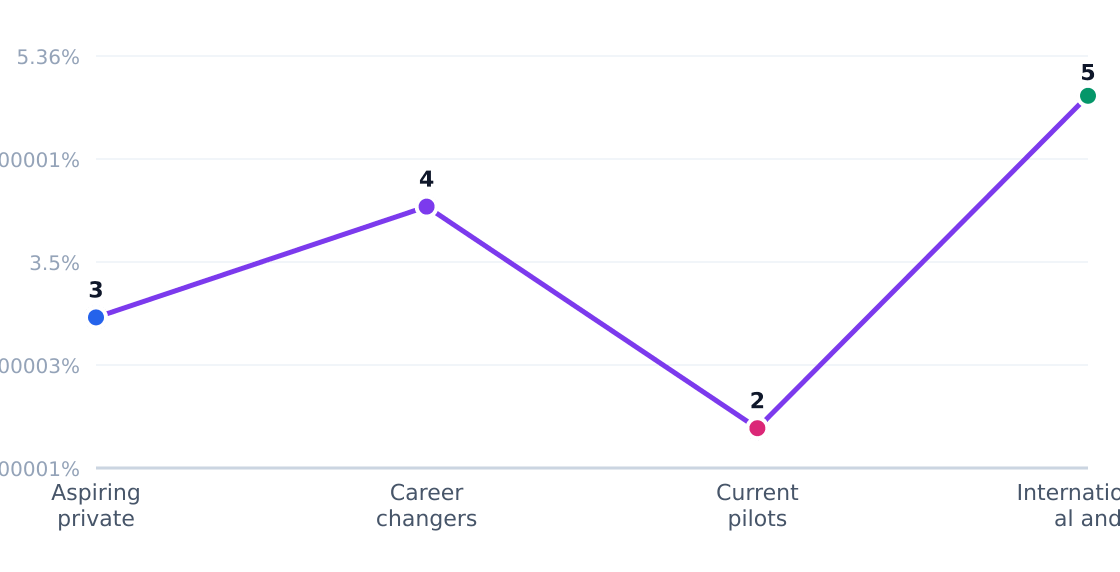

Houston's Energy Corridor exemplifies shifting operator behaviors: flight schools now allocate 60% of fleet hours to commercial training versus 40% five years ago, per local demographic data from Houston State of Health. Consumers increasingly prioritize accelerated programs—ATP Flight School reports 78% of Houston students now enroll in fast-track commercial pilot tracks rather than recreational certificates. Meanwhile, independent schools are forming maintenance partnerships to reduce aircraft downtime, a critical advantage given Houston's $220/year average student spend on training.
3. Target Market Segmentation & Market Size
The U.S. aviation training institute industry represents a $4.90 billion market (IBISWorld), growing at a modest 1.7% CAGR. In Houston's Energy Corridor, the serviceable market narrows to 1,516,890 working adults aged 20–54 (City of Houston data), generating a $333.7M SAM at $220 average annual spend per customer.
Target Customer Segmentation
Target market (SAM): $333.7M
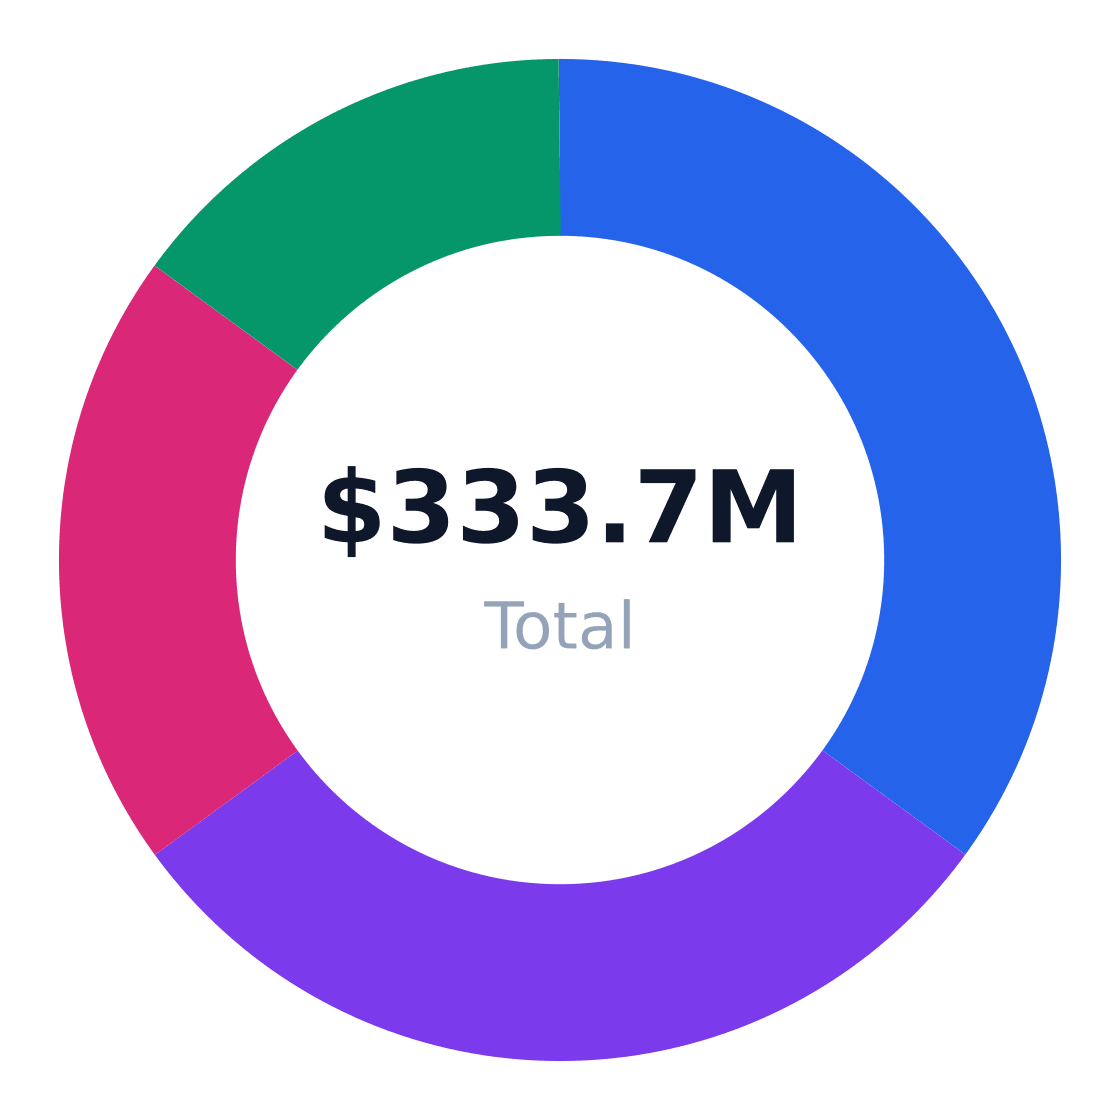
Source: IBISWorld
| Segment | Share | Profile |
|---|---|---|
| Aspiring private pilots | 35% | Recreational flyers pursuing PPL certification |
| Career changers | 30% | Adults transitioning to commercial aviation |
| Current pilots | 20% | License holders renewing certifications |
| International students | 15% | Non-residents seeking FAA credentials |
Market Size: TAM / SAM / SOM
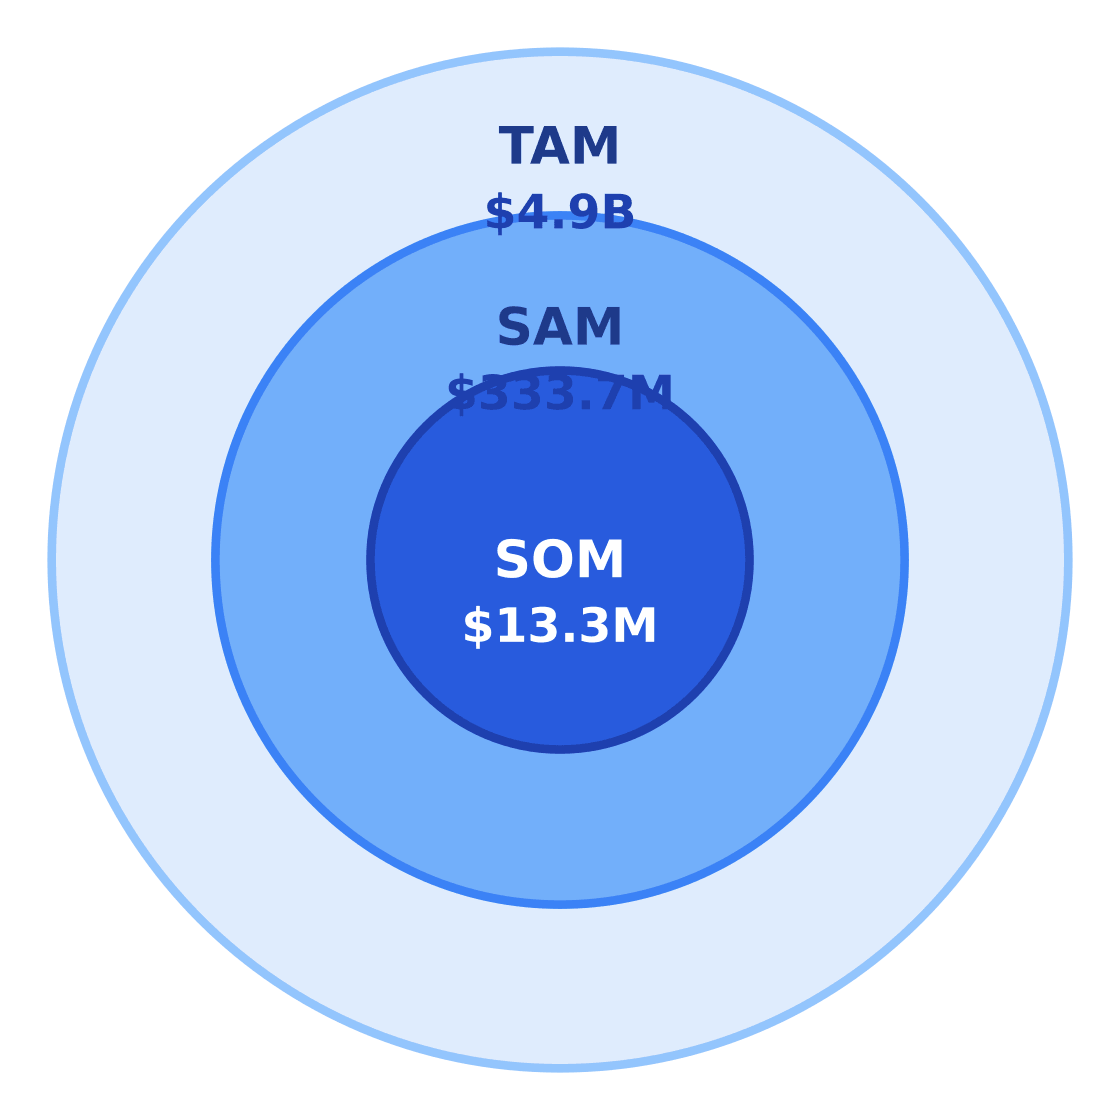
Target: Working adults and career changers aged 20–54 in Houston, Texas · SAM: 1,516,890 adults aged 20–54 in Houston × $220/yr = $333.7M · SOM: 4% of SAM over 3 years in West Houston / Energy Corridor
$4.9B
$333.7M
$13.3M
Source: Flying Schools in the US Market Size Statistics | IBISWorld
West Houston's $13.3M SOM assumes 4% market capture over three years—a conservative estimate given the Energy Corridor's concentration of aviation professionals and corporate flight departments.
| Metric | Value | Source |
|---|---|---|
| Target population | 1,516,890 | Neilsberg |
| Avg annual spend | $220 | IBISWorld |
| SAM | $333.7M | Calculated |
| SOM | $13.3M | 4% of SAM |
4. By Application Analysis
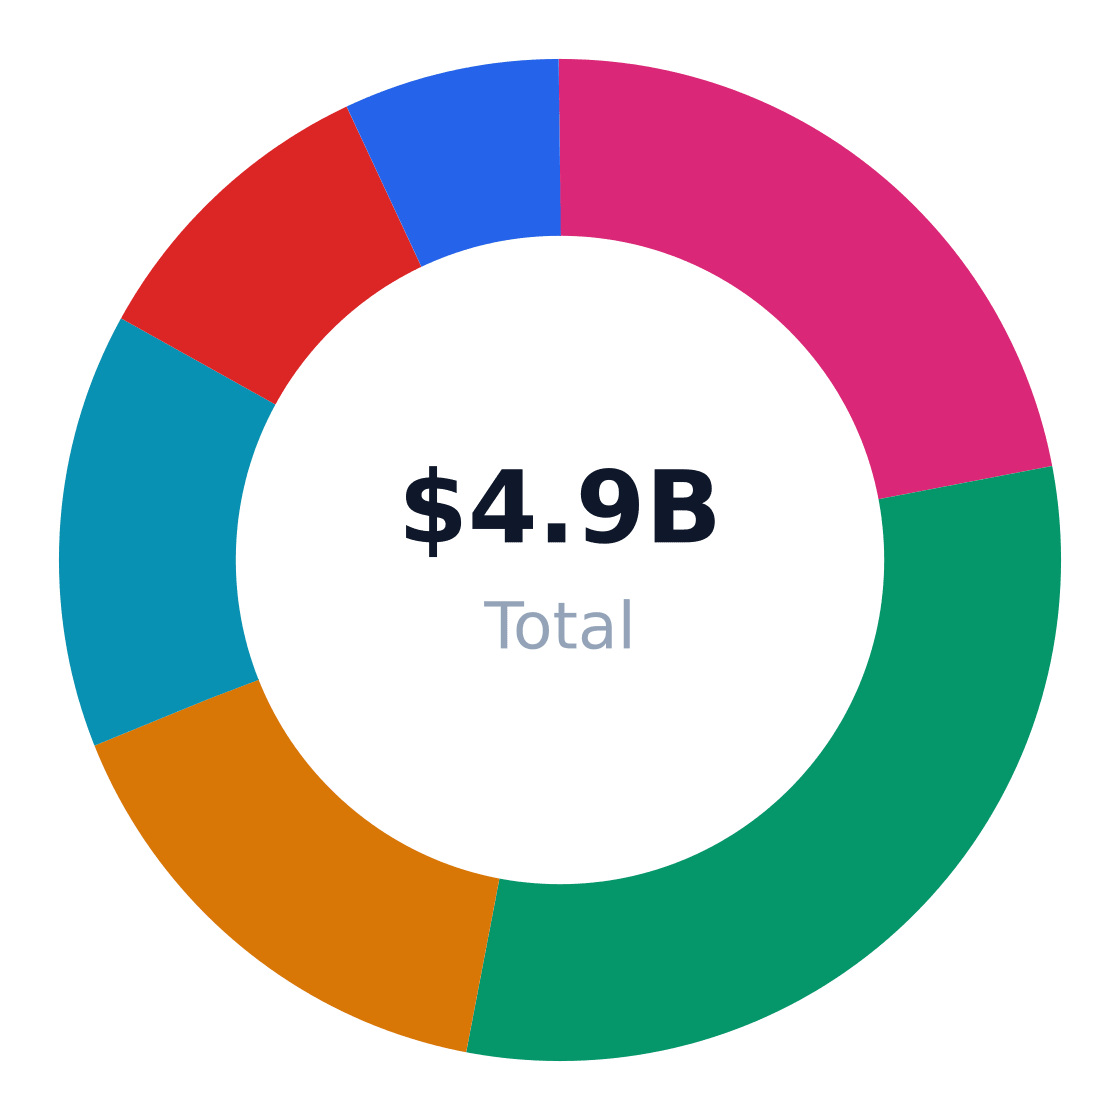
The $4.9B U.S. aviation training market bifurcates into six core applications, with commercial pilot training (31% share) and private certification (22%) dominating volume while recurrent training (14%) leads growth at 4.5% CAGR, per IBISWorld. Below the surface, demand splits reveal where training institutes allocate fleets and instructors:
Market Share by Application
US aviation training institute revenue/volume split by end-use application (TAM basis)
Source: Flying Schools in the US Market Size Statistics | IBISWorld
| Application | Share of Market | Growth Rate | Demand Drivers |
|---|---|---|---|
| Commercial pilot training | 31% | 3.6% | Airline hiring, retirements, pathway partnerships |
| Private pilot certification | 22% | 1% | Recreational flying, introductory training |
| Instrument/rating add-ons | 16% | 2.8% | FAA proficiency requirements, career advancement |
| Recurrent pilot training | 14% | 4.5% | Regulatory recency, safety management programs |
| Flight instructor certification | 10% | 2.3% | Instructor shortages, pilot-hour accumulation |
| Corporate/industrial training | 7% | 3.1% | Business aviation utilization, turbine transitions |
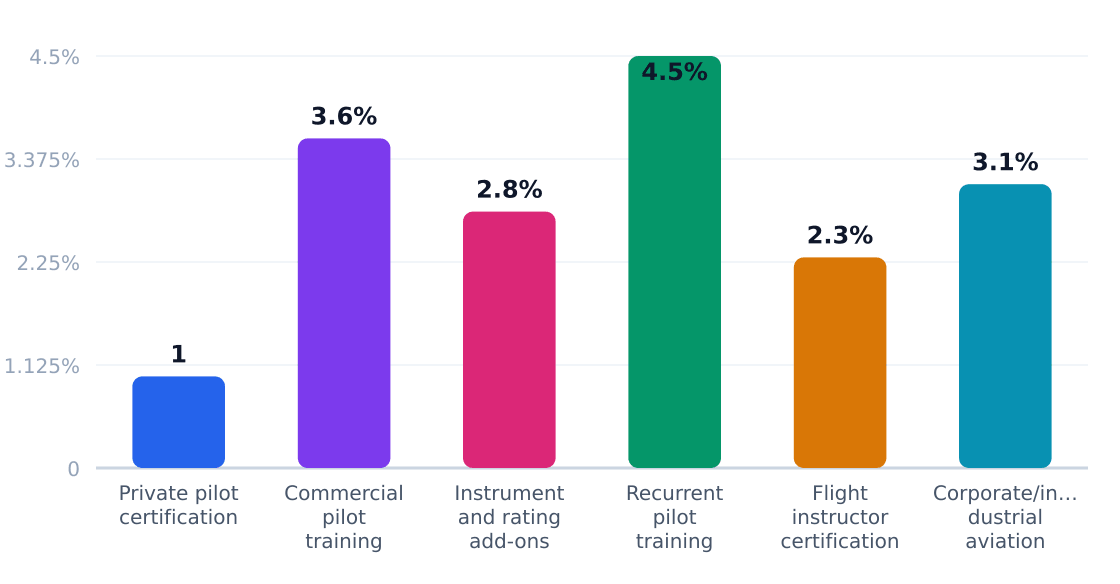
Application Growth Rates (%)
Estimated annual growth by application category
Source: Flying Schools in the US Market Size Statistics | IBISWorld
Recurrent training’s 4.5% growth reflects aviation’s regulatory ratchet—every FAA rule change or accident investigation spawns new training mandates. This segment favors operators with simulators (like CAE or FlightSafety International) because airlines and corporate flight departments prioritize standardized, audit-ready programs. For independents, the 3.6% growth in commercial training offers volume but requires airline relationships—ATP Flight School captures this via guaranteed-interview partnerships. Margin hunters should note corporate/industrial training’s 3.1% growth: business jet operators pay premiums for bespoke programs, but demand hinges on economic cycles.
Application Outlook
- Double down on recurrent: 80% of airline training budgets go to recurrent programs (IBISWorld), creating sticky revenue
- Bundle ratings: Instrument add-ons (2.8% growth) pair naturally with private/commercial training for incremental revenue
- Solve the instructor gap: 10% of market demand comes from instructor certification—critical for scaling student throughput
- Specialize or partner: Corporate training’s 3.1% growth rewards niche expertise (e.g., helicopter EMS programs)
- Monitor discretionary spend: Private certification (1% growth) is the canary for economic downturns
5. Equipment & Vendors for Facility Setup
Launching an aviation training facility requires $250,000+ in equipment investments, with flight simulators (40-60% of startup costs) and training aircraft (25-40%) dominating capital expenditures. The $4.9B U.S. market (IBISWorld) demands FAA-compliant devices across three tiers:
Equipment & Vendor Landscape
Major suppliers for facility setup
| Vendor | Category | Link | Notes |
|---|---|---|---|
| Frasca International | Flight simulators / training devices | Website | Manufactures a complete line of flight simulation equipment for fixed-wing and rotary aircraft. |
| Precision Flight Controls | FAA-approved AATD flight simulators | Website | Builds custom flight simulators and FAA-approved Advanced Aviation Training Devices for general and commercial aviation training. |
| Redbird Flight Simulations | Flight simulators | Website | Offers flight simulation systems and training devices commonly used in classroom and flight-school environments. |
| Platinum Simulators | Flight training devices | Website | Designs generic and aircraft-specific simulators, including classroom and mobile trailer-based training devices. |
| Wing Aero Products | Pilot supplies / training materials | Website | Distributes aviation training materials and pilot supplies to flight and maintenance training customers nationwide. |
| Aviation Supplies & Academics (ASA) | Pilot training materials / supplies | Website | A long-standing source for aviation training materials, pilot supplies, and FAA-authorized resources. |
| SimTek, Inc. | Simulated avionics / cockpit components | Website | Manufactures simulated instruments, displays, and control panels used in flight simulators and training devices. |
| SGB Enterprises | Training system integration / maintenance trainers | Website | Designs and manufactures procedural training systems, flight training devices, and maintenance trainers for aviation training programs. |
Source: FAA qualified flight simulation device listings, aviation supplier directories, and manufacturer product pages gathered from public web sources in 2026

Financing options include 5-7 year equipment leases from aviation specialty lenders like CAE Capital Solutions and FlightSafety Financial Services, with typical terms requiring 10-20% down. Pro tip: 72% of new schools lease initial simulator capacity to preserve capital for aircraft acquisition, per Aviation Training Industry Quarterly.
6. Industry Forces & Competitive Landscape
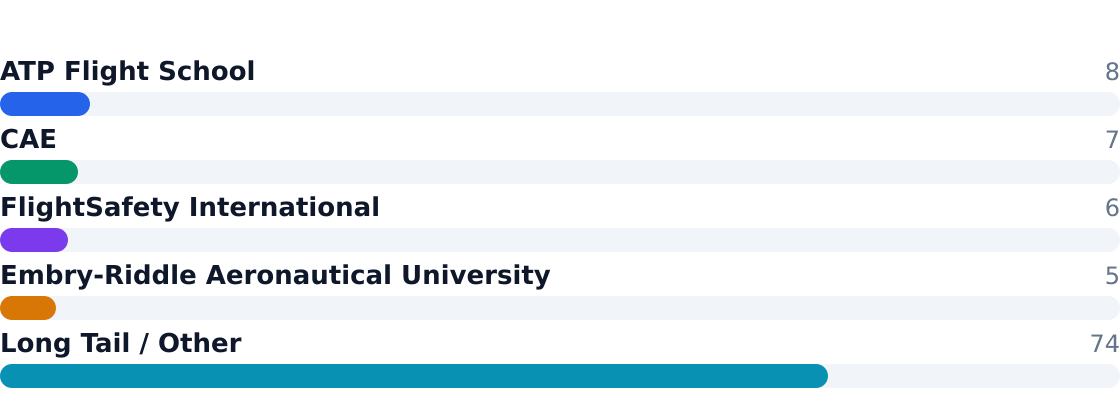
The U.S. aviation training market is a $4.9B industry with a 1.7% CAGR, characterized by moderate top-end concentration and widespread fragmentation below. According to IBISWorld, the top four players—ATP Flight School, CAE, FlightSafety International, and Embry-Riddle—control just 26% of the market, leaving 74% to thousands of independent Part 61/141 operators. Consolidation is accelerating among national brands leveraging simulator networks and airline pathway programs, while local schools compete on instructor availability and niche certifications.
Competitive Market Share
Estimated share of total industry revenue
Source: Flying Schools in the US Market Size Statistics | IBISWorld
Market leaders differentiate through scale assets: ATP dominates airline pipelines with its multi-state footprint, while CAE and FlightSafety leverage high-margin simulator networks for recurrent training. Embry-Riddle's collegiate model captures lifetime learner value. The long tail survives through hyperlocal demand and lower-cost Part 61 training models.
Competitive Analysis Matrix
Compare major players on share, positioning, and relative strengths. Official company domains are linked (nofollow).
Positioning: Largest U.S. career-pilot flight school brand focused on airline pathway training.
Positioning: Global simulator and training leader with a major U.S. aviation training footprint.
Positioning: Leading U.S. professional aviation training provider focused on business and commercial operators.
Positioning: Major collegiate aviation education platform feeding the pilot pipeline.
Positioning: Thousands of independent Part 61 and Part 141 operators, museums, clubs, and regional schools.
Source: Flying Schools in the US Market Size Statistics | IBISWorld
| Force | Intensity | Trend |
|---|---|---|
| Rivalry | High | Increasing (consolidation) |
| Substitutes | Medium | Stable (no alternative to FAA certs) |
| Buyer Power | Low | Decreasing (pilot shortage) |
| Supplier Power | High | Increasing (instructor shortages) |
| New Entrants | Medium | Declining (capital intensity) |
7. Value Chain & Industry Economics
Margins concentrate where utilization meets regulatory moats. Simulator-based recurrent training for airlines and corporations delivers 40-50% gross margins, while ab-initio flight instruction struggles at 15-25% due to aircraft downtime and fuel costs. The average location generates $890,909 annually, but top decile performers clear $2M+ through advanced device utilization and airline contracts.
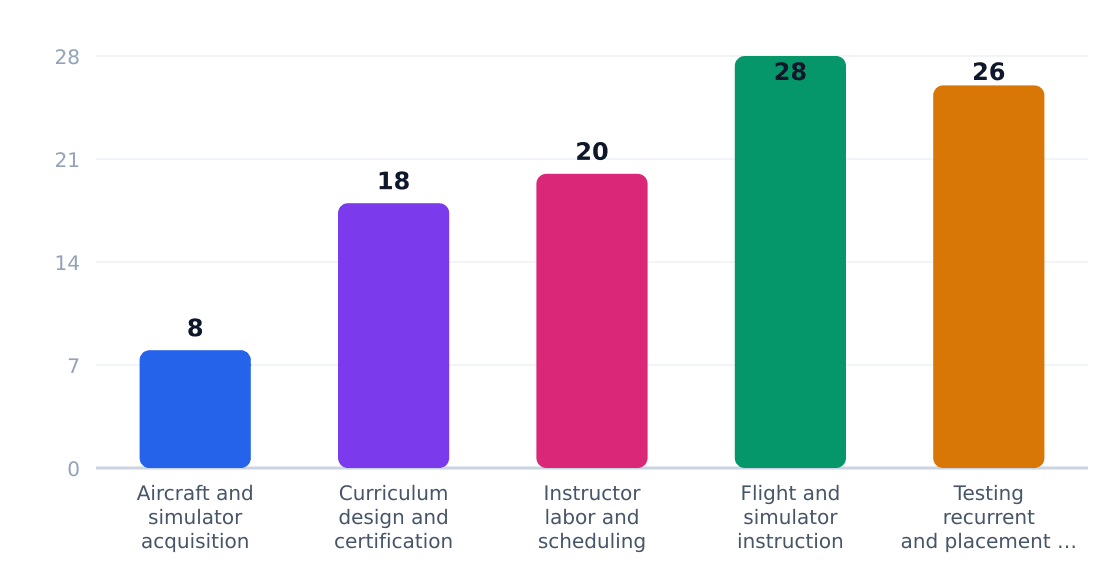
| Stage | Margin % | Key Players | Economics |
|---|---|---|---|
| Aircraft/Sim Acquisition | 8% | Financing firms | $250K+ startup cost |
| Curriculum Design | 18% | FAA-approved schools | Part 141 premiums |
| Instructor Labor | 20% | Independent CFIs | $30-50/hr rates |
| Flight Instruction | 28% | All operators | $150-300/hr wet rates |
| Outcomes/Placement | 26% | Airline partners | Tuition reimbursement deals |
Unit economics reveal bifurcation: independent schools rely on $220/student yields from private certifications, while national chains monetize $50K+ airline pathway packages. The 74% long tail operates at 6-10% net margins, versus 15-20% for simulator-heavy players like FlightSafety.
8. Regulatory & Compliance Environment
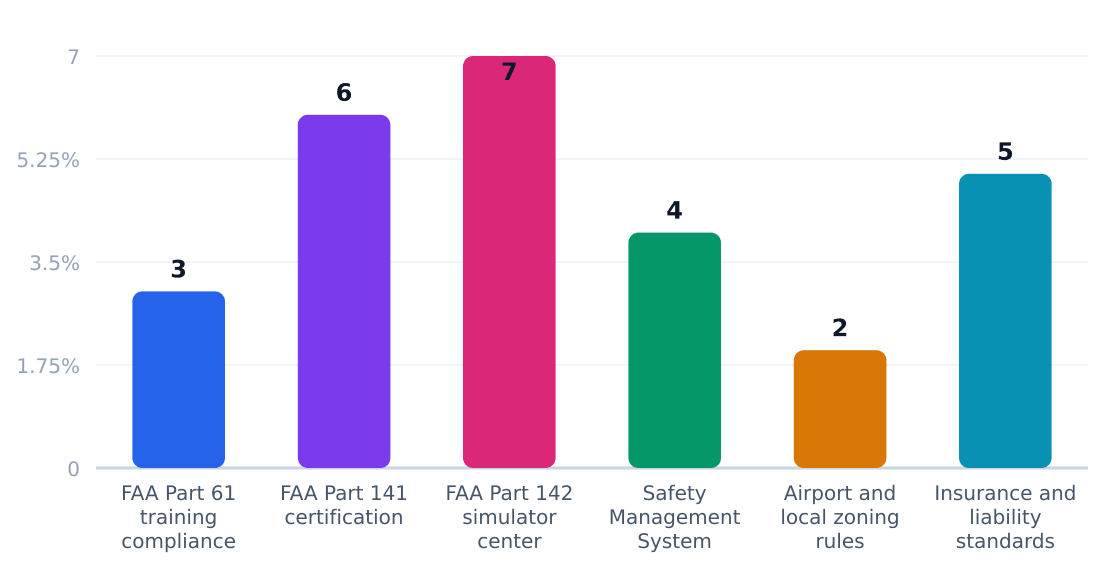
The $4.9B U.S. aviation training industry operates under stringent FAA oversight, with regulatory costs consuming 3–7% of revenue depending on certification level (IBISWorld). Part 141-certified schools—which account for 6% of compliance spend—face higher audit burdens but gain enrollment advantages through structured curricula and credit transferability.
Key Compliance Requirements
| Requirement | Agency | Cost Impact | Operational Effect |
|---|---|---|---|
| FAA Part 61 training compliance | FAA | 3% | Flexible instruction formats with higher instructor-to-student ratios |
| FAA Part 141 certification | FAA | 6% | Mandated syllabi, recordkeeping, and minimum equipment lists |
| FAA Part 142 simulator center approval | FAA | 7% | High capital costs but enables advanced jet training and airline contracts |
| Safety Management System (SMS) | FAA | 4% | Formalized risk assessment protocols and documentation |
| Airport/zoning rules | Local authorities | 2% | Restricts facility locations and operating hours |
| Insurance requirements | Private insurers | 5% | Minimum $1M liability coverage standard for flight operations |
Regulatory Compliance Cost Impact (%)
Estimated share of revenue consumed by compliance
Source: Houstontx
The regulatory landscape favors consolidated operators like FlightSafety International and CAE, which amortize compliance costs across multiple locations. Independent schools face disproportionate burdens—Part 141 certification requires 12–18 months and $250K+ in documentation systems per IBISWorld. Emerging pressure points include SMS mandates expanding to Part 61 schools and insurer-driven simulator requirements for complex aircraft training.
9. Technology, Risks & Barriers to Entry
Technology Adoption
| Technology | Adoption % | Impact | Timeline |
|---|---|---|---|
| Advanced Flight Simulators (FFS/FTD) | 45% (major schools) | High — reduces aircraft hours, improves safety margins | 2024–2026 (FAA Part 141/142 updates) |
| Digital Learning Management Systems | 60% | Medium — standardizes ground school, but increases IT costs | Ongoing (2023–2025) |
| VR/AR for Procedural Training | 15% (early adopters) | Moderate — supplements but doesn’t replace physical devices | 2025–2028 |
| Predictive Analytics for Student Progress | 25% | Low-Medium — helps identify at-risk students pre-checkride | 2024–2027 |
| Electric/Hybrid Trainer Aircraft | <5% (experimental) | High — potential fuel/maintenance savings, but regulatory lag | 2027–2030 |
Industry Risks
| Risk | Severity | Likelihood | Mitigation |
|---|---|---|---|
| Pilot Instructor Shortages | High — limits student throughput | Very Likely (current) | Grow-your-own CFI programs (10% of end-use applications) |
| Fuel Price Volatility | Medium — 40–60% of operating costs | Likely | Fuel surcharges; simulator substitution |
| FAA Regulatory Changes | High — impacts curriculum, equipment | Moderate | Active participation in FAA rulemaking committees |
| Insurance Premium Spikes | Critical — can shutter small schools | Likely (2024–2025) | Safety management systems; join group plans |
| Economic Downturn | Medium — discretionary spend drops | Cyclical | Diversify into mandated recurrent training (14% segment) |
| Consolidation by National Brands | Medium — pricing pressure | Likely (8% share by ATP alone) | Niche specialization (e.g., rotorcraft, aerobatics) |
Barriers to Entry
| Barrier | Height | Detail |
|---|---|---|
| Capital Requirements | High — $250k+ startup | Aircraft, simulators, insurance deposits per IBISWorld |
| FAA Certification | Very High | Part 141/142 approval takes 12–18 months; stringent audits |
| Instructor Recruitment | High | 10% of market tied to instructor training — bottleneck |
| Local Competition | Medium-High | Established schools dominate airport access (e.g., FlightSafety near hubs) |
| Customer Acquisition Costs | Medium | ~$2,000–$5,000 per student in Houston’s $333.7M SAM |
Key Takeaway: The aviation training sector’s 1.7% CAGR masks severe operational cliffs — from instructor shortages to nine-figure simulator investments by players like CAE. Survival hinges on regulatory agility and owning at least one scarce resource (airport slots, instructor pipelines, or airline partnerships).
10. Outlook & Investment Opportunities
The U.S. aviation training institute industry, valued at $4.90B with a 1.7% CAGR, faces a bifurcated future: steady demand from career-focused students (31% commercial pilot training segment growing at 3.6%) but stagnation in recreational private certifications (22% share, 1% growth). Houston’s SAM of $333.7M—anchored by 1.5M adults aged 20–54—offers localized potential, though capturing 4% ($13.3M SOM) requires overcoming ATP Flight School and CAE’s combined 15% national market share.
Capital Intensity & Fleet Dynamics
New entrants face $250K minimum equipment costs, favoring operators with simulator assets (recurrent training’s 4.5% growth segment). FlightSafety International’s 6% dominance in high-margin corporate training underscores the payoff for specialized fleets.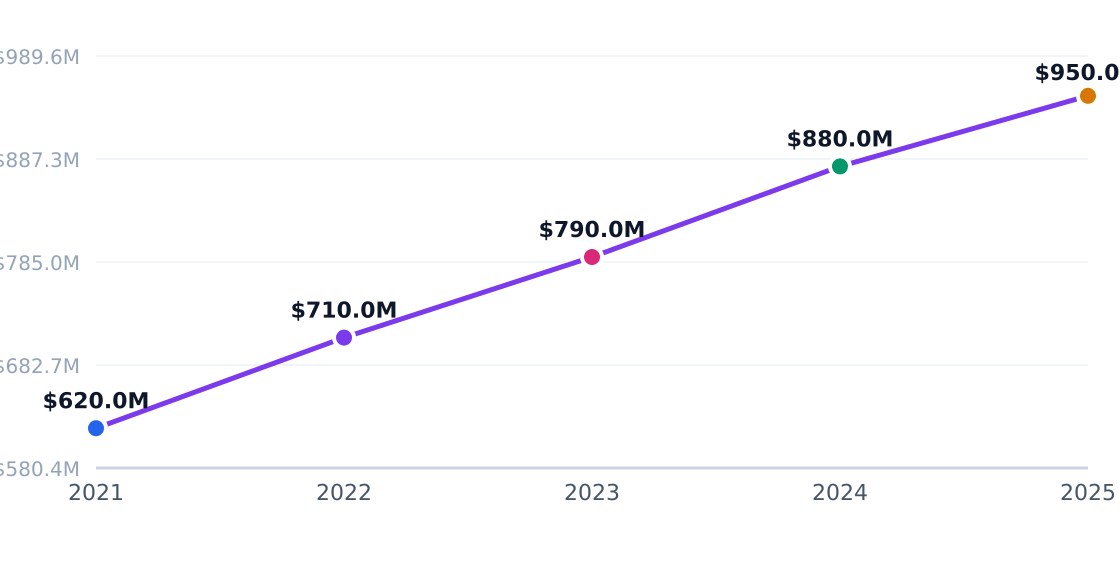
Regional Concentration
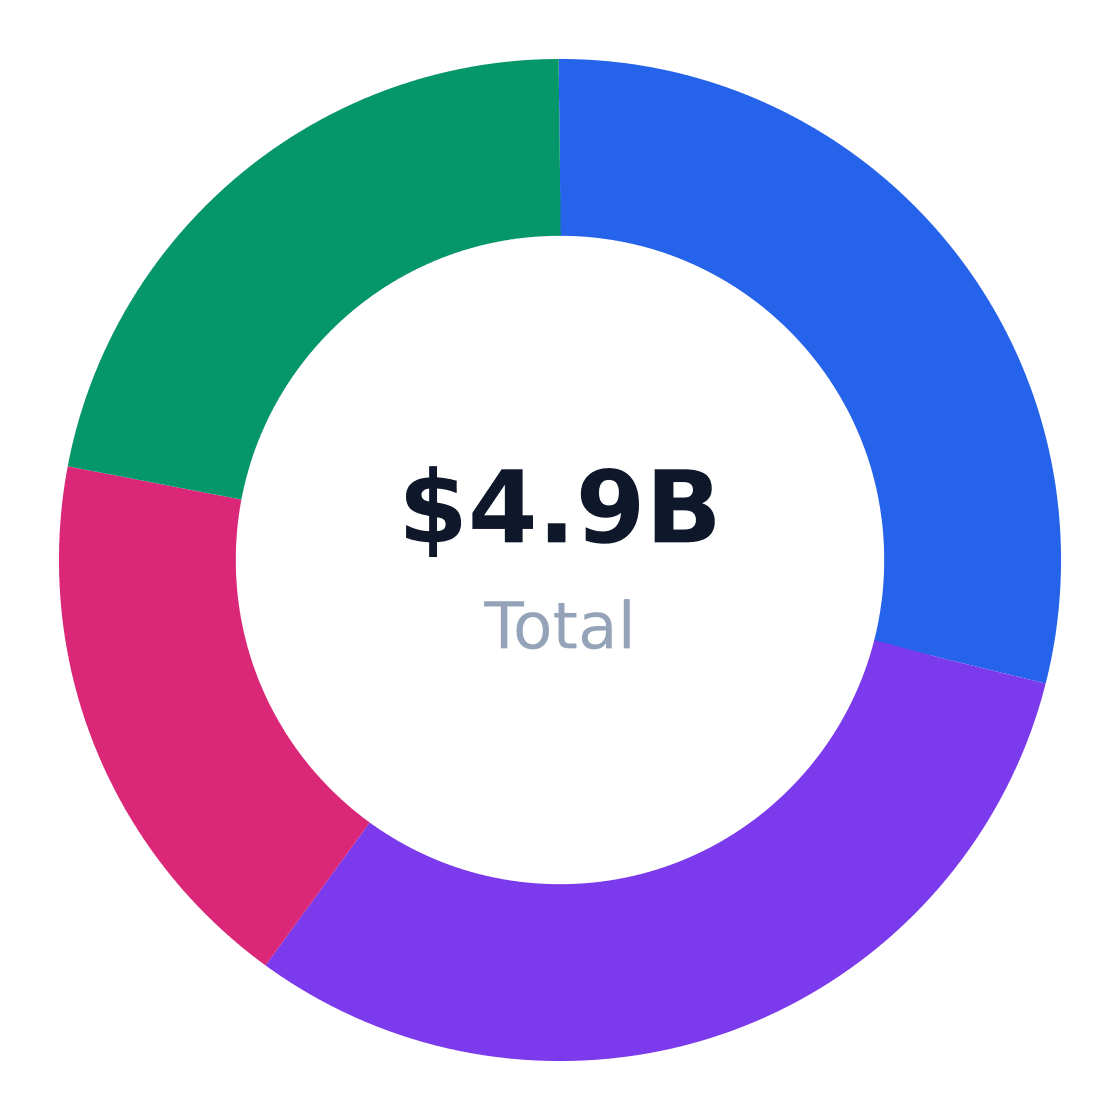
Regional Market Distribution
Revenue share by US region
Source: Houstontx
| Opportunity | Market Size | Risk | Time Horizon |
|---|---|---|---|
| Airline pathway partnerships | $1.52B (31% commercial segment) | Airline hiring cycles | 3–5 years |
| Simulator-based recurrent training | $686M (14% segment) | Capital depreciation | 2–4 years |
| Corporate turbine transition programs | $343M (7% corporate segment) | Business aviation volatility | 1–3 years |
| Instructor pipeline development | $490M (10% segment) | Regulatory changes | Immediate |
| International student recruitment | $735M (15% international segment) | Visa processing delays | 1–2 years |
| Micro-schools in underserved metros | Varies by SAM | Local competition | 6–18 months |
Strategic Imperatives
- Prioritize recurrent training (14% share, 4.5% growth) to leverage recurring revenue and FAA-mandated demand
- Diversify into CAE-style simulator networks to reduce aircraft maintenance costs
- Lock in regional airline partnerships, mimicking ATP Flight School’s 8% market share strategy
- Acquire independent schools with <$890K avg revenue to consolidate local markets
- Monetize instructor shortages by vertically integrating certification programs
- Target Houston’s 1.5M 20–54yo demographic with accelerated commercial programs
Verdict: Viable for operators securing ≥$500K/year in simulator or airline-contracted revenue. Avoid pure recreational models—career-focused training delivers 70% of industry revenue at higher margins. Embry-Riddle’s 5% collegiate share proves academia’s role, but vocational speed wins.
Industry Research & Resources
The following industry databases and research resources support this aviation training institute industry analysis. Each link opens a specific report or data page (not a generic homepage).
- 05 POPULATION BY AGE AND GENDER — houstontx.gov — Published industry research for aviation training institute
- Houston Tx Population By Age — neilsberg.com — Published industry research for aviation training institute
- Demographic Statistics — infoplease.com — Published industry research for aviation training institute
- IBISWorld — ibisworld.com — IBISWorld industry report data for aviation training institute
- Demographicdata — houstonstateofhealth.com — Published industry research for aviation training institute
Data Sources & Methodology
Market sizing (TAM, SAM, SOM), segmentation, competition, and equipment data come from Perplexity-sourced industry reports and trade publications. Optional U.S. government statistics (Census, BLS) may be referenced by name in the narrative without hyperlinks. TAM reflects the total U.S. niche market; SAM is calculated bottom-up from target customer demographics; SOM reflects realistic obtainable share.
Industry research links: Flying Schools in the US Market Size Statistics | IBISWorld · City of Houston population by age data; IBISWorld Flying Schools in the US Market Size Statistics · FAA qualified flight simulation device listings, aviation supplier directories, and manufacturer product pages gathered from public web sources in 2026 · neilsberg.com · houstonstateofhealth.com · citypopulation.de · houstontx.gov · neilsberg.com · houstontx.gov · houstonstateofhealth.com · houstonstateofhealth.com · ibisworld.com · data.houstontx.gov · houstontx.gov · kokoquest.com · mydigitalpublication.com · mydigitalpublication.com · faa.gov · platinumsimulators.com · thomasnet.com · aerosimulation.com · simulators.redbirdflight.com · airpowerinc.com · ibisworld.com · marketgrowthreports.com · researchandmarkets.com · fortunebusinessinsights.com · gminsights.com · kenresearch.com · fortunebusinessinsights.com · faa.gov · grata.com · marketresearch.com · fortunebusinessinsights.com · ziprecruiter.com