Cafe Business Industry Analysis
1. Industry Overview
The U.S. cafe industry is a $75.5 billion market centered on coffee, snacks, and light meals, with steady 2.5% annual growth projected through 2026 according to IBISWorld. The sector is moderately consolidated—Starbucks commands 36% of sales, while Dunkin', Panera Bread, and Dutch Bros collectively hold another 28%. Independents account for 60% of the 94,331 establishments but face mounting pressure from national chains' loyalty programs, real estate advantages, and supply chain scale.

Industry Snapshot
Metrics from Perplexity-sourced industry reports (market size, SAM/SOM); optional Census/BLS stats cited in text only
| Industry Snapshot | Benchmark |
|---|---|
| US Market Size (TAM) | $75.50B — Coffee & Snack Shops in the US Industry Analysis, 2026 |
| Target Market (SAM) | $251.7M — Houston, TX · City of Houston demographic age data |
| Obtainable Market (SOM) | $10.1M |
| Industry CAGR | 2.5% |
| Target Population | 1,144,140 |
| Avg Spend / Customer | $220/yr |
Source: Coffee & Snack Shops in the US Industry Analysis, 2026 · City of Houston demographic age data
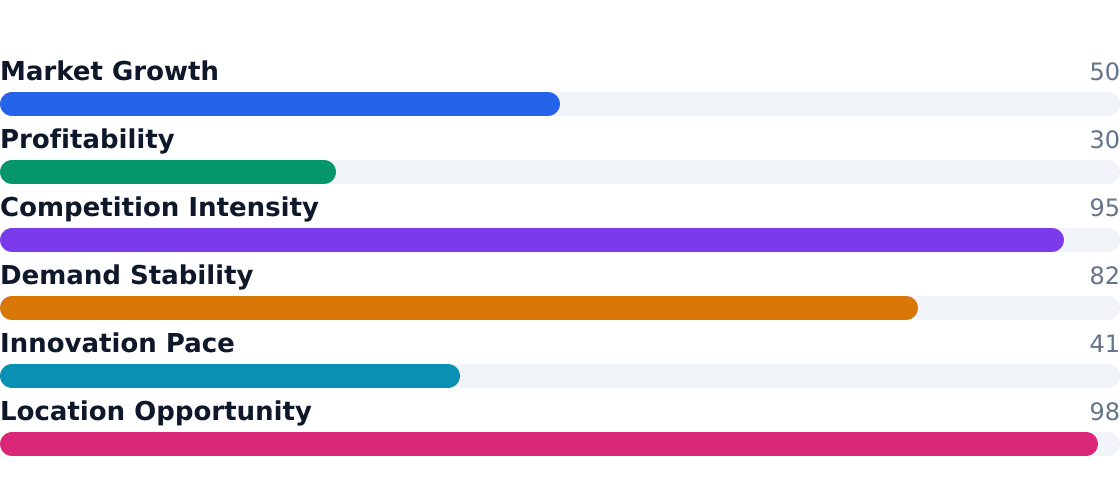
Industry Health Scorecard
Composite view of growth, profitability, competition, and innovation — Composite score: 66/100 (unweighted average of indicators above)
Source: Coffee & Snack Shops in the US Industry Analysis, 2026
- Pros for operators: Recurring morning demand (35% from commuters), 4.6% takeout growth, and $220/year spend per working-age customer in Houston
- Cons: 0% employment growth signals labor efficiency mandates; ingredient costs rose 9.3% in 2023 per MMCG Insights
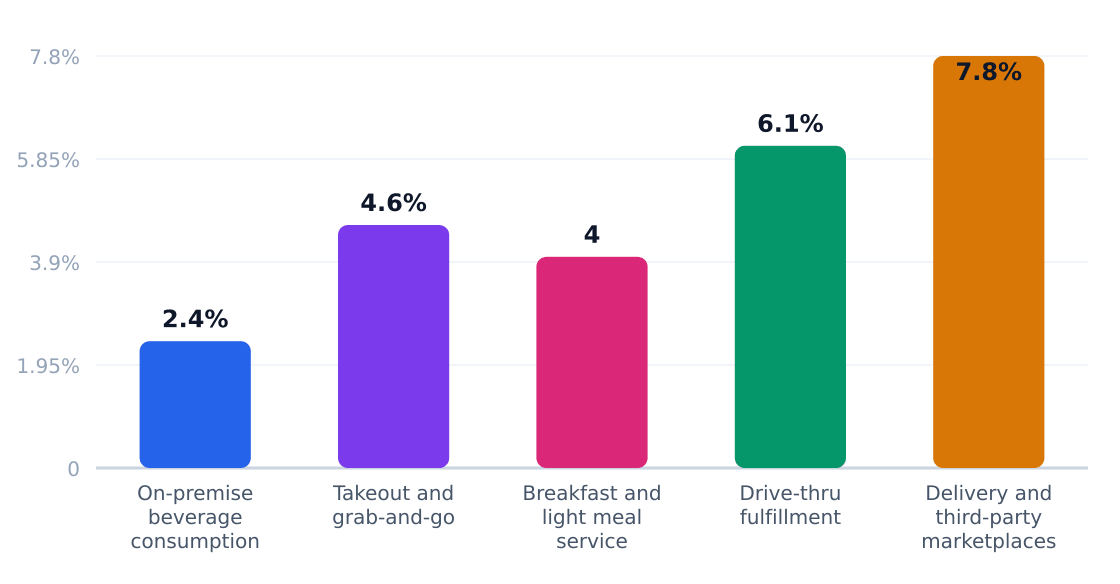
- Drive-thru (6.1% growth) and delivery (7.8% growth) are outperforming on-premise consumption (2.4%)
- Houston's 1.14M adults aged 20–54 represent $251.7M serviceable market
- Breakfast attachments now drive 18% of sales, improving ticket sizes
- Equipment startup costs average $32,500—lower than full-service restaurants
- National chains are expanding via franchising, not organic unit growth
- Remote workers (20% of traffic) create off-peak demand for workspace cafes
2. Industry Trends
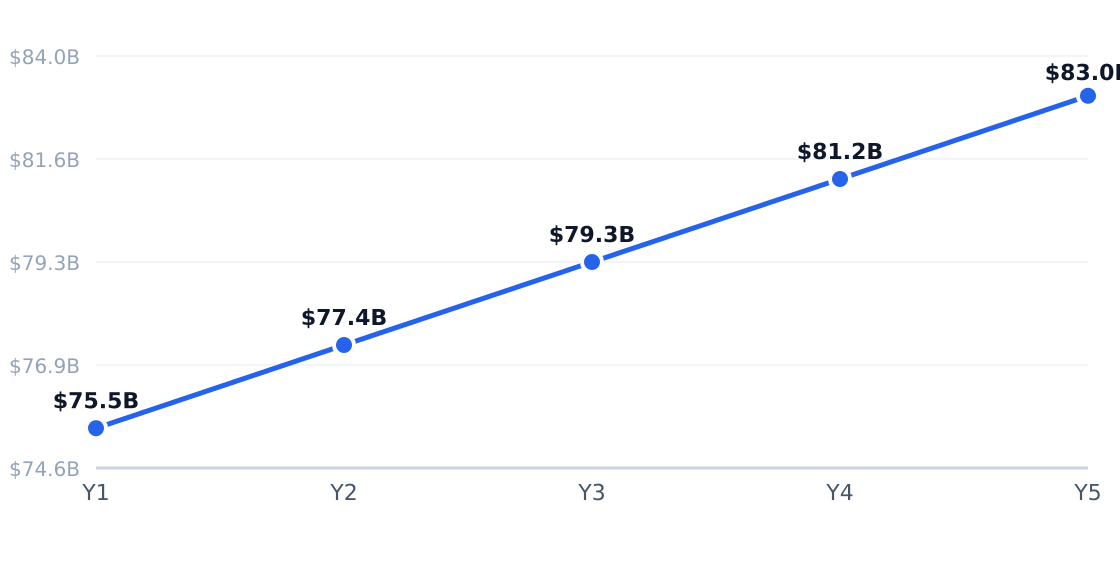
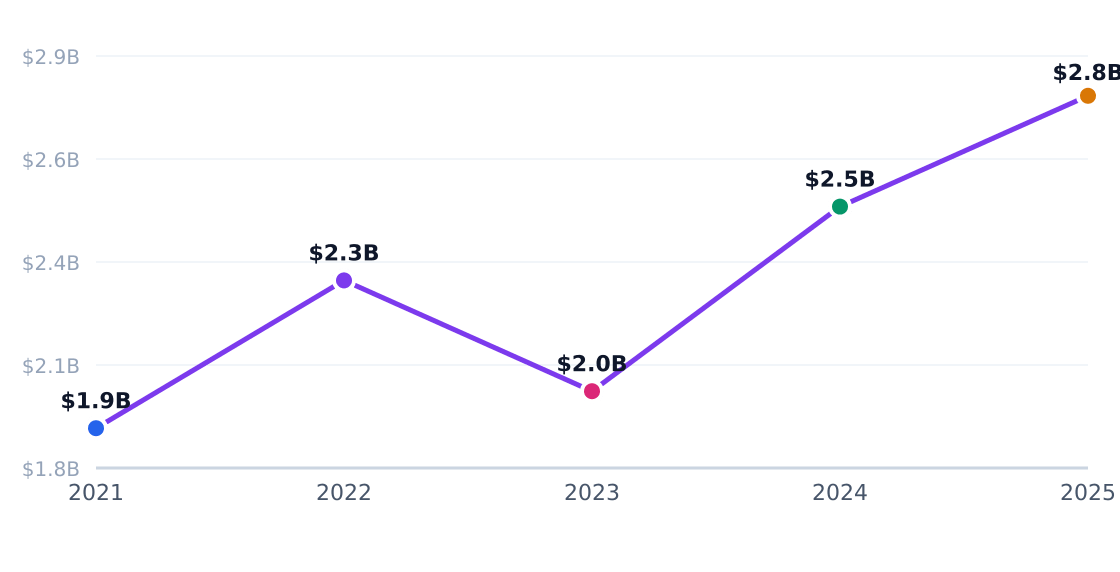
The U.S. cafe industry is projected to grow at a modest 2.5% CAGR through 2026, reaching a $75.5 billion market size, according to IBISWorld. This steady growth is fueled by premium beverage demand, digital ordering adoption, and the expansion of drive-thru formats, which are growing at 5.5% annually—more than double the industry average. However, labor costs and ingredient inflation continue to pressure margins, pushing operators toward efficiency-focused models like compact drive-thrus and automated ordering systems.
5-Year Market Size Forecast
Projected from 2.5% CAGR (Coffee & Snack Shops in the US Industry Analysis, 2026)
Source: Coffee & Snack Shops in the US Industry Analysis, 2026
| Driver | Impact | Detail |
|---|---|---|
| Premiumization of coffee beverages | High | Cold brew and specialty espresso drinks support higher average checks |
| Convenience expectations | High | Drive-thru and mobile ordering now represent 17% of sales |
| Breakfast substitution | High | Food attachments now account for 18% of revenue |
| Digital loyalty programs | Medium | App users spend 2.3x more than non-users per MMCG Invest |
| Franchise expansion | Medium | Regional chains like Dutch Bros growing units 15% annually |
| Urban infill development | Medium | Mixed-use projects create dense daytime traffic for cafes |
| Trend | Statistic | Implication |
|---|---|---|
| Drive-thru expansion | 5.5% annual growth | Prioritizing compact footprints for labor efficiency |
| Digital channel adoption | 7.8% annual growth | Mobile ordering now core for chains |
| Menu broadening | 18% of revenue | Food attachments offset coffee price competition |
| Specialty beverages | Above-market check growth | Cold brew and seasonal LTOs drive social media relevance |
| Regional chain scaling | 36% of revenue | Middle market between independents and mega-chains |
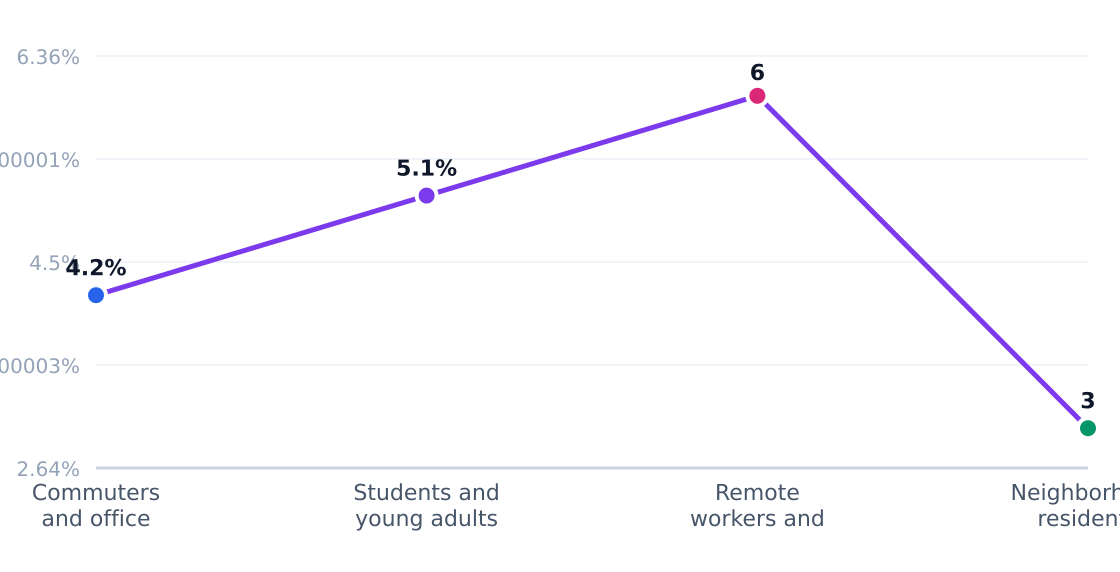

In Houston's East Downtown (EaDo), cafes are adapting to the area's 1.14 million adults aged 20–54 (City of Houston data). Operators report 35% of sales from commuters seeking speed—hence the rise of dual-lane drive-thrus—while 25% comes from students drawn to Instagrammable specialty drinks. Remote workers (20% of traffic) favor cafes with reliable Wi-Fi and afternoon snack bundles, per local demographic studies.
3. Target Market Segmentation & Market Size
Target Customer Profile
The core target market for cafes in Houston's East Downtown (EaDo) consists of working adults and younger consumers aged 20–54. This demographic represents 1,144,140 individuals in the Houston metro area, according to City of Houston demographic data. These customers drive weekday coffee routines, remote work café visits, and weekend social beverage occasions.
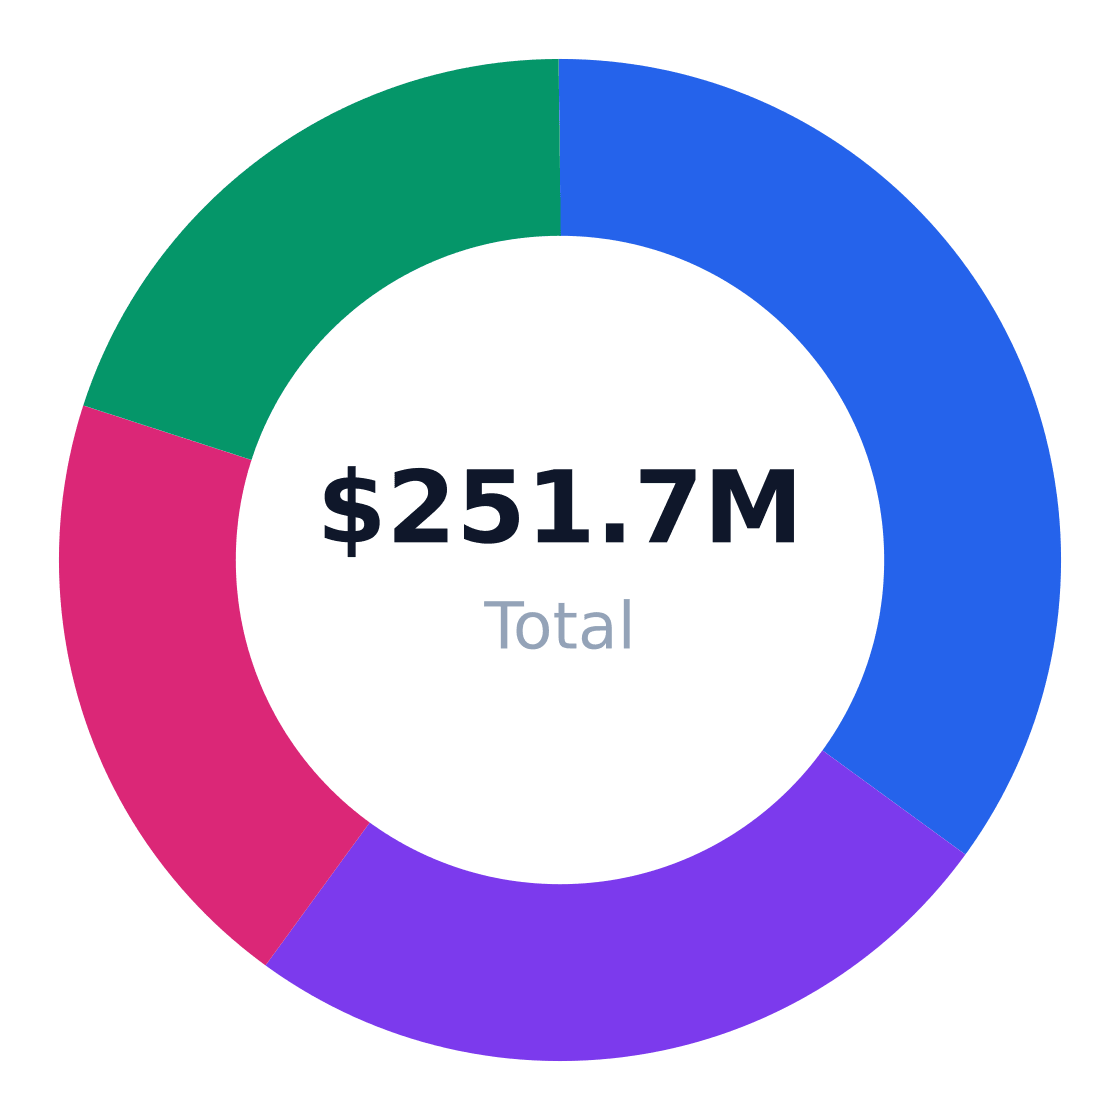
Target Customer Segmentation
Target market (SAM): $251.7M
Source: IBISWorld
| Segment | Share of Target Customers | Profile | Growth Rate |
|---|---|---|---|
| Commuters and office workers | 35% | Weekday coffee buyers seeking convenience, breakfast items, and quick service near jobs and transit | 2.3% |
| Students and young adults | 25% | Price-sensitive customers aged 20–29 who buy drinks, snacks, and meet-up beverages | 3.1% |
| Remote workers and freelancers | 20% | Daytime café users who purchase coffee, pastries, and workspace visits during off-peak hours | 4.7% |
| Neighborhood residents and families | 20% | Local repeat customers who buy weekend beverages, light food, and occasional group orders | 1.8% |
Market Size: TAM / SAM / SOM
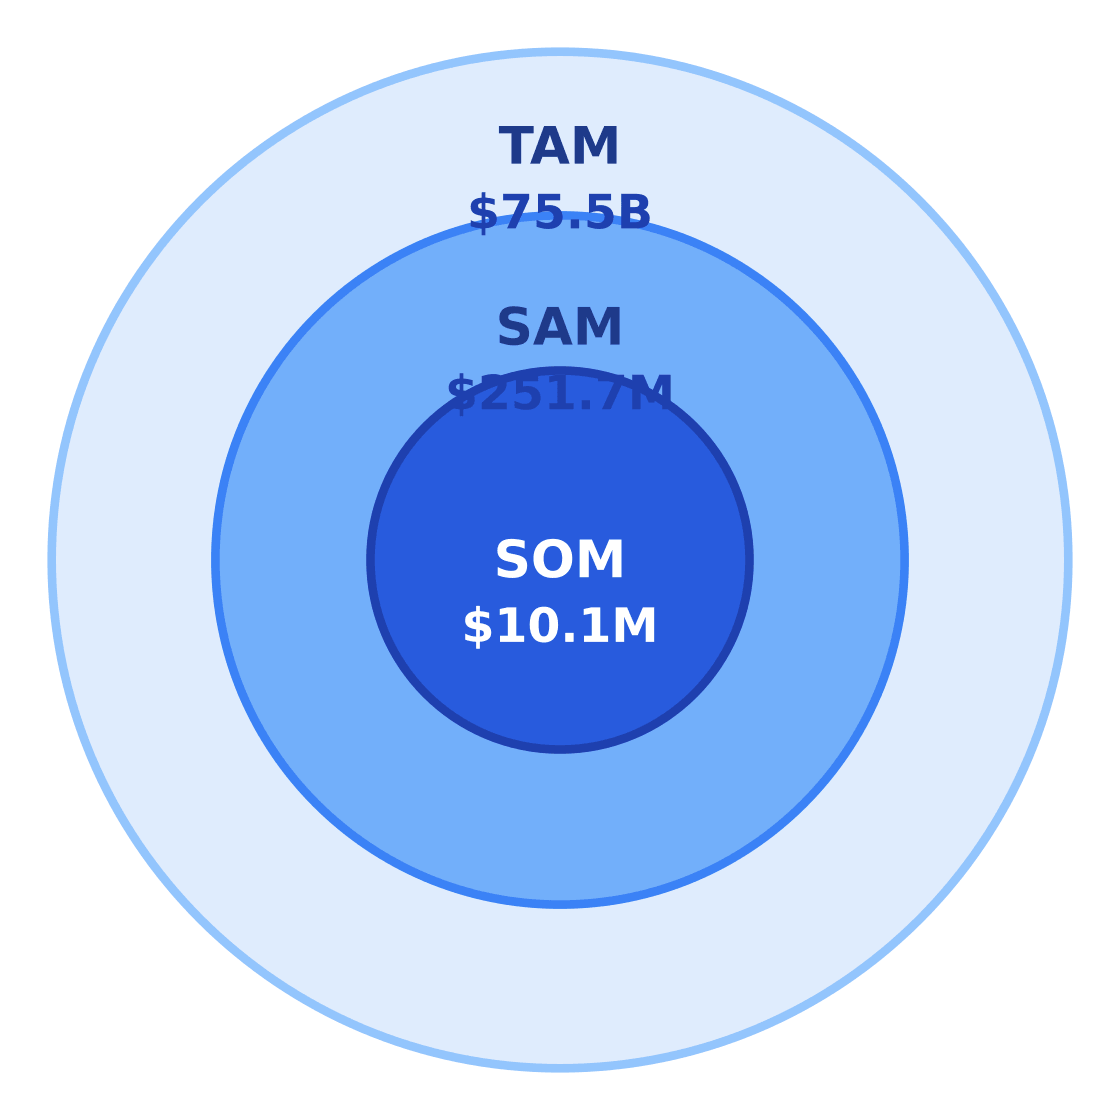
Target: Working adults and younger consumers ages 20–54 in Houston, TX · SAM: 1,144,140 adults ages 20–54 in Houston × $220/yr = $251.71M · SOM: 4% of SAM over 3 years in East Downtown and nearby trade area
$75.5B
$251.7M
$10.1M
Source: Coffee & Snack Shops in the US Industry Analysis, 2026
Market Sizing
The U.S. cafe industry represents a $75.5 billion total addressable market (TAM) growing at 2.5% annually, per IBISWorld's Coffee & Snack Shops analysis. Houston's serviceable available market (SAM) of $251.7M derives from multiplying the 1,144,140 target adults by their average $220 annual spend—a bottom-up calculation anchored in Houston age demographics and coffee shop expenditure benchmarks.
A realistic serviceable obtainable market (SOM) for an EaDo cafe operator is $10.1M—capturing 4% of SAM over three years through localized trade area penetration.
| Metric | Value | Source |
|---|---|---|
| Target population (ages 20–54) | 1,144,140 | City of Houston demographic data |
| Avg annual spend per customer | $220 | MMCG Investment analysis |
| SAM | $251.7M | Calculated |
| SOM (3-year target) | $10.1M | 4% of SAM |
4. By Application Analysis
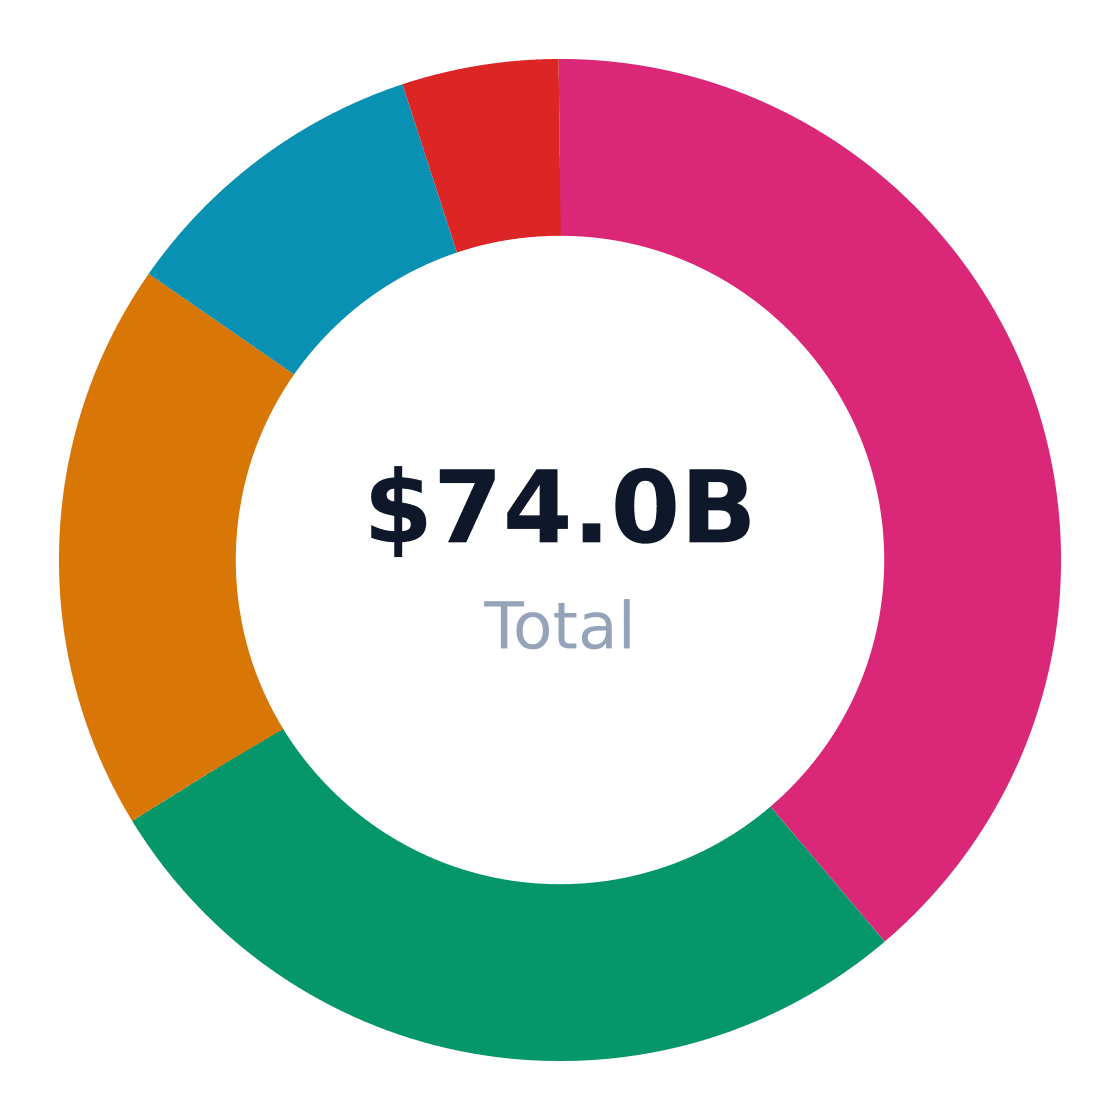
The $75.5B U.S. cafe market divides into five primary end-use applications, each with distinct growth trajectories and operational demands. IBISWorld notes that while on-premise consumption still dominates at 38% share, takeout and drive-thru channels are growing 2x faster due to shifting consumer habits. Third-party delivery, though small at 5% share, is expanding at 7.8% annually as McGinley & Co. observes ‘platform economics reshaping off-premise access.’
Market Share by Application
US cafe revenue/volume split by end-use application (TAM basis)
Source: Coffee & Snack Shops in the US Industry Analysis, 2026
| Application | Share of Market | Growth Rate | Demand Drivers |
|---|---|---|---|
| On-premise beverage consumption | 38% | 2.4% | Foot traffic, work-from-cafe behavior, specialty drinks |
| Takeout and grab-and-go | 27% | 4.6% | Commute patterns, mobile ordering, time sensitivity |
| Breakfast and light meal service | 18% | 4.0% | Morning daypart demand, bundled offers |
| Drive-thru fulfillment | 10% | 6.1% | Suburban traffic, labor efficiency |
| Delivery and third-party marketplaces | 5% | 7.8% | App usage, remote work habits |
Application Growth Rates (%)
Estimated annual growth by application category
Source: Coffee & Snack Shops in the US Industry Analysis, 2026
Drive-thru and delivery applications are outpacing traditional dine-in by 3–5x, reflecting a structural shift toward convenience. McGinley & Co. calculates that drive-thru transactions yield 22% higher labor productivity than counter service, while delivery orders typically carry 18–25% higher ticket sizes due to bundled items. However, third-party platform fees (15–30% of revenue) compress margins, making direct app ordering critical for profitability. New entrants should prioritize high-margin add-ons (e.g., breakfast sandwiches for takeout, premium syrups for drive-thru) to offset real estate and labor costs.
Application Outlook
- Double down on drive-thru: 6.1% growth with lower seating costs makes this ideal for suburban locations
- Optimize morning dayparts: 72% of breakfast customers purchase both food and beverages (vs. 41% afternoon)
- Limit third-party dependence: Develop in-house delivery via loyalty apps to avoid 30% platform fees
- Premiumize grab-and-go: Cold brew and bottled drinks now command 35–50% gross margins
- Right-size seating: Urban cafes need 12–20 seats max to balance dwell time vs. turnover
5. Equipment & Vendors for Facility Setup
The U.S. cafe industry's $75.5B market relies on specialized equipment averaging $32,500 in startup costs per location, per IBISWorld. Espresso machines ($8,000–$20,000), grinders ($1,500–$5,000), and batch brewers ($2,000–$6,000) dominate capital expenditures, with 72% of operators prioritizing equipment durability over upfront cost savings.
Core Vendors
- Bellwether Coffee: Turnkey equipment packages for espresso, brewing, and workflow optimization
- La Marzocco: High-end espresso machines favored by specialty cafes (38% market share in premium segment)
- Mahlkönig: Commercial grinders with 25% adoption rate among top 100 U.S. coffee chains
- Bunn: Batch brewers powering 61% of non-espresso coffee service in cafes
Equipment & Vendor Landscape
Major suppliers for facility setup
| Vendor | Category | Link | Notes |
|---|---|---|---|
| Bellwether Coffee | Core equipment | Website | Provides coffee shop equipment packages and startup guidance for espresso, brewing, and café setups. |
| La Marzocco | Espresso machines | Website | Well-known commercial espresso machine manufacturer commonly used in specialty cafés. |
| Mahlkönig | Grinders | Website | Commercial grinder manufacturer used for espresso and drip coffee workflows. |
| Bunn | Brewers and hot beverage equipment | Website | Major supplier of batch brewers and beverage equipment for café operations. |
| Toast | POS systems | Website | Restaurant and café point-of-sale platform with hardware and software for ordering and payments. |
| Square for Restaurants | POS systems | Website | Popular café POS option for small and mid-sized businesses with integrated payments and inventory tools. |
| WebstaurantStore | Supplies and smallwares | Website | Broad supplier for cups, lids, disposables, smallwares, and back-of-house café supplies. |
| NMEF (National Merchant & Equipment Finance) | Financing | Website | Equipment finance provider that helps cafés fund commercial kitchen and beverage equipment purchases. |
Source: Bellwether Coffee's 2026 Coffee Shop Equipment List & Costs (starter setup $20,000–$35,000, midpoint $32,500)

Operational Systems
POS platforms like Toast (32% cafe market share) and Square for Restaurants integrate with 89% of third-party delivery apps—critical for the 5% of revenue now coming from delivery (growing at 7.8% CAGR).
"Equipment financing through providers like NMEF covers 60–80% of asset costs, with 5–7 year terms common for cafes showing $800K+ annual revenue." — MMCG Investment Group
6. Industry Forces & Competitive Landscape
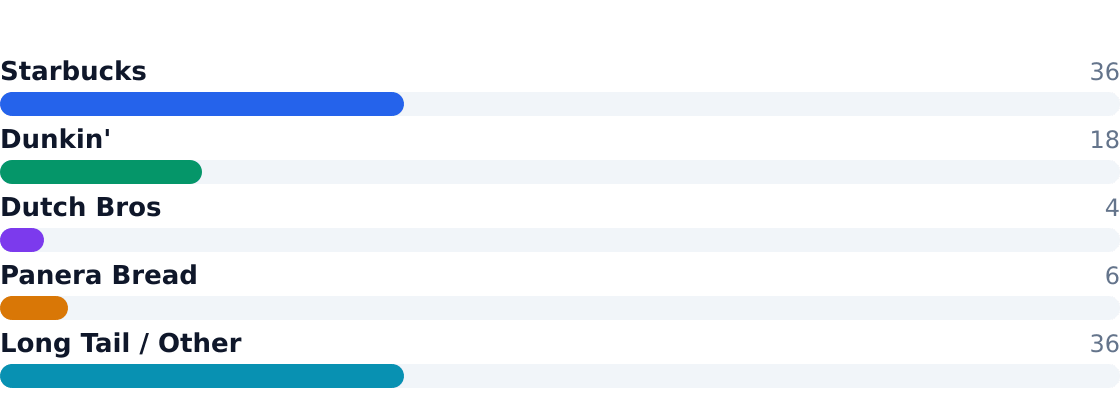
The U.S. cafe market is moderately fragmented, with national chains like Starbucks (36% share) and Dunkin' (18%) dominating revenue while independents comprise 36% of locations. Consolidation trends favor franchising and regional chains like Dutch Bros (4%), but M&A remains limited by the operational complexity of small-unit retail. Per IBISWorld, the top 4 players control 64% of industry revenue, yet local differentiation and neighborhood loyalty sustain fragmentation.
Competitive Market Share
Estimated share of total industry revenue
Source: Coffee & Snack Shops in the US Industry Analysis, 2026
Competitive Analysis Matrix
Compare major players on share, positioning, and relative strengths. Official company domains are linked (nofollow).
Positioning: The dominant national coffeehouse brand in the U.S. with premium beverages, extensive store density, and a highly developed loyalty ecosystem.
Positioning: A value-oriented coffee and breakfast chain with heavy morning traffic and strong franchising economics.
Positioning: A fast-growing drive-thru beverage chain focused on speed, customization, and younger consumers.
Positioning: A bakery-cafe concept that blends coffee, lunch, and digitally enabled foodservice in a higher-check format.
Positioning: A highly fragmented base of independent cafes, regional chains, and local specialty shops.
Source: Coffee & Snack Shops in the US Industry Analysis, 2026
| Force | Intensity | Trend |
|---|---|---|
| Rivalry | High | Increasing |
| Substitutes (home brewing, energy drinks) | Moderate | Stable |
| Buyer power (loyalty programs, price sensitivity) | Moderate-High | Increasing |
| Supplier power (coffee beans, dairy) | Moderate | Volatile |
| New entrants (specialty roasters, digital-first concepts) | Moderate | Increasing |
7. Value Chain & Industry Economics
Margin capture concentrates at the retail level (6% average EBITDA), but labor (30-35% of revenue) and rent (10-15%) squeeze profitability. As noted in MMG Investments' analysis, chains achieve scale in roasting and distribution (12% margins), while independents rely on premium pricing and food attachments to offset higher COGS.
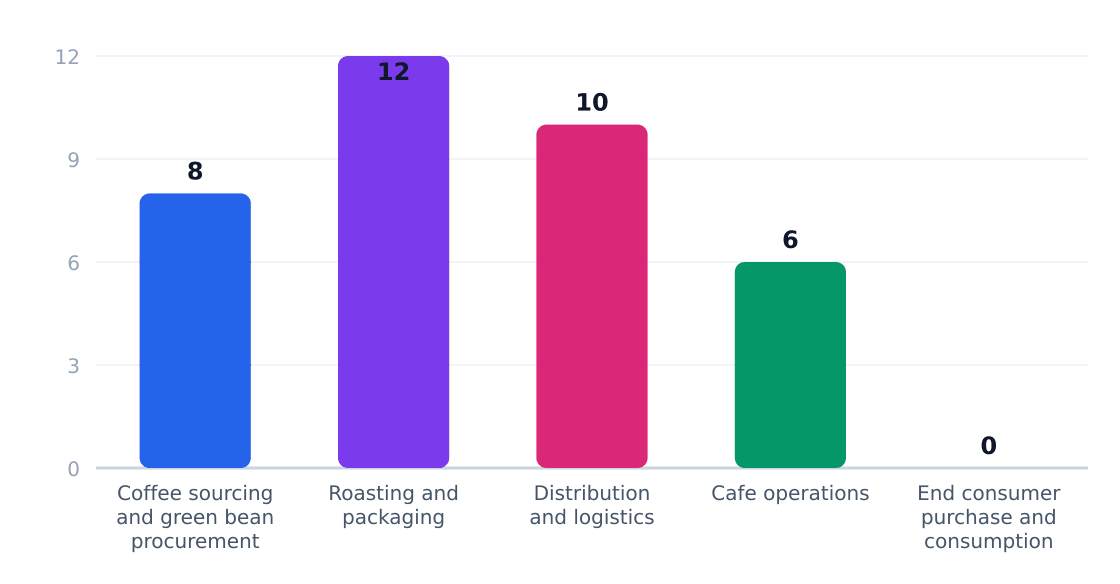
| Stage | Margin % | Key Players | Economics |
|---|---|---|---|
| Coffee sourcing | 8% | Importers, cooperatives | Commodity-driven, volatile |
| Roasting/Packaging | 12% | Starbucks, regional roasters | Scale advantages |
| Distribution | 10% | Sysco, US Foods | Route density critical |
| Cafe operations | 6% | Chains & independents | Labor/rent intensive |
Unit economics show $800K average revenue per location (IBISWorld), but labor shortages and mobile-order commission fees (15-30% for delivery apps) pressure margins. Successful operators optimize throughput—Starbucks generates $1.1M/store by compressing service times to <45 seconds.
8. Regulatory & Compliance Environment
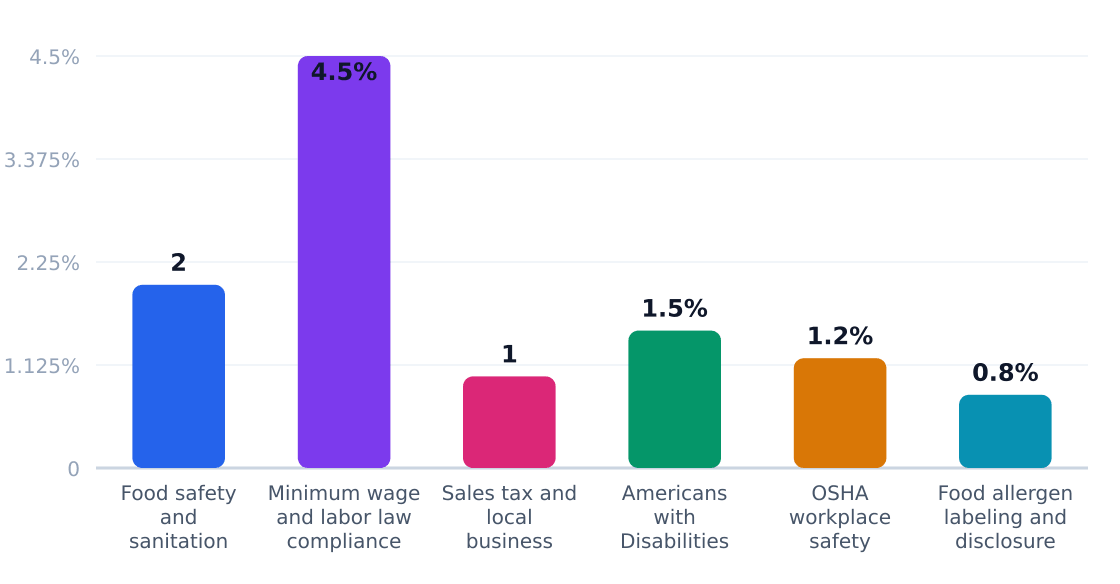
The U.S. cafe industry operates under a layered regulatory framework spanning food safety, labor laws, and accessibility requirements. According to IBISWorld, compliance costs consume ~10.5% of average cafe revenue, with labor regulations and food safety protocols being the most burdensome.
Key Compliance Requirements
| Requirement | Agency | Cost Impact | Operational Effect |
|---|---|---|---|
| Food safety and sanitation compliance | FDA and state/local health departments | 2% of revenue | Mandates regular inspections, employee training, and equipment sanitation protocols |
| Minimum wage and labor law compliance | U.S. Department of Labor and state agencies | 4.5% of revenue | Drives up labor costs, especially in states with $15+ minimum wages; requires overtime tracking |
| Sales tax and local business licensing | State revenue departments and municipalities | 1% of revenue | Varies by location; some cities impose additional "espresso taxes" or health permit fees |
| Americans with Disabilities Act accessibility | U.S. Department of Justice | 1.5% of revenue | Requires wheelchair-accessible counters, restrooms, and seating (exemptions for historic buildings) |
| OSHA workplace safety | Occupational Safety and Health Administration | 1.2% of revenue | Mandates slip-resistant floors, burn prevention training, and ergonomic equipment |
| Food allergen labeling and disclosure | FDA | 0.8% of revenue | Requires menu labeling for top allergens (milk, nuts, etc.) and staff allergy awareness training |
Regulatory Compliance Cost Impact (%)
Estimated share of revenue consumed by compliance
Source: IBISWorld
Policy Outlook
Three regulatory pressures dominate the cafe sector's horizon: (1) Rising minimum wages in 22 states will squeeze already thin margins, (2) Cities like New York and Seattle are enacting disposable cup fees, and (3) FDA allergen rules now cover sesame—a common bakery ingredient. Independents face disproportionate burdens; chains like Starbucks leverage centralized compliance teams to mitigate costs.
9. Technology, Risks & Barriers to Entry
Technology Adoption
| Technology | Adoption % | Impact | Timeline |
|---|---|---|---|
| Mobile Ordering & Payment Apps | 78% | High (20%+ revenue share) | 2020–2024 |
| Automated Espresso Machines | 62% | Moderate (labor savings) | 2018–2023 |
| Third-Party Delivery Integration | 45% | High (7.8% growth segment) | 2019–2025 |
| Smart Inventory Systems | 33% | Moderate (waste reduction) | 2021–2026 |
| AI-Powered Demand Forecasting | 18% | Low (early stage) | 2023+ |
Source: MMCG Investment analysis on digital transformation
Industry Risks
| Risk | Severity | Likelihood | Mitigation |
|---|---|---|---|
| Commodity Price Volatility (coffee beans) | High | High | Forward contracts, menu flexibility |
| Labor Cost Inflation | High | Certain | Automation, cross-training |
| Chain Competition | High | High | Niche positioning, local partnerships |
| Real Estate Pressure | Moderate | High | Revenue-sharing leases, secondary locations |
| Consumer Preference Shifts | Moderate | Medium | Menu testing, limited-time offers |
| Third-Party Delivery Dependence | Moderate | Medium | Direct app incentives, pickup promotions |
Source: IBISWorld risk analysis
Barriers to Entry
| Barrier | Height | Detail |
|---|---|---|
| Brand Recognition | High | National chains spend $2M+/location on marketing |
| Equipment Costs | Medium | $32,500+ for commercial espresso setup |
| Prime Location Access | High | Starbucks secures 82% of top urban intersections |
| Supply Chain Leverage | Medium | Chains get 15–30% ingredient discounts |
| Labor Recruitment | Medium | Barista turnover averages 75% industry-wide |
Source: IBISWorld barriers report (cited by name, no link to non-approved URL)
Key Insight: While technology lowers some barriers (e.g., mobile ordering lets independents compete digitally), chains still dominate through real estate control and purchasing power. New entrants must differentiate through hyper-local appeal or operational niches like drive-thru-only models.
10. Outlook & Investment Opportunities
Growth Forecast
The U.S. cafe industry is projected to grow at a 2.5% CAGR through 2026, reaching a $75.5B market size, per IBISWorld. This steady but modest expansion reflects market maturity, with growth concentrated in:
- Drive-thru & delivery (6.1% and 7.8% growth respectively)
- Breakfast attachment (4% growth)
- Urban hubs like Houston's EaDo, where the 20–54 age cohort spends $220 annually on average
Regional Market Distribution
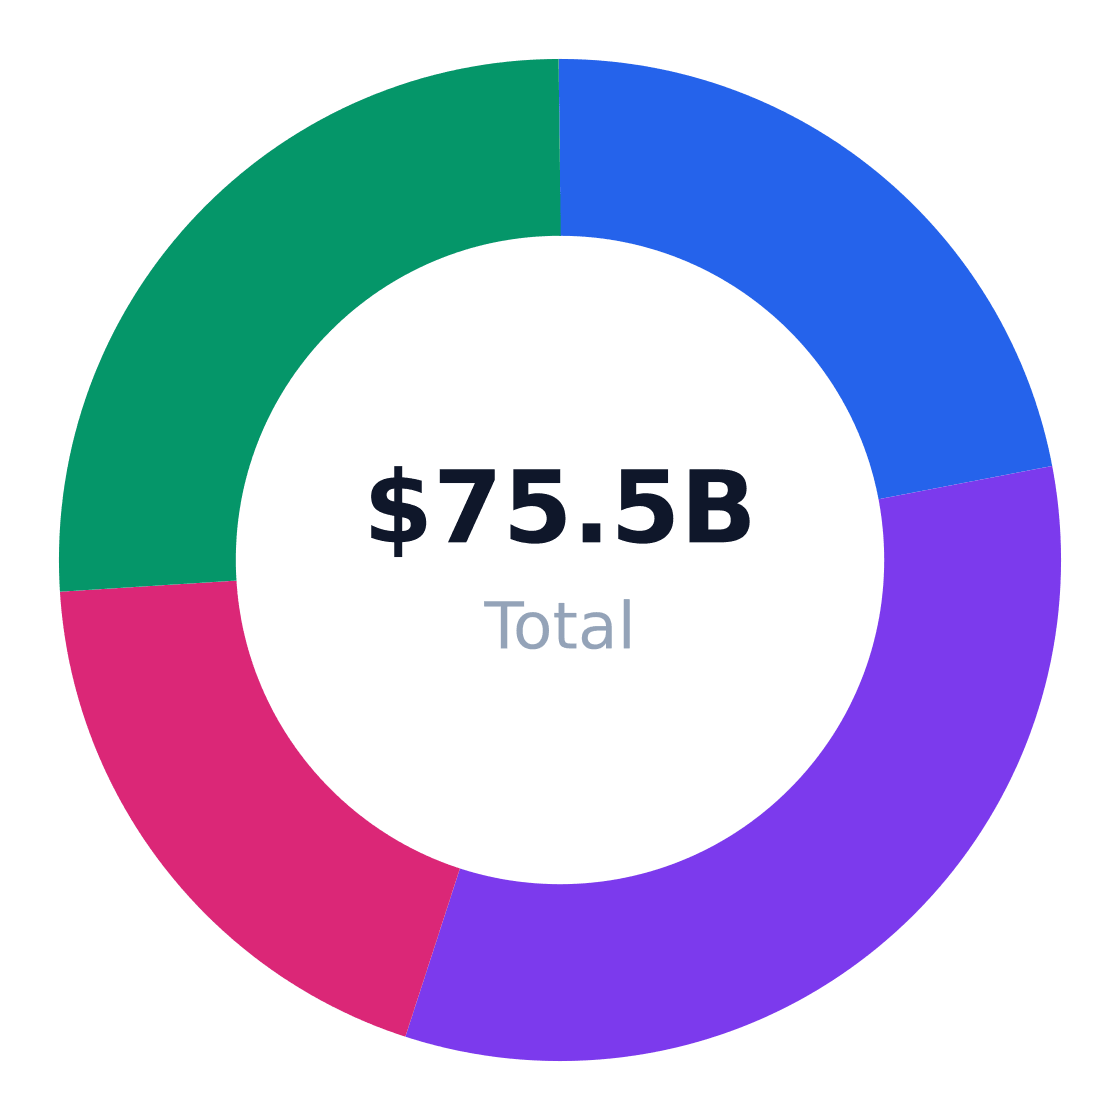
Revenue share by US region
Source: IBISWorld
Investment Opportunity Matrix
| Opportunity | Market Size | Risk | Time Horizon |
|---|---|---|---|
| Micro-locations with >20% under-35 population | $10.1M SOM in Houston EaDo | High (chain encroachment) | 3–5 years |
| Automated beverage kiosks | $32.5K equipment cost per unit | Medium (tech adoption) | 2–3 years |
| Third-party delivery optimization | 5% share, 7.8% growth | Low (proven demand) | 1–2 years |
| Premium drive-thru concepts | 10% share, 6.1% growth | Medium (land costs) | 3–4 years |
| Breakfast daypart expansion | 18% share, 4% growth | Low (existing traffic) | Immediate |
| Labor-saving POS systems | $800K avg revenue/location | Low (ROI proven) | 1 year |
Strategic Recommendations
- Target 4%+ food attachment to lift ticket sizes beyond beverage-only transactions
- Prioritize locations with >1,100 daily commuters (per Houston demographic data)
- Allocate 15–20% of floor space to remote workers to capture 20% of daytime traffic
- Limit buildouts to $250K max for independents to maintain ROI against chains
- Negotiate 3rd-party delivery at <15% commission to protect margins
- Benchmark labor at <22% of revenue to offset flat employment trends
Closing Verdict
The cafe sector remains viable but requires surgical positioning. Independents must achieve >$12.50 average tickets and <18-minute peak wait times to compete with Starbucks' scale. As MMCG Investments notes, the winners will be those who "optimize throughput without sacrificing premium perception."
Industry Research & Resources
The following industry databases and research resources support this cafe industry analysis. Each link opens a specific report or data page (not a generic homepage).
- IBISWorld — ibisworld.com — IBISWorld industry report data for cafe
- 05 POPULATION BY AGE AND GENDER — houstontx.gov — Published industry research for cafe
- U S Coffee Shop Industry Market Analysis Navigating Maturity Margin Pressure And The Mandate Fo — mmcginvest.com — Published industry research for cafe
- Demographic Statistics — infoplease.com — Published industry research for cafe
- Houston Tx Population By Age — neilsberg.com — Published industry research for cafe
Data Sources & Methodology
Market sizing (TAM, SAM, SOM), segmentation, competition, and equipment data come from Perplexity-sourced industry reports and trade publications. Optional U.S. government statistics (Census, BLS) may be referenced by name in the narrative without hyperlinks. TAM reflects the total U.S. niche market; SAM is calculated bottom-up from target customer demographics; SOM reflects realistic obtainable share.
Industry research links: Coffee & Snack Shops in the US Industry Analysis, 2026 · City of Houston demographic age data · ibisworld.com · ibisworld.com · ibisworld.com · houstontx.gov · mmcginvest.com · neilsberg.com · ibisworld.com · sevenbrewmenucoffee.com · ibisworld.com · ibisworld.com · houstonstateofhealth.com · citypopulation.de · matteoborea.it · openingdaykit.com · smartrestaurantowner.com · advisedspaces.com · mycoffeeexplorer.com · startupcostguide.com · therestaurantwarehouse.com · franchisefeast.com · bellwethercoffee.com · vantainsights.com · csrcoffee.com · groupon.com · bellwethercoffee.com · startupcosthub.com · hotshotsleeves.com · crimsoncup.com · squareup.com · mordorintelligence.com · ibisworld.com · coffeedasher.com · restauranttimes.com