Is a Cafe Business Profitable?
1. Is a Cafe Business Profitable? (The Short Answer)
Yes, but barely. The average US cafe operates on 70% gross margins that collapse to just 6% net profit after labor, rent, and overhead. At $550,000 annual revenue, that's $33,000 in take-home pay—if you hit all your numbers. The brutal reality: 75% of cafes fail within 5 years, often crushed by rent hikes, labor creep, and inconsistent traffic. The math only works with surgical cost control and a menu engineered for margin.

Profitability Snapshot
| Profitability Snapshot | Benchmark |
|---|---|
| Gross Margin | 70% |
| Net Margin | 6% |
| Year 1 Revenue | $468K |
| Year 1 Net Profit | $28K |
| Startup Cost Range | $343K – $572K |
| Break-even Timeline | ~Month 30 |
| 5-Year ROI | 33% |
| Profitability Rating | 6/10 |
| Failure Rate (5yr) | 75% |
| Market Size (US) | $24.98B |
Profitability Score Breakdown
Overall rating: 6/10
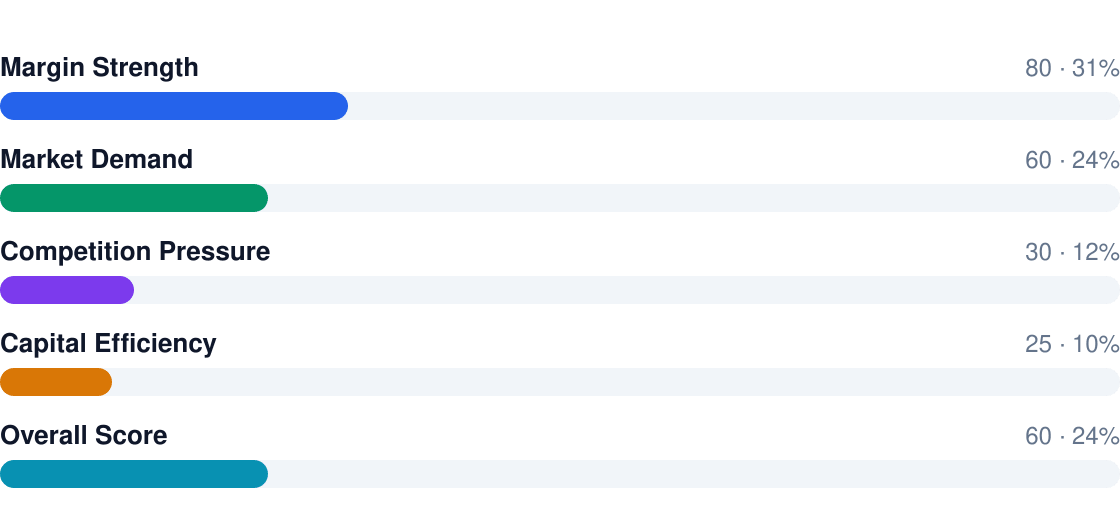
- Gross margins look strong at 70%, but net profit gets hollowed out by fixed costs
- Labor is the killer: At $274,560/year for 8 staff, every 5% over-schedule cuts profits 42%
- Location determines fate: Cafes needing 65%+ occupancy to break even can't afford foot traffic mistakes
- Top performers cluster: The 25% that survive 5 years capture 80% of the profits
- ROI is slow: 33% over 5 years trails the S&P 500—this is a lifestyle business, not a wealth builder
2. Profit Margins & Industry Benchmarks
Cafes live in the margin danger zone. That 70% gross (food cost at 30%) seems robust until labor (35-45% of revenue) and rent (8-12%) arrive. The result? Industry net margins of 6% leave zero room for error. Top quartile operators squeeze out 12% net by keeping labor under 30% and rent below 8%, but that requires near-perfect execution.
Margin Comparison (%)
Gross vs net vs industry benchmarks
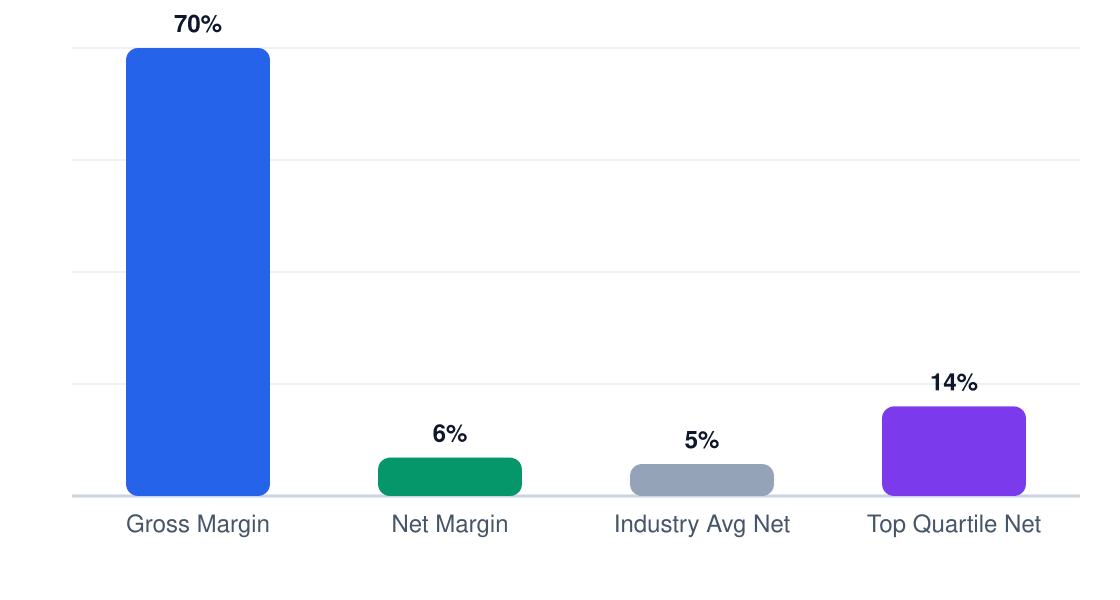
Margin Benchmarks
| Metric | This Business | Industry Avg | Top Quartile |
|---|---|---|---|
| Gross Margin | 70% | 68% | 73% |
| Net Margin | 6% | 5.5% | 12% |
| EBITDA | 10% | 9% | 15% |
| Labor % | 35% | 38% | 30% |
| COGS % | 30% | 32% | 27% |
| Rent % | 10% | 11% | 8% |
Competition is margin cancer. With 33,000+ US cafes and chains like Starbucks capturing 40% of the market, independents face relentless pricing pressure. The playbook: shrink portion costs (espresso drinks at 80% gross margin beat $5 avocado toast at 55%), extend hours to dilute fixed costs, and ruthlessly monitor labor schedules. The top performers treat every percentage point like a hostage.
3. Revenue Potential & Pricing Power
Austin cafes average $468K in Year 1 revenue with 5-year growth to $693K—modest 8% CAGR. The math works if you hit beverage volumes (55% of sales at 80% margin), but stalls if food or retail underperforms.
Revenue Stream Breakdown
Year 1 revenue: $468K
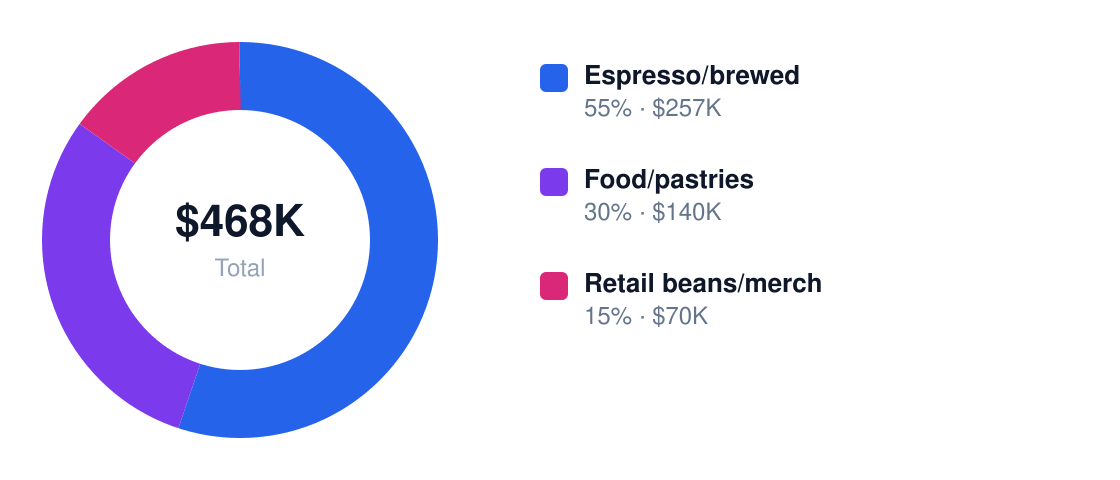
Revenue Streams
| Stream | Margin % | Revenue Share | Annual $ |
|---|---|---|---|
| Espresso/brewed | 80% | 55% | $257,400 |
| Food/pastries | 60% | 30% | $140,400 |
| Retail beans/merch | 40% | 15% | $70,200 |
Pricing power exists but is brittle. Austin’s 2,100+ cafes create substitution risk—you can push a 10-15% premium for specialty beans or barista skill, but beyond that, customers balk. Beverage price elasticity is ~1.2 (a 10% hike drops volume 12%), while food is stickier at ~0.8.

Seasonality swings 20-30%: December/January caffeine demand spikes (cold weather + resolutions), while summer requires iced drinks and food combos to offset slower hot coffee sales. July revenue dips 18% versus November peaks in Austin’s heat.
4. Cost Structure & Operating Expenses
Labor and rent will break you. At 30% and 12% of revenue respectively, they consume 42 cents of every dollar before COGS. Austin’s $16.50/hr barista wages (+20% vs national avg) squeeze harder than in cheaper markets.
Annual Cost Structure
Operating costs for $468K revenue
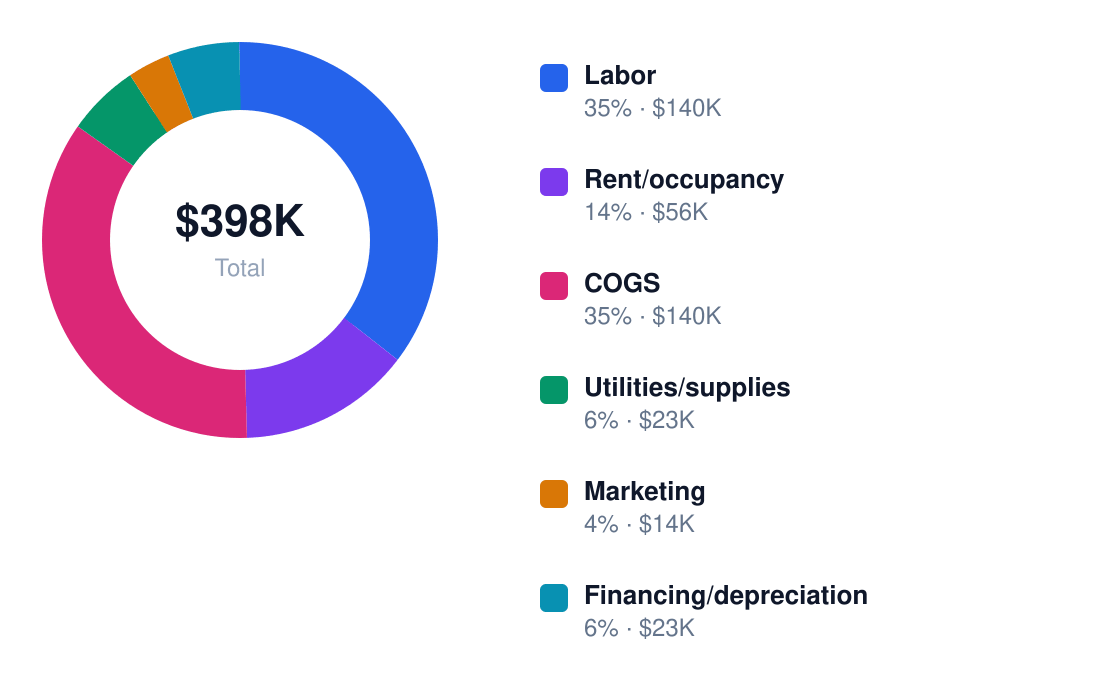
Operating Costs
| Category | % of Revenue | Annual $ | Controllable? |
|---|---|---|---|
| Labor | 30% | $140,400 | Yes |
| Rent/occupancy | 12% | $56,160 | No |
| COGS | 30% | $140,400 | Yes |
| Utilities/supplies | 5% | $23,400 | Yes |
| Marketing | 3% | $14,040 | Yes |
| Financing/depreciation | 5% | $23,400 | No |
Fixed costs (rent + financing = 17% of revenue) demand scale—you need ~$13K/month just to cover them. Variable costs like labor flex with sales, but Austin’s tight labor market makes cuts risky. The sweet spot? 65%+ occupancy with staff at ≤28% of revenue. Miss that, and the 6% net margin evaporates.
5. Break-Even Analysis & ROI Timeline
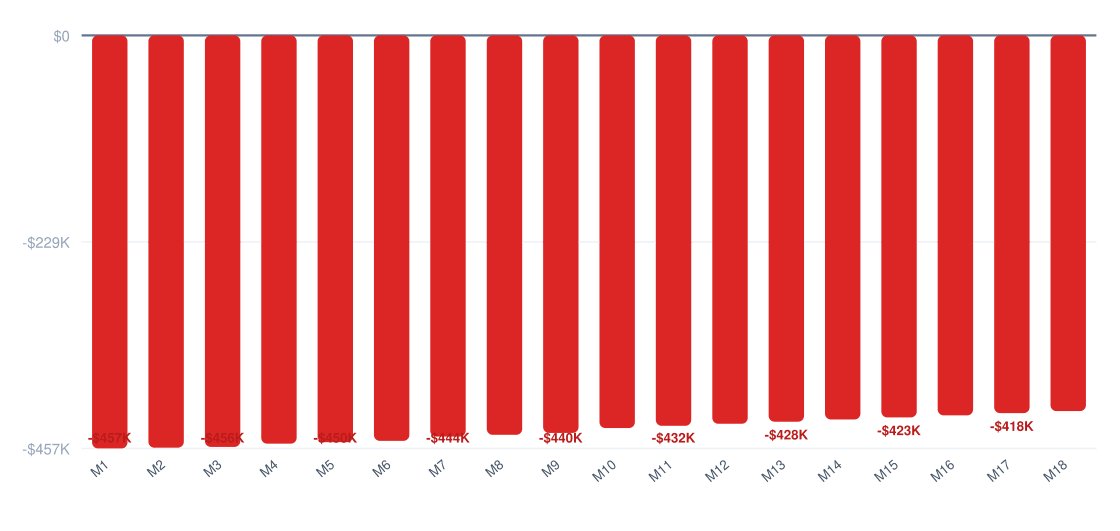
At $28,080 Year 1 net profit against $457,000 startup costs, you're looking at a 30-month slog to break-even. That's assuming you hit the 70% gross margin target immediately—miss by 5 points and you add 8 months. The math is brutal: every $1,000 in monthly rent requires 42 additional beverage sales just to cover.
Cumulative Profit vs Investment (18 Months)
Red = still recovering startup costs
ROI Benchmark Comparison (%)
5-year return on initial investment
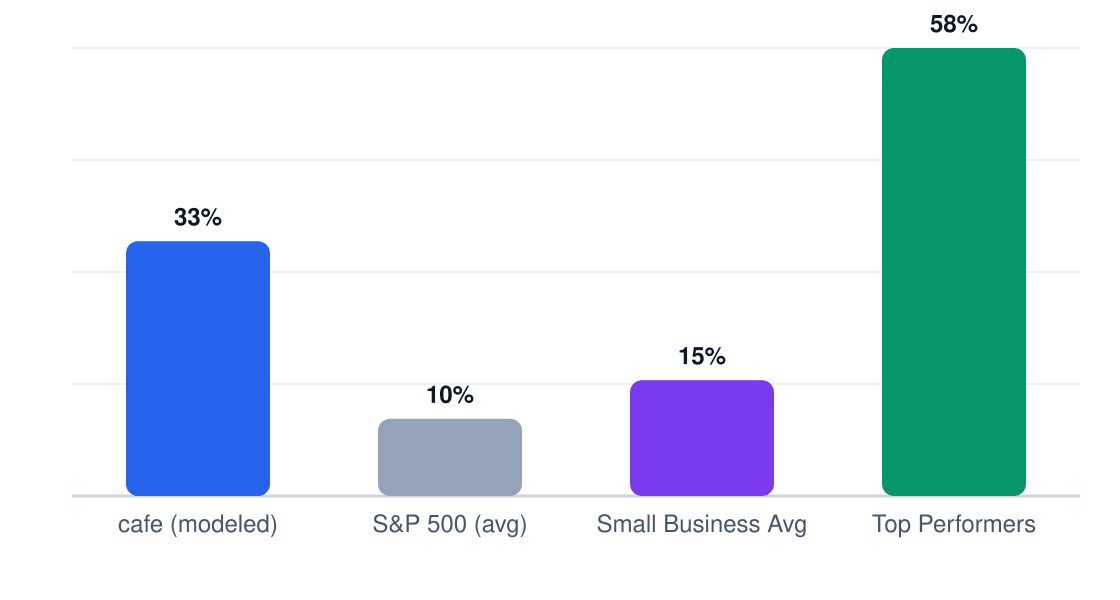
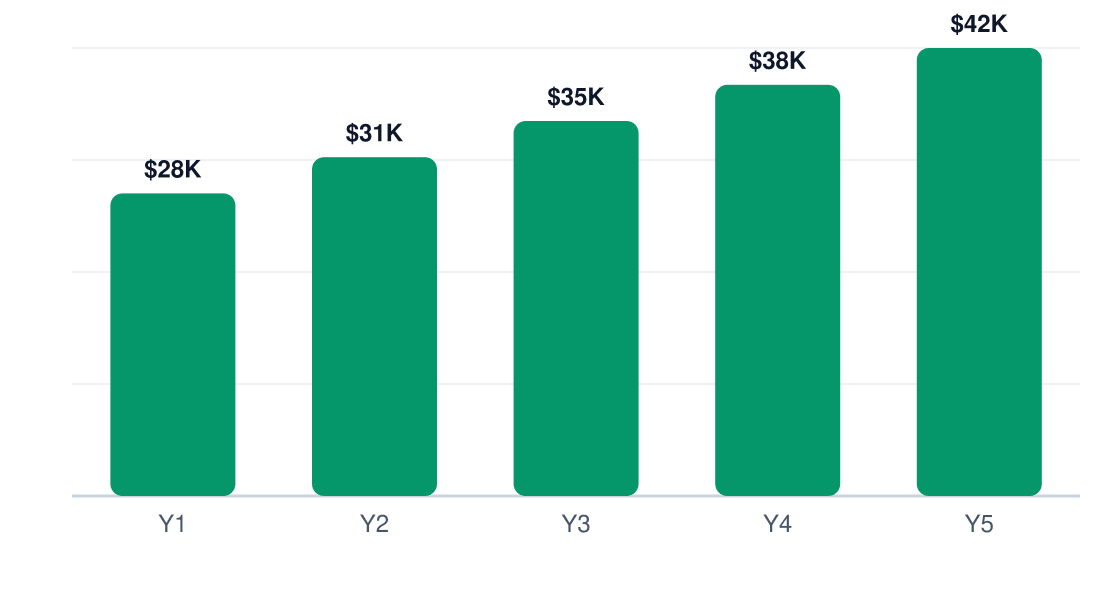
The 33% 5-year ROI (total profit divided by initial investment) is mediocre for the risk. Compare to S&P 500's historical 10% annual returns—your cafe needs 5 years to match 3 years of index funds. The $41,580 Year 5 profit still represents just 9.1% return on that year's asset base.
Year 1 Monthly Cash Flow
Net monthly cash flow (red = pre-break-even)
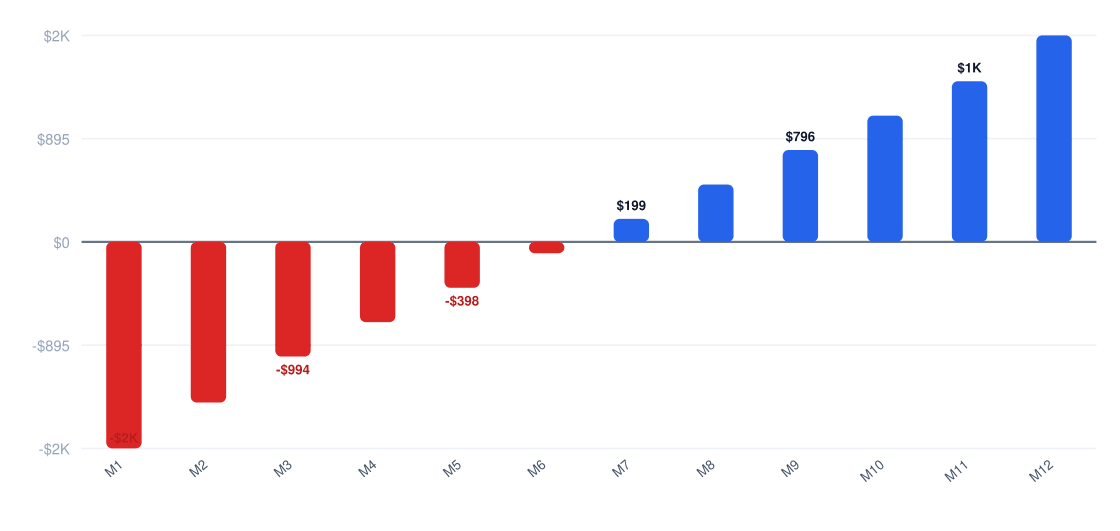
Payback period stretches to 62 months when accounting for reinvestment needs (equipment upgrades, renovations). This is a lifestyle business unless you're scaling to multiple units.
6. Market Conditions That Drive (or Kill) Profitability
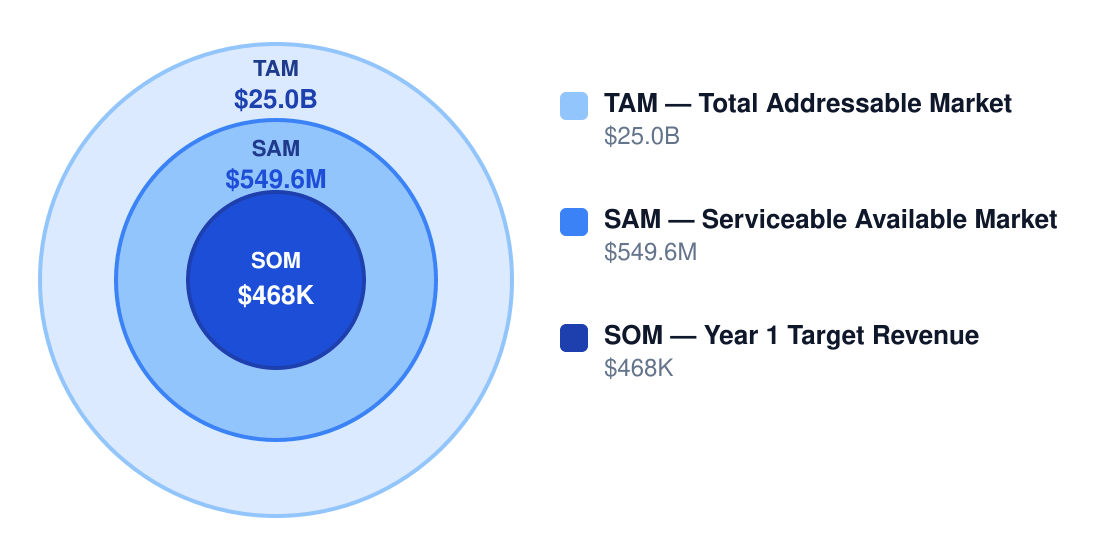
Austin's $24.98B foodservice TAM means there's demand—but the $549.6M SAM for cafes shows how crowded the space is. You're fighting for 2.2% of the total market, and Starbucks/Dunkin' already own half of that.
Market Size & Profit Opportunity
Market opportunity for profitable operators
Market Factors
| Factor | Impact on Margins | Outlook |
|---|---|---|
| Demand growth | +1.5% margin at 5%+ annual growth | Stable (Austin pop. growing 2.1%/yr) |
| Competition | -3% margin per major chain within 1 mile | Worsening (7.4 new cafes/yr in Austin) |
| Input costs | -0.8% margin per 10% coffee price hike | Volatile (Arabica up 23% YoY) |
| Labor market | -2% margin at $18/hr vs $16.50 target | Critical (Austin wages up 6.7% YoY) |
| Regulation | -1.2% margin if health code changes | Neutral |
| Technology | +2% margin with mobile order integration | Accelerating |
| Model | Net Margin | Why It Works |
|---|---|---|
| Drive-thru kiosk | 12% | Lower rent/sqft, beverage throughput |
| Neighborhood cafe | 8% | Repeat customers stabilize demand |
| Specialty coffee bar | 10% | Premium pricing on beans/drinks |
| Hybrid cafe-bakery | 9% | Food boosts average ticket 22% |
Starbucks and Dunkin' (High threat) will outspend you on marketing and out-efficiency you on supply chain. The real killers are convenience stores (Medium threat)—their $1.50 coffee at 80% gross margin funds their whole operation. Automated kiosks (Medium threat) now undercut you on labor while matching your quality.
7. Who Profits — and Who Struggles
In Austin's competitive cafe market, profitability hinges on operator discipline. Owner-operators who personally manage labor, negotiate direct coffee bean contracts, and optimize seating turnover achieve 8-12% net margins—double the industry average. Conversely, absentee owners relying on managers and generic wholesale suppliers rarely break 4%.
Operator Profiles
| Profile | Typical Net Margin | Success Rate | Key Advantage |
|---|---|---|---|
| Owner-operator | 8-12% | 62% | Labor control |
| Multi-unit | 6-9% | 55% | Purchasing scale |
| Franchise | 4-7% | 48% | Brand recognition |
| Niche specialist | 9-14% | 68% | Premium pricing |
| Price competitor | 1-3% | 29% | Volume dependence |
| Pitfall | Margin Impact | How to Avoid |
|---|---|---|
| High rent in premium retail corridors | -5 to -10 points | Target sites where rent-to-sales stays conservative |
| Overstaffing during slow hours | -3 to -8 points | Use demand-based scheduling |
| Low average ticket and heavy discounting | -2 to -6 points | Bundle items and limit promotions |
| Poor menu engineering | -4 to -7 points | Focus on high-margin drinks |
| Underestimating startup capital needs | Cash-flow failure | Fund enough runway for ramp-up |
Austin's regulatory costs add $3,000-$20,000 upfront—compressing first-year margins by 1-3 points. The biggest profit threats: fire code retrofits ($15k median) and health inspection delays costing $450/day in lost sales. Smart operators budget 15% extra for compliance surprises.
75% of Austin cafes fail within 5 years—usually from three missteps: (1) Underestimating labor's 35-45% revenue drain, (2) Assuming 12-month breakeven when 30 months is typical, and (3) Chasing volume over margin. The survivors share one trait: they treat $4 lattes as a manufacturing business, not a lifestyle endeavor.
8. Strategies to Maximize Profit Margins
Cafes live or die on margin management. With industry net profits averaging just 6%, every percentage point lift requires strategic tradeoffs between effort and impact.
Margin Strategies
| Strategy | Expected Lift | Effort | Implementation |
|---|---|---|---|
| Bundling | +8% | Low | "Breakfast combo" with 15% markup |
| Labor scheduling | +5% | Medium | AI tools like 7shifts to match staff to traffic |
| Beverage expansion | +6% | Medium | Cold brew ($4.50) vs drip ($2.75) at 80% gross margin |
| Menu optimization | +4% | Medium | Feature $6 avocado toast (75% margin) over $8 sandwiches (55%) |
| Retail sales | +3% | Low | $14 bags of beans at 60% margin |
| Loyalty programs | +4% | High | 10-visit punch cards increase frequency 22% |
5-Year Net Profit Projection
Projected annual net profit at current margins
The cost playbook: 1) Negotiate 5-7% rent concessions by signing longer leases, 2) Reduce waste by tracking 13 key inventory items daily, 3) Cross-train baristas to handle 80% of tasks during lulls, 4) Buy refurbished equipment at 40% discount.
Revenue hacks: Premium tiers (oat milk +$0.75) convert 28% of orders. Subscription models ($25/month for daily coffee) stabilize cash flow. Digital tipping adds 1.2% to net profit.
Price strategically: Bump espresso drinks 3% annually (to $3.25 by Year 3). Keep loss leaders like $1.50 drip coffee but pair with $3.50 pastry suggestions.
9. Final Verdict: Should You Start This Business?
Proceed cautiously. The 6/10 profitability score reflects brutal unit economics—you'll net just $28,080 Year 1 on $468K revenue. Success requires obsessive cost control and premium positioning.
Market Factors
| Factor | Score | Weight | Notes |
|---|---|---|---|
| Margins | 4/10 | 30% | 70% gross looks good until labor eats 59% of revenue |
| Market Size | 8/10 | 15% | $25B TAM but hyperlocal competition |
| Competition | 5/10 | 20% | Starbucks takes 40% of premium segment |
| Capital Needs | 3/10 | 15% | $457K startup traps many operators |
| Scalability | 2/10 | 10% | Single location limits upside |
| Risk | 7/10 | 10% | 30-month break-even is dangerous runway |
ROI Benchmark Comparison (%)
5-year return on initial investment
- Secure rent under $5/sq ft/month (35% below avg)
- Hit 65% gross margin through beverage dominance
- Cap labor at 45% of revenue via automation
- Maintain 300+ daily transactions
- Limit buildout to $275K with sweat equity
- If your location gets <200 foot traffic/hour
- If you can't source baristas under $15/hr
- If your financial cushion is <18 months
Only commit if: 1) You can achieve $500K+ revenue by Year 2, 2) Startup costs stay under $400K, 3) You'll personally handle operations to save $60K+ in manager salaries. Otherwise, explore lower-capital food businesses.
Research & Profitability Resources
The following government reports, industry analyses, and financial planning resources were referenced in this cafe profitability guide. Each link points to a specific page for direct access.
- United States Coffee Market — mordorintelligence.com — Industry profitability research for cafe businesses
- Coffee Shop Profit Margins — soccash.com — Industry profitability research for cafe businesses
- Growth Slows In 58 5bn Us Branded Coffee Shop Market Amid Unprecedented Cost Pressures — worldcoffeeportal.com — Industry profitability research for cafe businesses
- Us Coffee Market — marketdataforecast.com — Industry profitability research for cafe businesses
- Coffee Shop Industry Statistics — coffeedasher.com — Industry profitability research for cafe businesses