What Really Predicts CPG Launch Success?

I built a composite CPG Market Readiness Score using Census data for 47 U.S. metros with populations over 500,000. The results? Median income and college-educated share dominate. Population size? Barely half as predictive. Youth index? Even weaker.
The scorecard combines five weighted factors: population (28%), median income (24%), college-educated share (20%), youth index (14%), and median home value (14%). Each metro gets a score from 0 to 100. The mean score is 36.0, with a standard deviation of 12.9.
Subscribe to my newsletter if you want more wonky deep dives into the data behind consumer markets. (Or don’t. I’m not your boss.)

Why Median Income Dominates
Median income correlates most strongly with the composite score at 0.89. College-educated share comes in second at 0.776. Population size? Just 0.569.
This isn’t surprising. CPG brands targeting premium products need consumers with disposable income. San Jose-Sunnyvale-Santa Clara tops the list with a median income of $151,713 and a score of 68.8. Cleveland-Elyria, with a median income of $66,481, scores just 19.7.
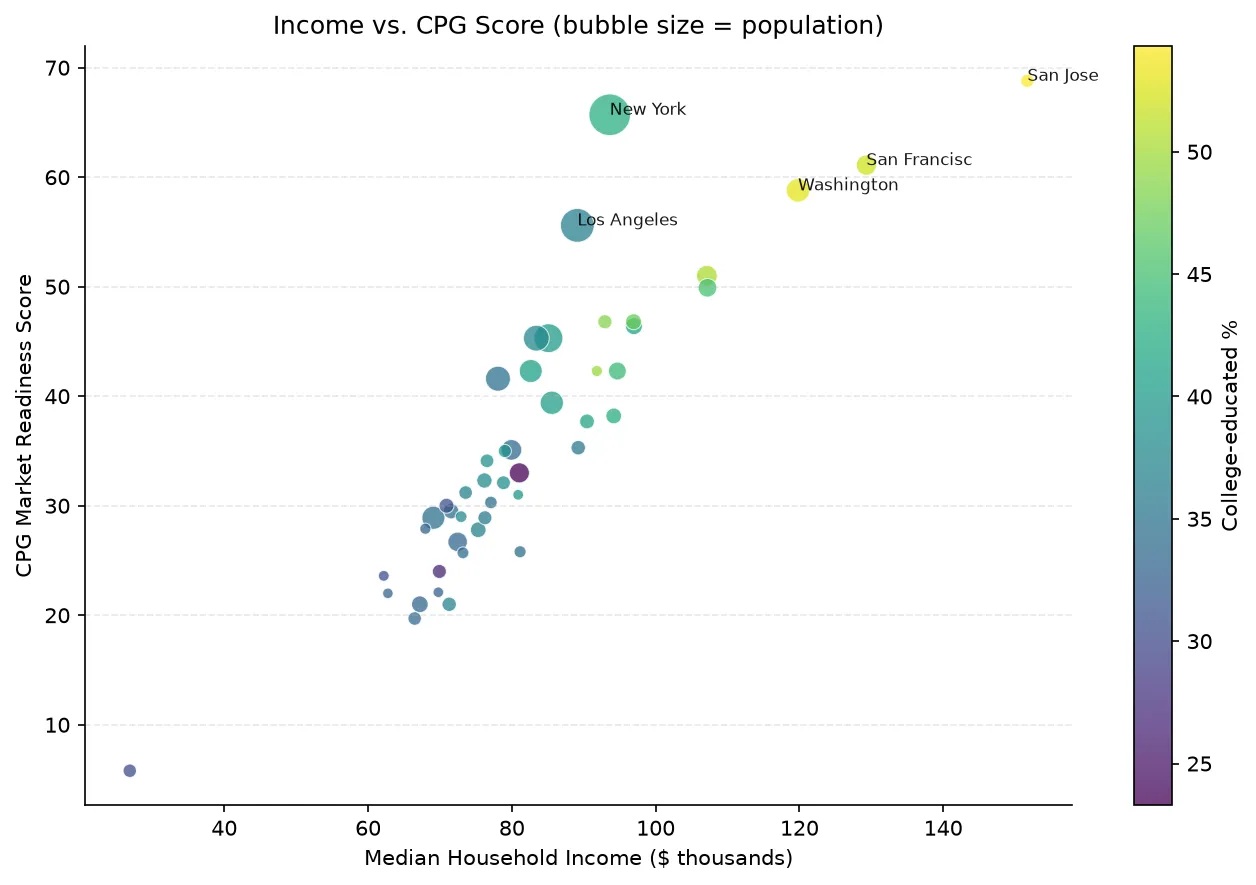
Figure: Income Vs Score
As the chart shows, metros with median incomes above $100,000 cluster at the top. Those below $70,000 languish at the bottom.
What CPG Brands Get Wrong About "Hot" Markets
CPG brands often chase metros with large populations or trendy reputations. That’s a mistake.
New York-Newark-Jersey City, with nearly 20 million people, scores 65.7. But its income ($93,610) and college-educated share (42.7%) drive that score, not sheer size.
Las Vegas-Henderson-Paradise, despite its "hot" reputation, scores just 24.0. Its median income ($69,911) and college-educated share (26.4%) drag it down.
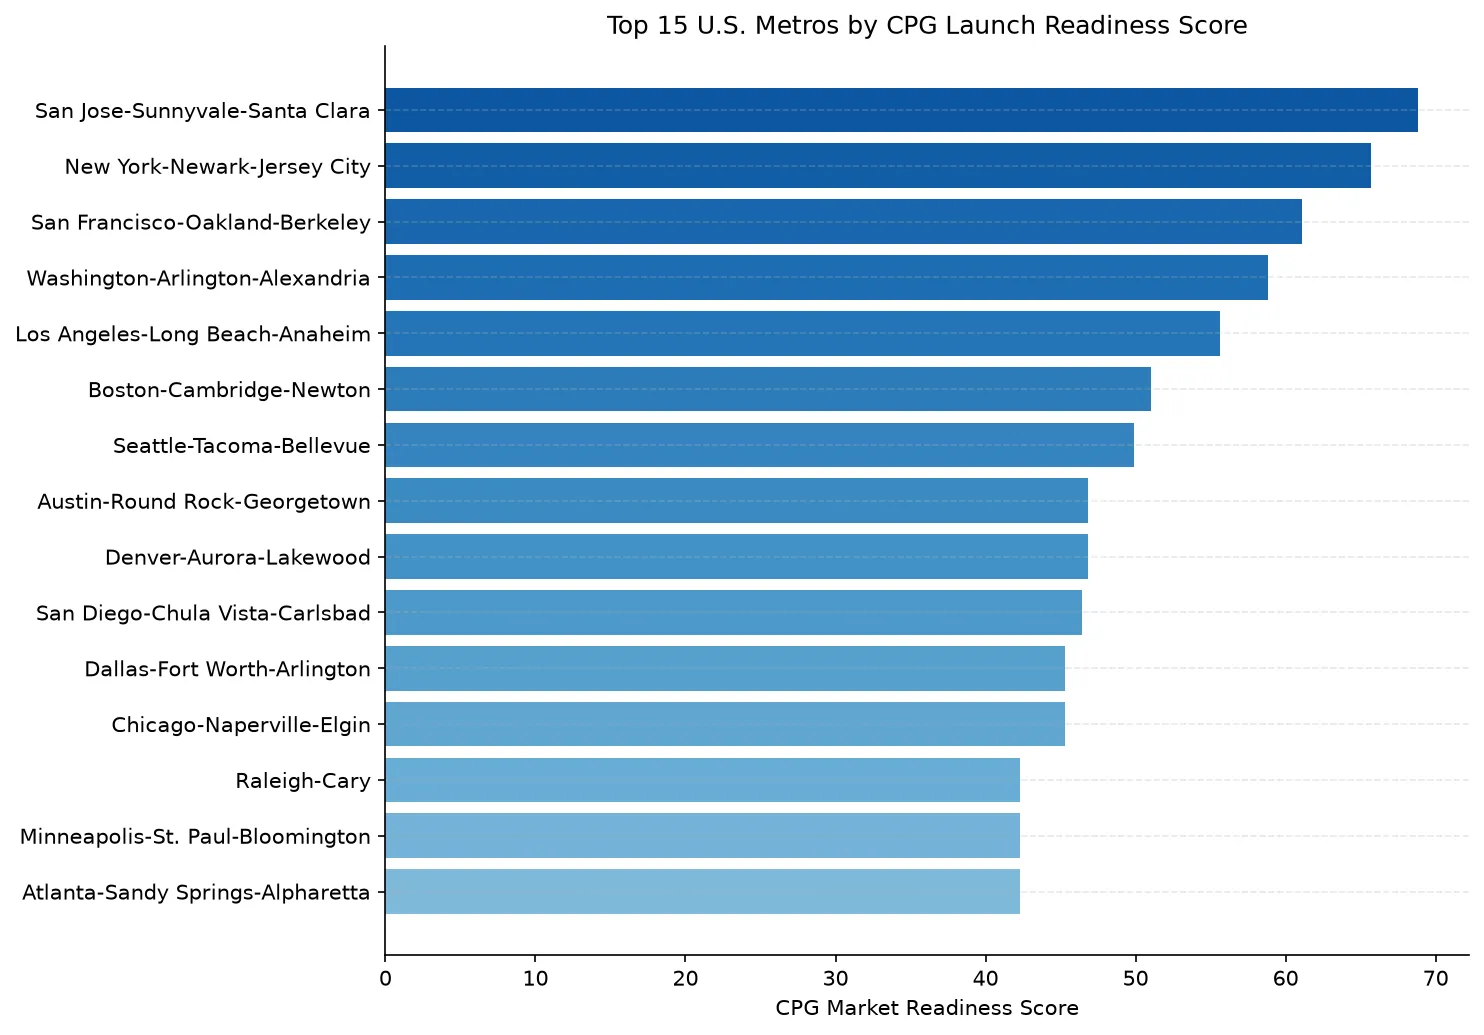
Figure: Top Metros
The lesson? Don’t confuse buzz with buying power.
Policy and Inequality Implications
The scorecard highlights stark inequalities. San Juan-Bayamón-Caguas, with a median income of $26,853, scores just 5.8.
This isn’t just about CPG launches. It’s about access to premium products and services. As Steps To CPG Growth notes, brands often overlook underserved markets.

Methodology Caveats
The scorecard uses Census ACS 2022 data, which is public and reliable. But it’s a market-readiness index, not a predictor of actual CPG launch outcomes.
Factors like marketing spend, distribution networks, and local competition aren’t included. Still, as Cpg Innovation Speed Integration argues, demographic data provides a strong foundation for targeting.
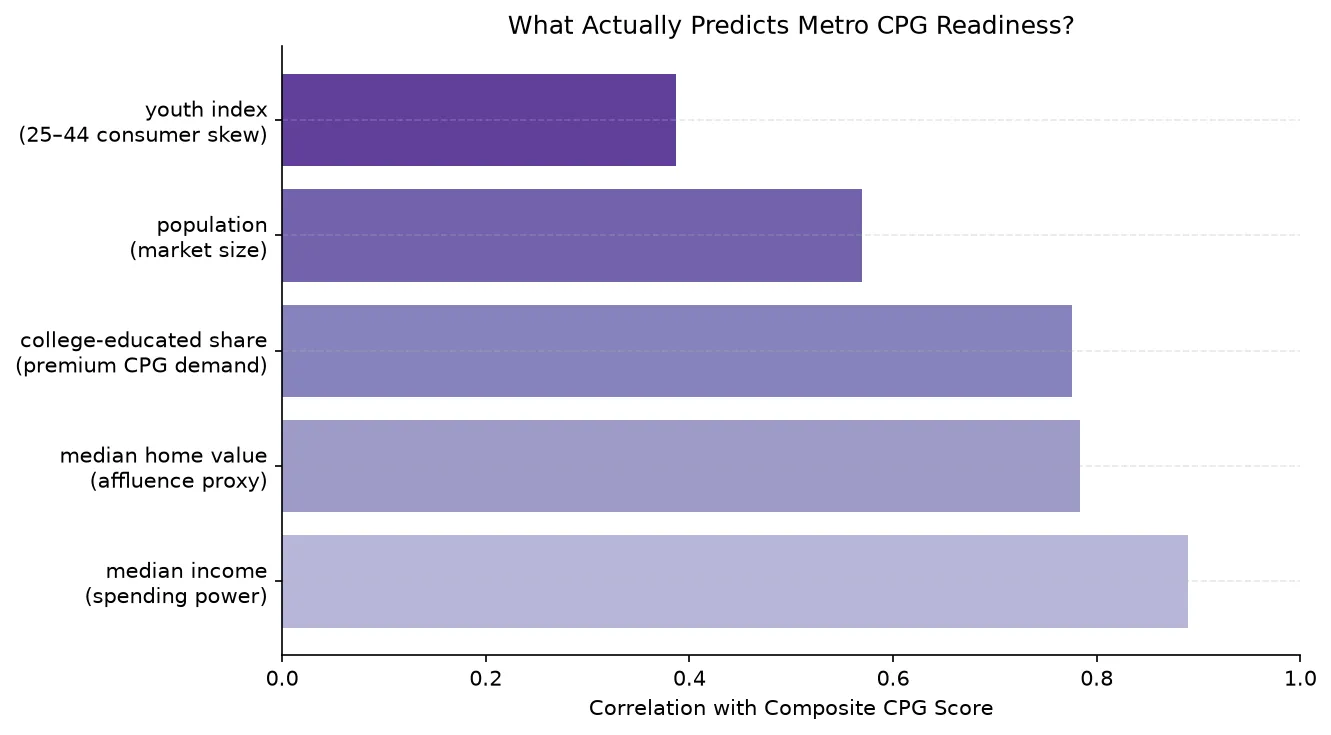
Figure: Factor Importance
The Bottom-Tier Metros
The bottom 10 metros cluster in the Midwest and South. Pittsburgh scores 21.0, with a median income of $71,283 and a college-educated share of 37.1%.
Memphis, despite its youth index of 80.0, scores just 23.6. Its median income ($62,178) and college-educated share (30.4%) hold it back.
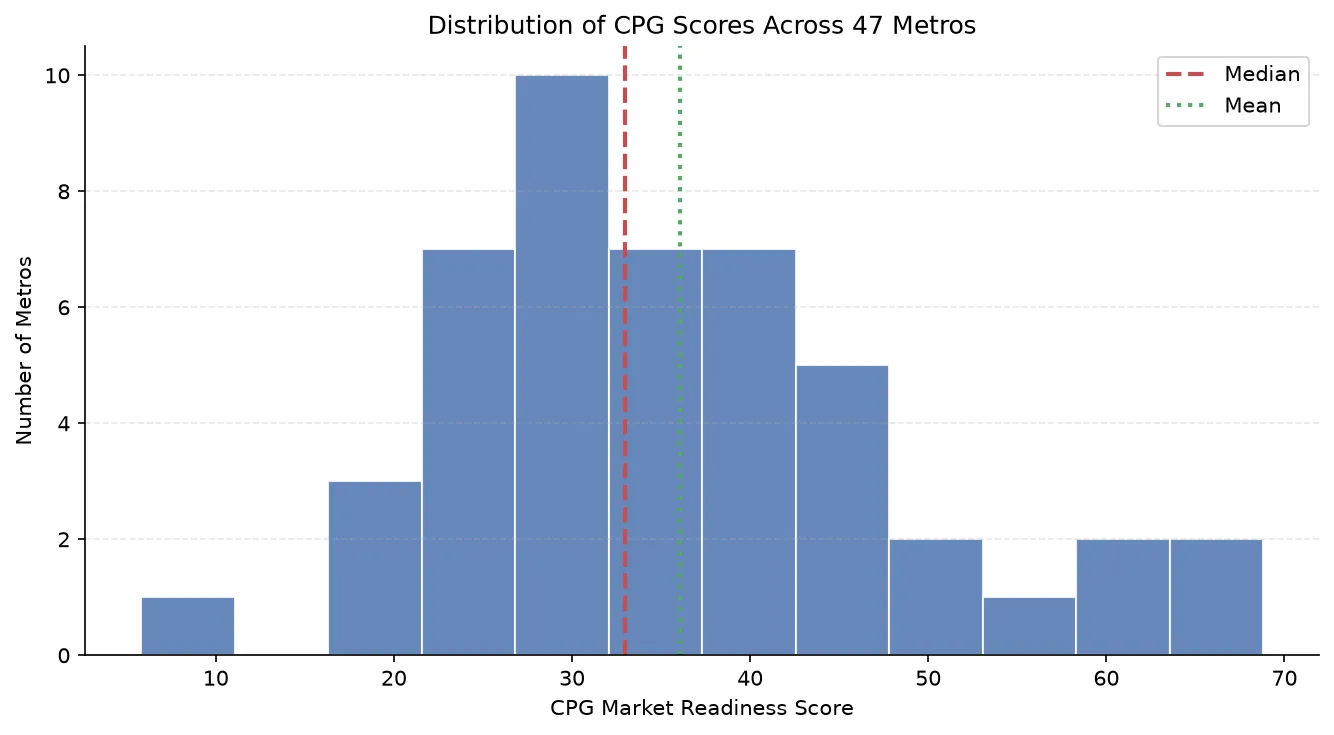
Figure: Score Distribution
As The Operations Leaders Driving Fast Growing Cpg Brands In 2026 notes, success in these markets requires tailored strategies.
The Role of College-Educated Share
College-educated share correlates strongly with the composite score at 0.776. This reflects the premium CPG market’s reliance on consumers with higher education and discretionary spending power.
Washington-Arlington-Alexandria, with a college-educated share of 53.0%, scores 58.8. Tampa-St. Petersburg-Clearwater, with a college-educated share of 33.2%, scores just 21.0.
The gap is stark. Metros with college-educated shares above 40% dominate the top tier. Those below 35% struggle to crack the top 20.
Youth Index: A Mixed Bag
The youth index (share of population aged 25–44) correlates weakly with the composite score at 0.387.
Austin-Round Rock-Georgetown, with a youth index of 94.1, scores 46.8. Boston-Cambridge-Newton, with a youth index of 51.8, scores 51.0.
The takeaway? Youth matters, but it’s not decisive.
Median Home Value as a Proxy
Median home value correlates strongly with the composite score at 0.784. It’s a useful proxy for affluence, though imperfect.
San Francisco-Oakland-Berkeley, with a median home value of $1,073,300, scores 61.1. Jacksonville, with a median home value of $281,000, scores just 25.7.
The divergence is clear. Metros with median home values above $500,000 dominate the top tier.
Top-Tier Metros: A Closer Look
San Jose-Sunnyvale-Santa Clara leads with a score of 68.8, driven by its median income ($151,713) and college-educated share (54.3%).
New York-Newark-Jersey City, with a population of nearly 20 million, scores 65.7. Its median income ($93,610) and college-educated share (42.7%) are key drivers.
San Francisco-Oakland-Berkeley scores 61.1, buoyed by its median income ($129,315) and college-educated share (52.1%).
These metros illustrate the dominance of income and education in the CPG market.
Mid-Tier Metros: The Battleground
Denver-Aurora-Lakewood scores 46.8, with a median income of $96,920 and a college-educated share of 47.2%.
Austin-Round Rock-Georgetown, with a median income of $92,939 and a college-educated share of 48.5%, also scores 46.8.
These metros offer growth potential but require targeted strategies.
Bottom-Tier Metros: The Untapped Frontier
San Juan-Bayamón-Caguas, with a median income of $26,853, scores just 5.8.
Cleveland-Elyria, with a median income of $66,481, scores 19.7.
Memphis, with a median income of $62,178, scores 23.6.
These metros highlight the challenges of reaching underserved markets.
Deep Dive: Chicago, Dallas, Houston, Phoenix, Philadelphia
Chicago-Naperville-Elgin scores 45.3, with a median income of $85,087 and a college-educated share of 40.2%. Its youth index of 63.5 helps, but income and education drive its ranking.
Dallas-Fort Worth-Arlington scores 45.3, matching Chicago despite a slightly lower median income ($83,398) and college-educated share (37.7%). Its youth index of 96.5 boosts its score, but it’s still mid-tier.
Houston-The Woodlands-Sugar Land scores 41.6, dragged down by a median income of $78,061 and a college-educated share of 34.9%. Its youth index of 100.0 isn’t enough to lift it higher.
Phoenix-Mesa-Chandler scores 38.2, with a median income of $79,478 and a college-educated share of 34.9%. Its youth index of 80.0 helps, but income and education hold it back.
Philadelphia-Camden-Wilmington scores 39.4, with a median income of $85,555 and a college-educated share of 40.6%. Its youth index of 52.9 is middling, reflecting its mid-tier status.
Score Distribution Quartiles
The score distribution quartiles reveal stark divides. The top quartile (scores above 48.0) includes metros like San Jose (68.8) and New York (65.7). The bottom quartile (scores below 24.0) includes metros like Las Vegas (24.0) and Memphis (23.6).
The middle two quartiles (24.0–48.0) include metros like Chicago (45.3) and Phoenix (38.2). These metros offer growth potential but require careful targeting.
Why Youth Index Underperforms
The youth index correlates weakly with the composite score at 0.387. This suggests that while younger consumers (aged 25–44) are important, they’re not decisive.
Memphis, with a youth index of 80.0, scores just 23.6. Its low median income ($62,178) and college-educated share (30.4%) drag it down.
Austin-Round Rock-Georgetown, with a youth index of 94.1, scores 46.8. Its higher median income ($92,939) and college-educated share (48.5%) lift it into the mid-tier.
The takeaway? Youth matters, but income and education matter more.
Conclusion
Median income and college-educated share are the strongest predictors of CPG market readiness. Population size and youth index matter, but far less.
Brands chasing "hot" markets often overlook this. The data doesn’t lie.

Sources
Cpg Innovation Speed Integration
The Operations Leaders Driving Fast Growing Cpg Brands In 2026
Census ACS 2022 API — 5-Year Estimates
American Community Survey (ACS)
FRED — Federal Reserve Economic Data
Footnotes
1. The youth index measures the share of the population aged 25–44, a key demographic for premium CPG products.
2. Median home value serves as a proxy for affluence, though it’s imperfect.
3. The Census ACS 2022 API provides the data used here.
4. The scorecard weights population at 28%, but its correlation with the composite score is just 0.569.
5. San Juan-Bayamón-Caguas’s median income is less than 20% of San Jose-Sunnyvale-Santa Clara’s.
6. Las Vegas-Henderson-Paradise’s college-educated share is the lowest among the 47 metros.