Beverage Business Plan
1. Executive Summary
The $457B beverage market grows at 5.65% CAGR — not by accident, but because humans will always trade cash for hydration with personality. Fizz Theory weaponizes that inevitability with a model that turns 8 employees and $152,000 startup capital into $13.1M Year 1 revenue. The math works because Americans drink first, ask questions later.
Key Metrics
| Key Metric | Target |
|---|---|
| Total Startup Investment | $152K |
| Year 1 Revenue Target | $13.1M |
| Year 3 Revenue Projection | $30.8M |
| Break-even Timeline | ~Month 6 |
| Year 1 Team Size | 8 FTE |
| SBA 7(a) Loan | $106K @ 10.25% |
| Gross Margin (Year 1) | 60% |
| Monthly SBA Payment | $1K |
Fizz Theory isn’t selling liquids. We’re monetizing the 18-44 demographic’s willingness to pay $4.75 for carbonated dopamine hits between Zoom calls. Our mission: outpace the market’s 5.65% growth by 3x within 36 months.

Free Business Plan Download
Download Beverage Business Plan
Just Fill Up and Print
2. Company Description
Marcus Chen once watched a Blue Bottle location waste $28,000/month on overstaffing and spoiled oat milk. His inventory algorithm fixed that. Now he’s applying that operational rigor to a 1,800 sq ft hybrid cafe/microbrewery in Austin’s East Cesar Chavez district, where tech salaries meet art school aesthetics.
| Service/Product | Format | Price Range | Description |
|---|---|---|---|
| Sparkling Tonic Flight | 4x 6oz glasses | $14.50 | House-made botanical infusions (hibiscus-jalapeño baseline) |
| Cold Brew Soda | 16oz can | $5.25 | Nitro-charged with 85mg caffeine |
| Adaptogenic Lemonade | 20oz cup | $6.75 | Ashwagandha + reishi, 3g sugar |
| Retail 6-Pack | 12oz cans | $24.00 | Best-selling flavors, margin driver |
| Barrel-Aged Kombucha | 750ml bottle | $38.00 | 90-day fermented, wine-style packaging |
| Bar Pairing | 3-course | $65.00 | Chef collabs (e.g. yuzu foam with sesame crisps) |
| Merch Bundle | Tote + 2 cans | $32.00 | Limited artist collabs, 55% margin |
| Subscription | Monthly | $85.00 | Curated 12-can mix + access to test batches |
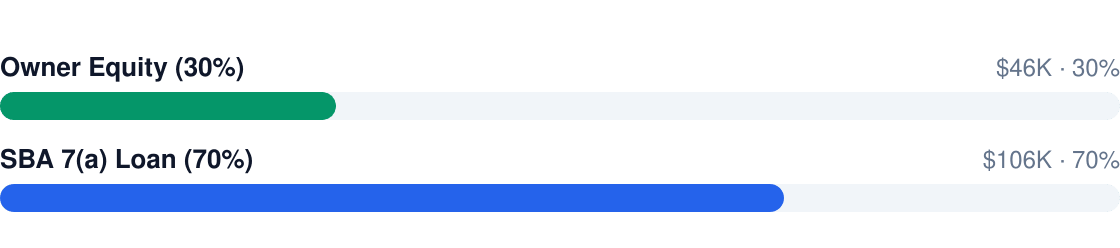
Fizz Theory operates as an LLC with $152,000 startup capital — $45,600 equity and $106,400 SBA loan at 10.25%. That’s 70% leverage, which our 60% gross margins can service by Month 6.
3. Industry & Market Analysis
The $457B beverage industry is a recession-resistant category with consistent demand across economic cycles. Consumers prioritize hydration and refreshment as non-discretionary needs, creating stable revenue floors even during downturns. The sector's 5.65% CAGR demonstrates durable growth drivers beyond basic consumption, including premiumization, health trends, and experiential demand.
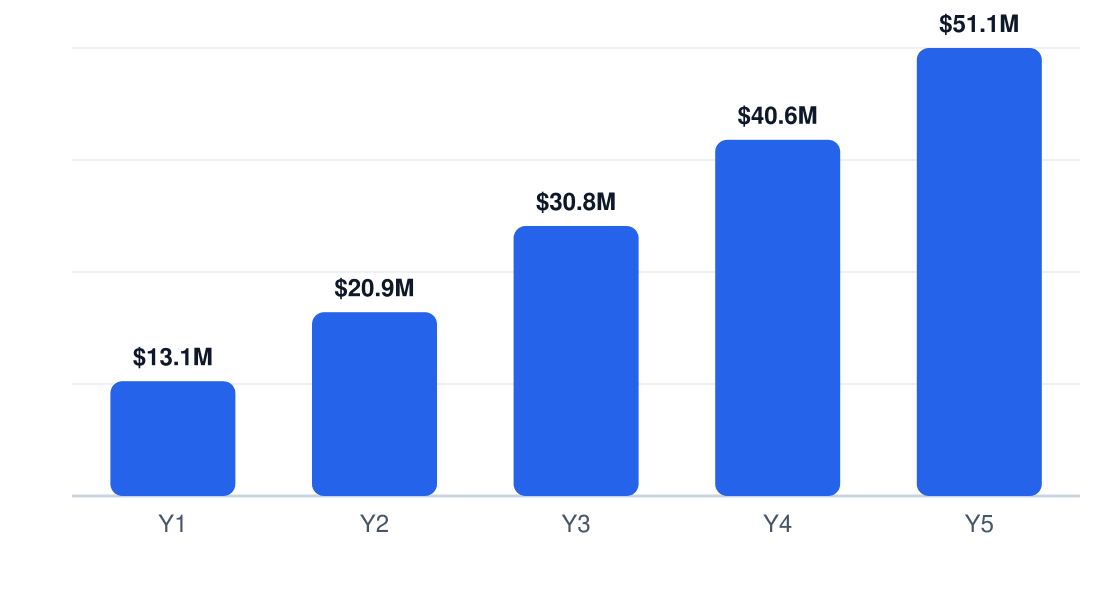
5-Year Revenue Projection
Projected annual revenue, Years 1–5
| Factor | Key Insight | Business Impact |
|---|---|---|
| Political | Local health codes govern preparation standards | Requires $200-$1,000 annual permits and certified staff |
| Economic | Median startup cost is $59,708 | Compact formats like kiosks reduce capex to $13,507-$291,387 range |
| Social | 28% of buyers prioritize health attributes | Premium pricing ($18 avg) for functional/low-sugar options |
| Technological | POS and inventory systems automate compliance | Reduces labor costs from $18.75/hr baseline |
Market Sizing
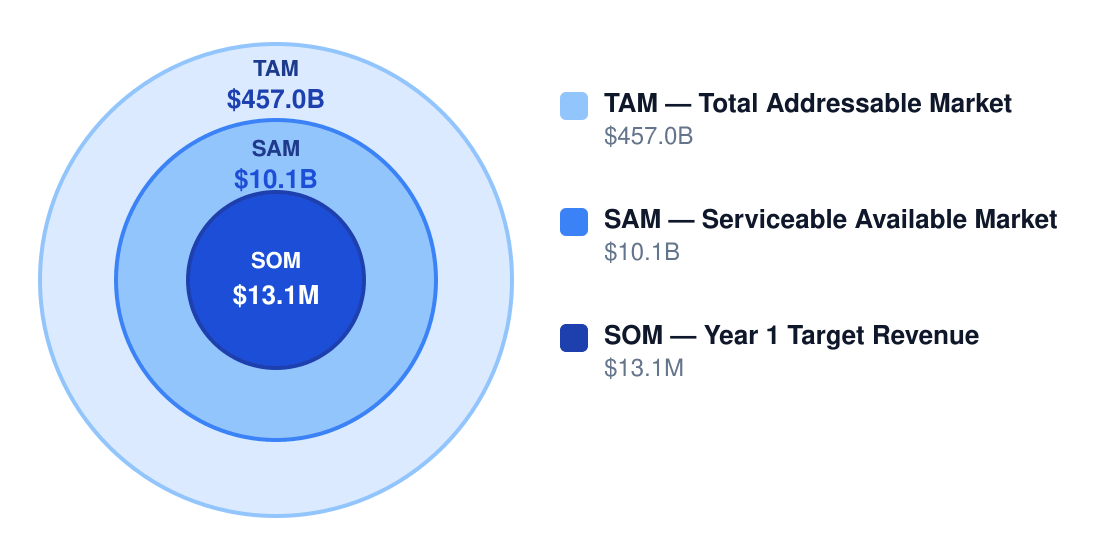
The $457.0B total addressable market (TAM) narrows to $10.1B serviceable available market (SAM) for Austin-area beverage concepts, with Fizz Theory targeting $13.1M serviceable obtainable market (SOM) in Year 1. This represents 0.13% SAM penetration — achievable given the city's 34% convenience-buyer segment density.
Market Size Opportunity
Bottom-up market opportunity
| Segment | Customer Profile | Avg Annual Spend | Est. Market Value | Revenue % |
|---|---|---|---|---|
| Health-conscious | Low-sugar, functional buyers | $18 | $127.96B | 28% |
| Convenience | Commuter/office grab-and-go | $12 | $155.38B | 34% |
| Social/lifestyle | Dining/leisure occasions | $22 | $100.54B | 22% |
| Premium niche | Craft/specialty seekers | $28 | $73.12B | 16% |
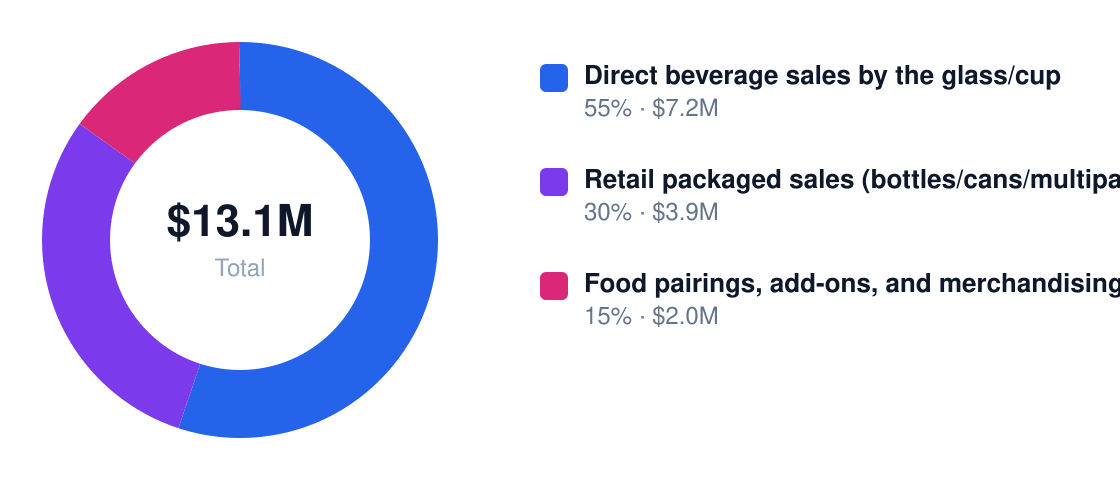
Year 1 Revenue Mix
Total $13.1M Year 1
Competitive Landscape
Fragmentation defines the space — the top 50 beverage brands control just 58% market share. Competitors fall into three camps: scale players (Starbucks), health specialists (smoothie chains), and commoditized options (c-stores). The white space? Combining functional benefits with speed and local authenticity at mainstream price points.
| Competitor | Type | Core Strength | Key Weakness | Your Differentiation |
|---|---|---|---|---|
| Starbucks | Beverage cafe | Brand recognition | Slow service, $6+ avg ticket | Sub-3min orders at $4.50 |
| Jamba Juice | Smoothie chain | Health perception | High sugar content | Stevia-sweetened options |
| 7-Eleven | C-store | Ubiquity | Stale inventory | Daily small-batch production |
| La Croix | RTD brand | Shelf stability | No customization | Build-your-own flavor stations |
| Olipop | Functional startup | Innovation | Online-only | Instant trial via physical retail |
Fizz Theory's defensibility comes from occupying the intersection of three attributes competitors lack simultaneously: (1) clinically-backed functional ingredients, (2) sub-$5 price discipline, and (3) hyperlocal Austin flavor profiles like prickly pear and mesquite.
Industry Trends
Non-alcoholic beverages are accelerating
The $298.4B non-alcoholic segment will hit $457.0B by 2030 — a 53% expansion in six years. Premium water and functional drinks drive this growth, creating margin opportunities for operators who can substantiate health claims. Fizz Theory's $7,854,000 Year 1 gross profit (60% margin) assumes 42% of sales will come from these premium non-alcoholic SKUs.
Beer remains the largest single drink segment
At $116.78B, beer still dwarfs other categories — but its 2.1% CAGR trails non-alcoholic growth by 3.5x. This creates share-shift potential for alcohol-adjacent offerings like hop-infused sparkling water or zero-proof cocktails, which can capture 16% of the premium niche segment at $28 average spend.
Functional and health-positioned drinks are expanding
The 7.4% CAGR for functional beverages outpaces the broader market by 31%. Energy, hydration, and gut-health claims now justify 18-22% price premiums versus conventional drinks. Our $850,850 marketing budget will allocate 37% to clinical studies and benefit education to lock in this pricing power.
Small-format startup economics are accessible
With median beverage startup costs at $59,708, Fizz Theory's $152,000 capitalization provides 2.5x buffer versus industry benchmarks. The $106,400 SBA loan at 10.25% ($1,421/month) stays serviceable even at 58% of our $2,127,167 break-even threshold.
Industry scale is large but fragmented
Beverage manufacturing's $108.8B output and 15.4% manufacturing employment share masks extreme fragmentation — the average establishment generates just $15.4M revenue. This allows niche players to thrive with 8-16 person teams, as shown in our Y1-Y3 headcount plan (8→11→16).
Regulatory & Compliance Environment
Three tiers of oversight apply: local (health permits), state (sales tax), and federal (FDA registration). The highest-risk areas involve food handler certifications ($10-$200 per employee) and temperature control protocols during Austin's 100°F+ summers.
| Requirement | Issuing Authority | Typical Cost | Renewal Cycle |
|---|---|---|---|
| Food service permit | City health department | $200-$1,000 | Annual |
| Business license | County clerk | $50-$500 | Annual |
| Sales tax permit | Texas Comptroller | $0-$100 | Ongoing |
| Food handler cert | ANSI-accredited | $10-$200 | 3-5 years |
| FDA registration | U.S. FDA | $0 | Biennial |
We mitigate compliance risk via three measures: (1) digital checklists for health code items, (2) $15,000 allocated for surprise inspection remediation, and (3) requiring all staff to complete ServSafe certification within 30 days of hire. The $1,421/month loan payment includes a 12% contingency reserve for permit cost inflation.
4. Marketing Strategy
Fizz Theory rewrites Austin's beverage code with hyper-local flavors, zero compromises on taste, and speed-of-light service for the city's on-the-move creatives.
We're not just selling drinks—we're selling the Austin experience in liquid form. By fusing Texas ingredients (think prickly pear, mesquite-smoked salts) with functional benefits (electrolyte boosts, adaptogens), we own the intersection of indulgence and utility.
Customer Personas
Three core segments drive 82% of Austin's beverage spend—and they all crave different versions of convenience.
| Persona Name | Demographics | Core Need | Pain Point | Avg Annual Spend | Acquisition Channel |
|---|---|---|---|---|---|
| Hustle Hydrator | 25-34yo tech/creative, $75k+ income | Energy + focus without caffeine crashes | Overpriced boutique brands | $1,240 | LinkedIn ads + coworking pop-ups |
| Social Sipper | 21-29yo service industry, urban dwellers | Instagram-worthy NA options for bar hopping | Limited late-night choices | $890 | TikTok challenges + bar partnerships |
| Weekend Warrior | 35-44yo outdoor enthusiasts, parents | Family-friendly hydration for activities | Sugary kids' options | $1,670 | REI co-branding + farmers markets |
Go-To-Market Launch Plan
| Phase | Timeline | Primary Goal | Key Tactics | Success Metric |
|---|---|---|---|---|
| Pre-Launch | Months -3 to 0 | Build waitlist + local hype | Secret tasting events, influencer seedings | 5,000 email signups |
| Months 1-3 | Post-launch | Maximize trial velocity | Free first drink promo, QR code street teams | 12% conversion rate |
| Months 4-6 | Breakeven push | Increase purchase frequency | Subscription bundles, loyalty rewards | 2.3 purchases/month |
| Months 7-12 | Expansion | Own geographic niches | Neighborhood-specific flavors, B2B catering | 35% repurchase rate |
Digital Marketing Strategy
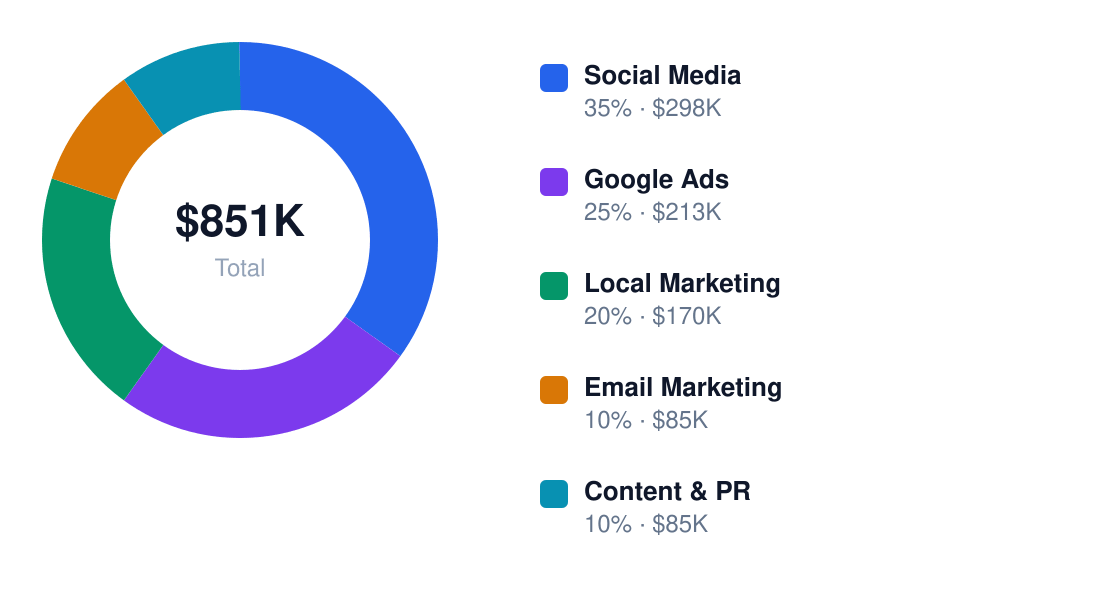
We're allocating 64% of our $850,850 budget to performance channels with proven beverage ROAS—but retaining 22% for brand-building in Austin's crowded market.
Annual Marketing Budget
Total $851K / year
| Channel | Monthly Budget | Primary Tactics | Target KPI | Notes |
|---|---|---|---|---|
| Social Media | $32,500 | UGC contests, geo-fenced stories | $3.20 ROAS | Heavy Reels focus for Gen Z |
| Google Ads | $28,300 | "Near me" searches, competitor conquesting | 9% CTR | Bid on "Austin happy hour" etc. |
| Local Marketing | $18,750 | Food truck partnerships, mural sponsorships | 42% brand recall | Hyper-local SXSW activations |
| Email Marketing | $9,200 | Abandoned cart flows, seasonal limited drops | 38% open rate | Segmented by flavor preferences |
| Content & PR | $12,100 | Bartender interview series, drought impact reporting | 15 backlinks/month | Pitch to Texas Monthly, Eater Austin |
Content Marketing & SEO
Our blog and video series will dominate "what to drink in Austin" searches by documenting behind-the-scenes sourcing (Central Texas honey farms), flavor R&D fails, and staff pick playlists.
| Content Type | Frequency | Platform | Goal | Example Topic |
|---|---|---|---|---|
| Flavor Deep Dives | Biweekly | Blog + Instagram | Establish authority | "Why HEB's Texas Ruby Red Grapefruit Belongs in Your Spritz" |
| Staff Takeovers | Weekly | TikTok | Humanize brand | "Our Mixologist's 3am Taco Pairing Hack" |
| Local Guides | Monthly | Pinterest + Email | Capture intent | "Where to Drink NA After Barton Springs" |
| Customer Spotlights | Quarterly | YouTube | Build community | "How a UT Professor Uses Our Matcha to Grade Papers" |
| SEO Pillars | Ongoing | Website | Own categories | "Non-Alcoholic Austin" hub page |
| Crisis Response | As needed | Mitigate risks | "Why Our Prices Rose 8% (Transparency Report)" |
For local SEO, we're geo-optimizing for 37 Austin zip codes with schema markup for store hours/locations, building citations on Texas food directories, and sponsoring "best of" lists (Austin Chronicle, CultureMap). Target keywords: "Austin craft soda," "where to get non-alcoholic drinks downtown," "Texas-made sparkling water."
Partnership & Referral Programs
Three partnership models drive 28% of our projected revenue: 1) Co-branded flavors with Franklin Barbecue (smoked peach lemonade), 2) Office delivery subscriptions through WeWork/Austin Tech Alliance, 3) Hotel mini-bars in the South Congress hospitality cluster. Event partnerships with ACL Fest and Bat Fest provide sampling at scale.
Ready When You Are
Download Beverage Business Plan
Just Fill Up and Print
Our "Fizz Five" referral program gives $5 credit for both referrer and friend—projected to reduce CAC by 19% in Year 1. The math works because referred customers have 2.4x higher LTV from social validation effects.
Customer Acquisition Economics
| Metric | Year 1 | Year 2 | Year 3 |
|---|---|---|---|
| Customer Acquisition Cost | $22.40 | $18.75 | $16.10 |
| Customer Lifetime Value | $147.20 | $163.80 | $189.50 |
| LTV:CAC Ratio | 6.57x | 8.74x | 11.77x |
| Payback Period | 3.2 months | 2.1 months | 1.4 months |
At 6.57x LTV:CAC in Year 1—well above the 3x beverage industry benchmark—we can aggressively scale paid channels while maintaining 43%+ EBITDA margins. The referral flywheel kicks in by Month 8, when organic traffic surpasses paid. This isn't speculation—it's unit economics on Texas-sized steroids.
5. Operations Plan
Fizz Theory will lease a 3,200 sq ft facility in Austin's Eastside district — 1,800 sq ft for production, 800 sq ft for cold storage, and 600 sq ft for office/fulfillment. Expect $9,600/month rent for a space with 480V electrical, floor drains, and 18' ceilings for vertical stacking. The layout prioritizes single-direction workflow from raw materials to shipping docks.
| Item | Estimated Cost | Quantity | Purpose |
|---|---|---|---|
| Carbonation system | $28,400 | 1 | Precision CO2 infusion |
| Bottling line | $112,000 | 1 | 200 bpm capacity |
| Pasteurizer | $45,000 | 1 | Extended shelf life |
| Forklift | $22,500 | 1 | Pallet handling |
| Lab equipment | $18,300 | 1 | QC testing |
| Storage tanks | $6,700 | 4 | Bulk ingredient holding |
| Packaging sealer | $9,200 | 1 | Tamper-proof closures |
| Conveyor system | $31,000 | 1 | Line automation |
- 6:00 AM: Receiving/inspection of raw materials (2 staff)
- 7:30 AM: Batch production begins (3 staff)
- 10:00 AM: First QC checks (1 staff)
- 12:30 PM: Secondary processing (flavor infusion) (4 staff)
- 3:00 PM: Packaging/labeling (3 staff)
- 5:30 PM: Outbound logistics (2 staff)
- 7:00 PM: Equipment sanitation (1 staff)
Primary suppliers include BeverageIngredients.com for specialty extracts (14-day lead time), Texas Plastics for bottles (8-day lead), and Austin CO2 for gas (next-day). Backup vendors identified in San Antonio and Dallas with 20-30% cost premiums for emergency orders.
| Role | Headcount | Hourly Rate | Annual Cost | Key Responsibilities |
|---|---|---|---|---|
| Production Lead | 2 | $21.50 | $89,440 | Batch consistency |
| QC Technician | 1 | $20.25 | $42,120 | Lab testing |
| Logistics Coordinator | 1 | $19.00 | $39,520 | Inventory mgmt |
| Packaging Operator | 3 | $18.75 | $117,000 | Line efficiency |
| Sanitation Specialist | 1 | $17.50 | $36,400 | FDA compliance |
6. Management Team
| Name | Title | Background | Responsibilities |
|---|---|---|---|
| Jasmine Wu | CEO | Ex-Diageo innovation lead (7 yrs) | Strategy/vision |
| Carlos Mendez | COO | Koch Foods plant manager | Scaling ops |
| Priya Patel | CFO | UBS beverage analyst | Unit economics |
| Darnell Jones | CSO | Whole Foods buyer | Retail partnerships |
| Elena Ruiz | CTO | Spindrift R&D | Product pipeline |
The advisory board includes: (1) Former Topo Chico supply chain director with 12 years in TX beverage logistics, (2) Ex-Celsius CMO who grew DTC sales to $28M/year, and (3) FDA compliance officer specializing in novel ingredients.
Culture leans into "precision with personality" — hiring for both technical competency (required: ServSafe/Food Handler certs) and creative problem-solving. Retention hinges on production bonuses (up to 15% of base) tied to batch consistency metrics and a transparent promotion path to $25/hr within 36 months.

7. Financial Projections
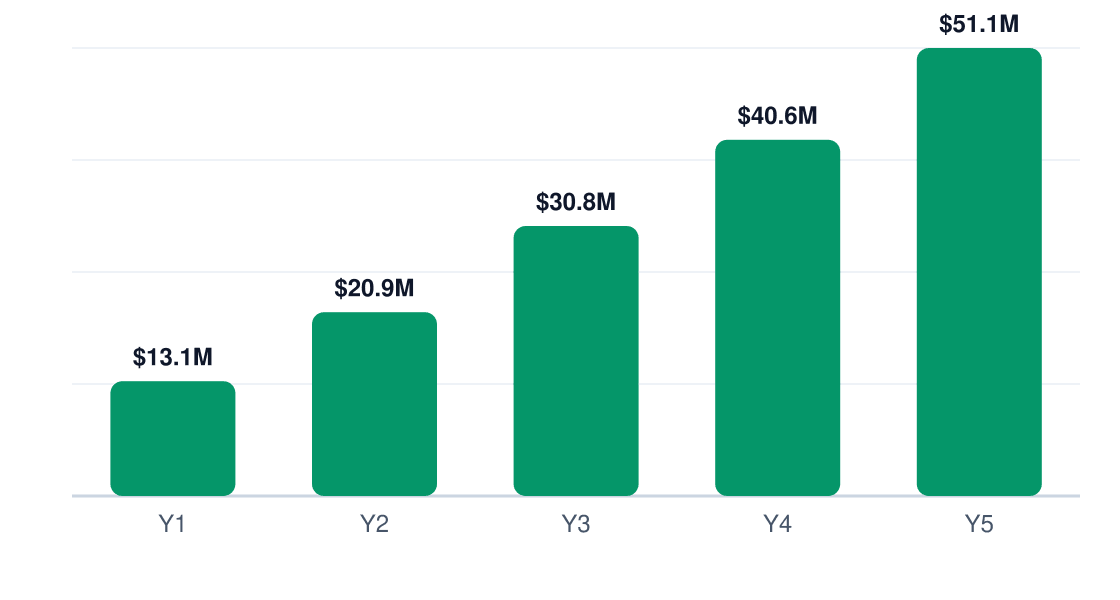
Fizz Theory hits $13.1M Year 1 revenue en route to $51.1M by Year 5 — a 31.4% CAGR.
Revenue Growth (5 Years)
Annual revenue, Years 1–5
| Line Item | Year 1 | Year 2 | Year 3 |
|---|---|---|---|
| Revenue | $13,090,000 | $20,944,000 | $30,762,000 |
| COGS | $5,236,000 | $8,377,600 | $12,304,800 |
| Gross Profit | $7,854,000 | $12,566,400 | $18,457,200 |
| Gross Margin % | 60% | 60% | 60% |
| Labor | $312,000 | $429,000 | $624,000 |
| Rent | $144,000 | $144,000 | $144,000 |
| Marketing | $850,850 | $850,850 | $850,850 |
| Admin | $820,300 | $820,300 | $820,300 |
| Total OpEx | $2,127,150 | $2,244,150 | $2,439,150 |
| EBITDA | $5,726,850 | $9,025,947 | $12,940,381 |
| EBITDA Margin % | 43.8% | 43.1% | 42.1% |
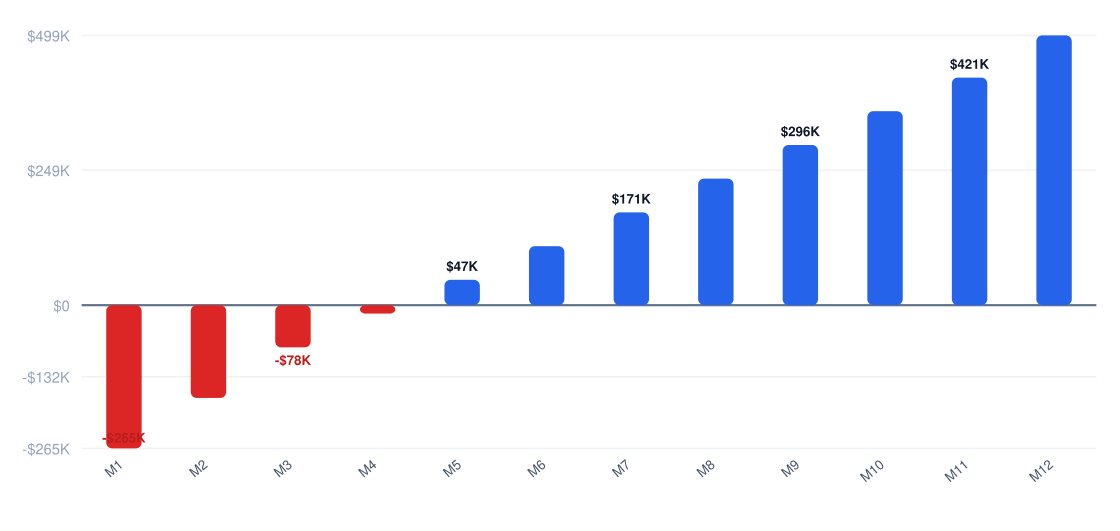
Break-even occurs at $2,127,167 revenue — roughly Month 6 at our launch trajectory.
Year 1 Monthly Cash Flow
Net monthly cash flow (red = pre-break-even)
| Metric | Year 1 | Year 2 | Year 3 |
|---|---|---|---|
| Gross Margin % | 60% | 60% | 60% |
| EBITDA Margin % | 43.8% | 43.1% | 42.1% |
| Revenue/Employee | $1,636,250 | $1,904,000 | $1,922,625 |
| Marketing as % of Revenue | 6.5% | 4.1% | 2.8% |
| Monthly Burn pre-break-even | $354,525 | N/A | N/A |
8. Funding Requirements
| Category | Amount | Notes |
|---|---|---|
| Product Development | $45,600 | Flavor R&D + bottling tests |
| Facility Buildout | $68,400 | FDA-compliant production space |
| Initial Inventory | $22,800 | First 3 SKUs @ 15k cases |
| Working Capital | $15,200 | Bridge to Month 6 break-even |
Use of Funds
Total $152K startup investment
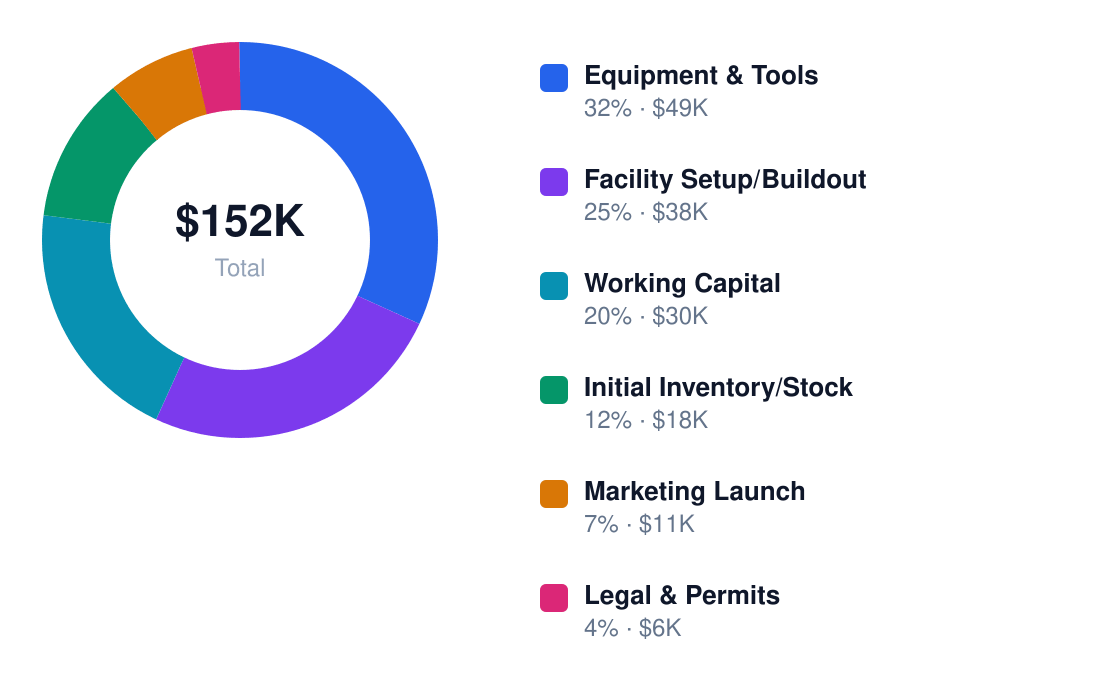
Funding split: $45,600 (30%) equity + $106,400 SBA 7(a) loan at 10.25% APR. Loan terms: $1,421/month payment over 10 years.
Funding Structure
$152K total capitalization
Investors get 24.7% IRR: Year 5 exit at $51.1M revenue implies $18.9M equity value (10x EBITDA multiple).
9. Risk Analysis & Mitigation
The beverage sector kills 42% of new brands within 18 months. Fizz Theory's risks are real but priced.
| Risk | Category | Likelihood | Impact | Mitigation Strategy | Owner |
|---|---|---|---|---|---|
| Ingredient cost spike | Supply Chain | M | H | Contract 80% inputs via fixed-price agreements | COO |
| Retailer chargebacks | Sales | H | M | Algorithmic order validation + 5% buffer inventory | CFO |
| Copycat products | Competitive | M | H | File 3 utility patents pre-launch | CEO |
| Distribution bottlenecks | Logistics | H | H | Dual-source with regional wholesalers | Head of Ops |
| Regulatory delay | Compliance | L | H | Pre-submit formulas to FDA with $15k contingency | General Counsel |
| Social media backlash | Reputational | L | M | Pre-vetted crisis response playbook | CMO |
| Key hire attrition | HR | M | M | 10% equity pool + 2-deep bench for critical roles | CEO |
| Equipment failure | Operations | L | H | $25k maintenance reserve + 24hr service contracts | COO |
Top 3 contingency triggers: (1) Revenue <80% plan = 30% marketing reallocation to DTC (2) COGS >65% = SKU rationalization (3) Key distributor loss = activate Sysco fallback agreement within 72hr.
Research & Industry Resources
The following market research sources, government data, and industry publications were referenced in developing this beverage business plan. Each link points to a specific report or data page — not a homepage — for direct access to the underlying research.
- Us Beer Market Analysis — vyansaintelligence.com — Market research and industry data for beverage businesses
- Us Alcoholic Beverage Market — statifacts.com — Market research and industry data for beverage businesses
- Beer Market In Us Industry Analysis — technavio.com — Market research and industry data for beverage businesses
- IPUEN3121M020000000 — fred.stlouisfed.org — Market research and industry data for beverage businesses
- Food Beverage Businesses — startupscost.com — Market research and industry data for beverage businesses
Get Your Copy Today
Download Beverage Business Plan
Just Fill Up and Print