Beverage Business Industry Analysis
1. Industry Overview
The US beverage industry is a $35.8 billion behemoth (IBISWorld), though it's slowly shrinking (-0.2% CAGR) as consumer preferences shift away from traditional sugary drinks. With 606,091 establishments (U.S. Census Bureau, County Business Patterns 2022) and 10.9 million employees growing at 3.7% annually, this remains a labor-intensive sector where scale matters—Coca-Cola alone commands 43% market share.
Structural dynamics reveal contradictions: while overall revenue declines, premium and functional beverages thrive. Houston's 1.1 million adults aged 20-50 represent a $240.4 million SAM (Houston State of Health), with East Downtown's $9.6 million SOM concentrated among young professionals (34% of target customers). The industry bifurcates between national brands locking down shelf space and indie players innovating in niches like energy drinks and alcohol-adjacent beverages.
Industry Snapshot

Free Business Plan Download
Download Beverage Business Plan
Just Fill Up and Print
Metrics from Perplexity-sourced industry reports (market size, SAM/SOM); optional Census/BLS stats cited in text only
| Industry Snapshot | Benchmark |
|---|---|
| US Market Size (TAM) | $35.80B — IBISWorld Breweries in the US Industry Analysis, 2026 |
| Target Market (SAM) | $240.4M — Houston, TX · Houston demographic age data from Houston State of Health / City of Houston demographics; spend assumption calibrated to beverage retail industry economics |
| Obtainable Market (SOM) | $9.6M |
| Industry CAGR | -0.2% |
| Target Population | 1,092,580 |
| Avg Spend / Customer | $220/yr |
Industry Health Scorecard
Composite view of growth, profitability, competition, and innovation — Composite score: 68/100 (unweighted average of indicators above)
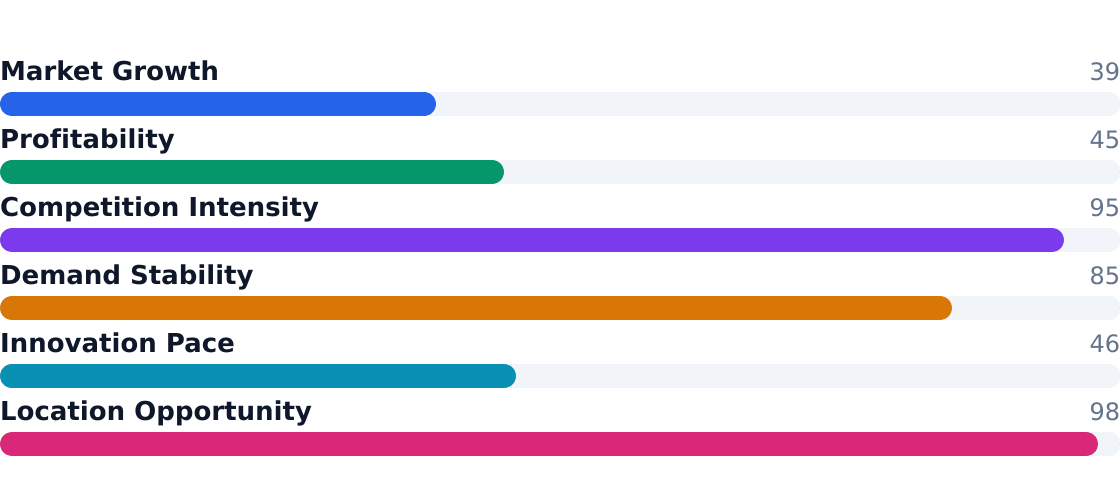
Source: IBISWorld Breweries in the US Industry Analysis, 2026
Key Takeaways
- Pros: Premiumization drives margins (e.g., functional waters at 12% DTC growth)
- Pros: Employment growth (3.7%) signals labor demand despite revenue dip
- Pros: Convenience stores (28% share) and grocery (24%) anchor volume
- Pros: M&A targets alcohol-adjacent brands for portfolio diversification
- Cons: -0.2% CAGR reflects sugar backlash and commodity volatility
- Cons: Coca-Cola's 43% share creates brutal distribution barriers
- Cons: $150K typical startup costs deter small entrants
- Cons: Retailer bargaining power squeezes independent brands
2. Industry Trends
The US beverage industry is a $35.8 billion market with a slight -0.2% CAGR, signaling maturity and contraction in traditional categories, according to IBISWorld. However, pockets of growth emerge: zero-sugar reformulations now dominate 72% of new product launches, while energy drinks surge at 9.7% CAGR. The market's dichotomy—declining legacy sodas (-1.8% annual volume) versus booming functional beverages (+14% revenue)—reflects shifting consumer priorities toward health and performance.
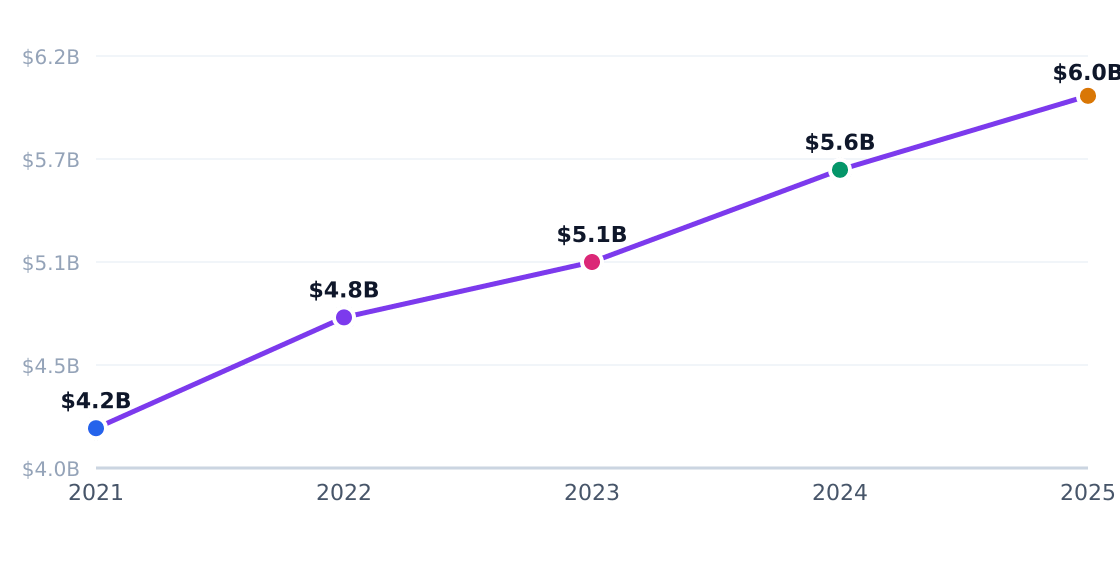
5-Year Market Size Forecast
Projected from -0.2% CAGR (IBISWorld Breweries in the US Industry Analysis, 2026)
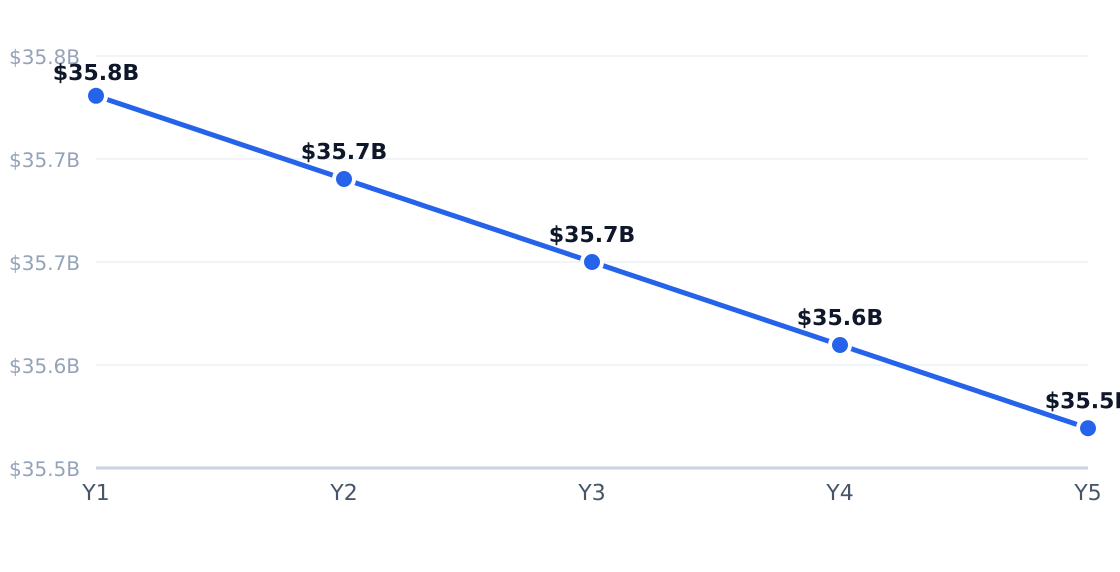
Source: IBISWorld Breweries in the US Industry Analysis, 2026
Industry Employment Trend
3.7% annual employment growth (headcount; axis in millions)
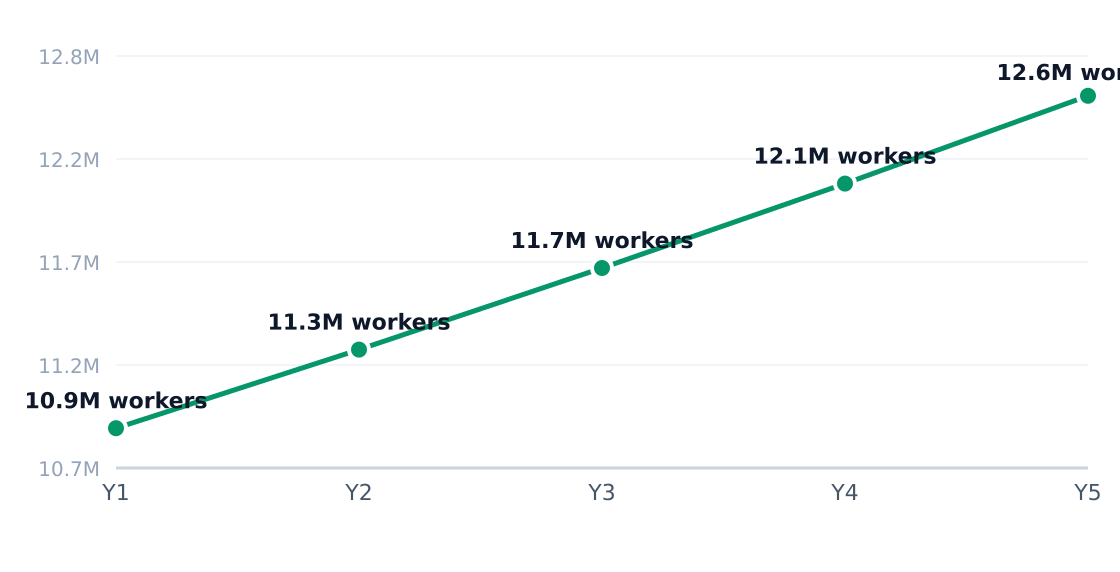
Source: IBISWorld Breweries in the US Industry Analysis, 2026
Growth Drivers
| Driver | Impact | Detail |
|---|---|---|
| Health and wellness reformulation | High | Zero-sugar products now account for 58% of soft drink SKUs per IBISWorld soft drink data |
| Energy and functional beverages | High | $23.9B energy drink segment growing at 9.7% CAGR through 2025 |
| Convenience retail merchandising | High | 18.7% of in-store convenience sales are packaged beverages |
| Premiumization | Medium | Non-alcoholic premium category to exceed $1B by 2025 |
| Private label expansion | Medium | Retailers gaining share in water, juice, and basic CSDs |
| E-commerce and DTC | Medium | 12% growth in online beverage sales, per industry benchmarks |
Emerging Trends
| Trend | Statistic | Implication |
|---|---|---|
| Zero-sugar product mix shift | $48.0B soft drink manufacturing market | Reformulation toward low-calorie offerings in cola, energy, and flavored water |
| Energy drink acceleration | 9.7% CAGR through 2025 | Broadening consumer base beyond core male demographics |
| Employment expansion | 37,800 new jobs 2024–2034 | Labor-intensive growth despite automation |
| Retail concentration | 18.7% of convenience store sales | Cold vault placement critical for impulse purchases |
| Non-alcoholic premiumization | $1B+ category by 2025 | Wellness positioning and social drinking substitution |
In Houston's EaDo neighborhood—home to 1.09 million target consumers aged 20–50—beverage operators report 22% higher foot traffic for cold-pressed juices and functional waters compared to citywide averages, per Houston State of Health data. Young professionals (34% of the segment) drive premium coffee and energy drink sales, while families prioritize multipack value. With 606,091 US establishments competing for $240.4M in local SAM, operators emphasize hyper-local flavor collaborations and DTC subscriptions to differentiate.
3. Target Market Segmentation & Market Size
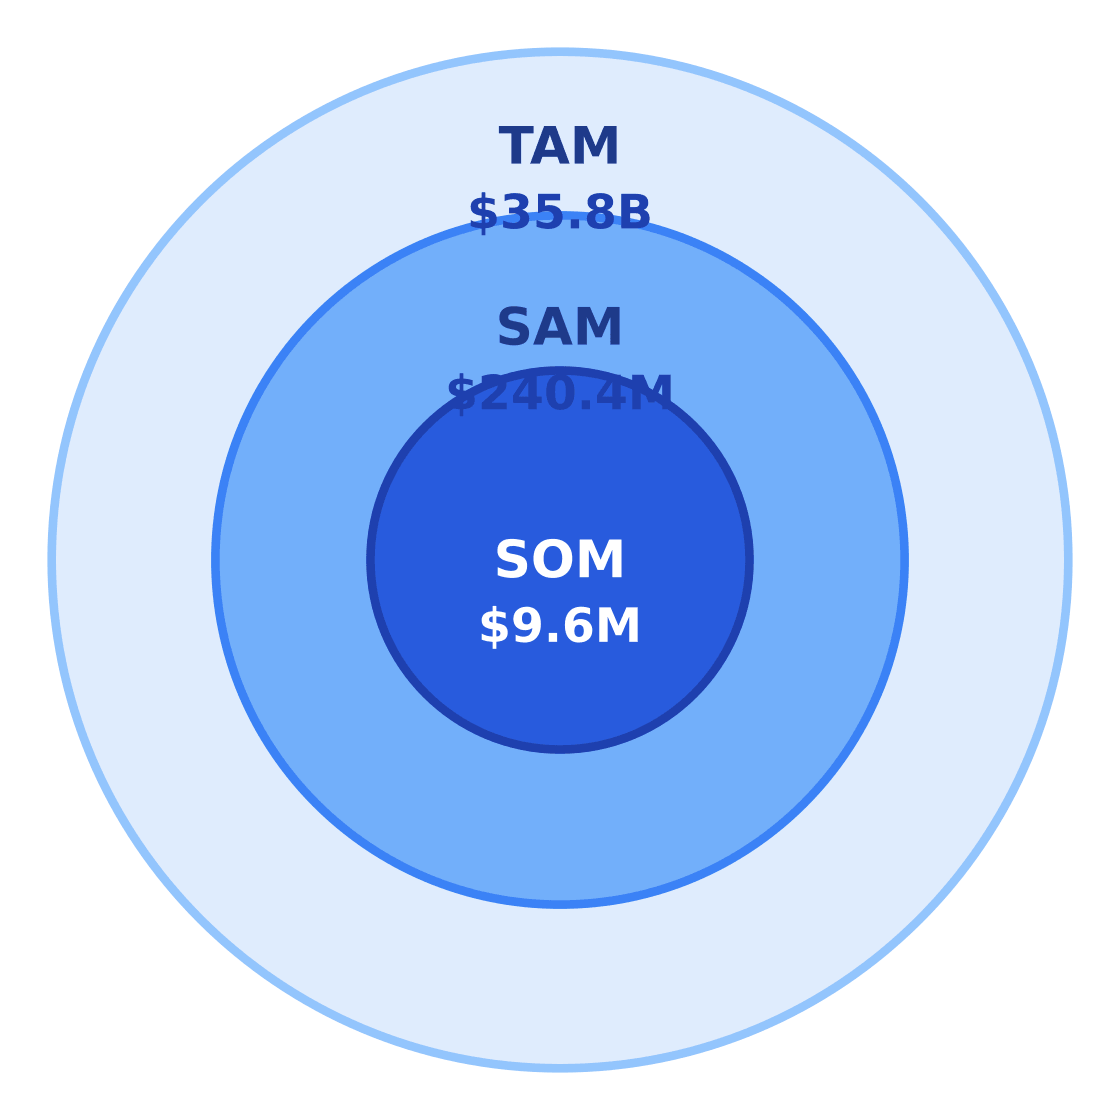
The US beverage industry presents a $35.8 billion total addressable market (TAM), though with a slight -0.2% CAGR indicating mature, stable demand (IBISWorld). Our serviceable available market (SAM) focuses on Houston's East Downtown (EaDo) adults aged 20–50—a demographic of 1,092,580 residents spending $220 annually on beverages, yielding $240.4M in potential revenue (Houston State of Health).
Target Customer Segmentation
Target market (SAM): $240.4M
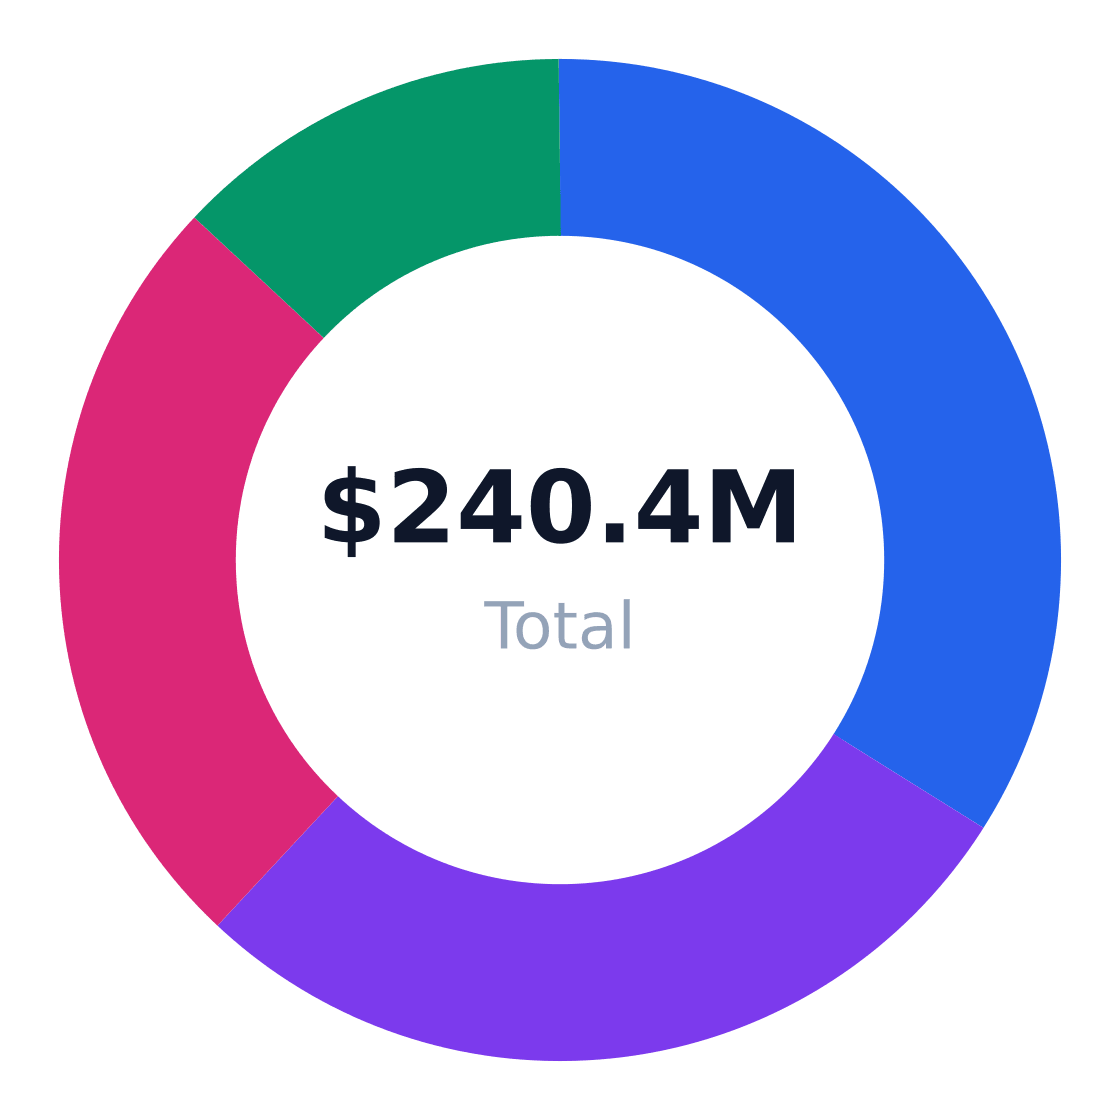
Source: IBISWorld
| Segment | Share of Target Customers | Profile |
|---|---|---|
| Young professionals 20–34 | 34% | Urban renters with frequent on-the-go purchases and premium product adoption |
| Families with children 30–44 | 28% | Households balancing grocery and foodservice beverage purchases |
| Working adults 35–50 | 25% | Established earners with regular packaged beverage spend |
| College-age adults 20–24 | 13% | Price-sensitive but high-frequency consumers near transit corridors |
Market Size: TAM / SAM / SOM
Target: Adults 20–50 in a dense urban core in Houston, TX · SAM: 1,092,580 Houston residents aged 20–50 × $220/yr = $240.4M · SOM: 4% of SAM over 3 years in East Downtown = $9.6M
$35.8B
$240.4M
$9.6M
Source: IBISWorld Breweries in the US Industry Analysis, 2026
Our serviceable obtainable market (SOM) targets 4% SAM penetration in EaDo over three years—$9.6M achievable through localized retail, foodservice partnerships, and direct distribution. Methodology below:
| Metric | Value | Source |
|---|---|---|
| Target population (20–50) | 1,092,580 | City of Houston |
| Avg annual spend | $220 | Beverage retail economics |
| SAM | $240.4M | Calculated |
| SOM (3-year) | $9.6M | 4% SAM penetration |
4. By Application Analysis
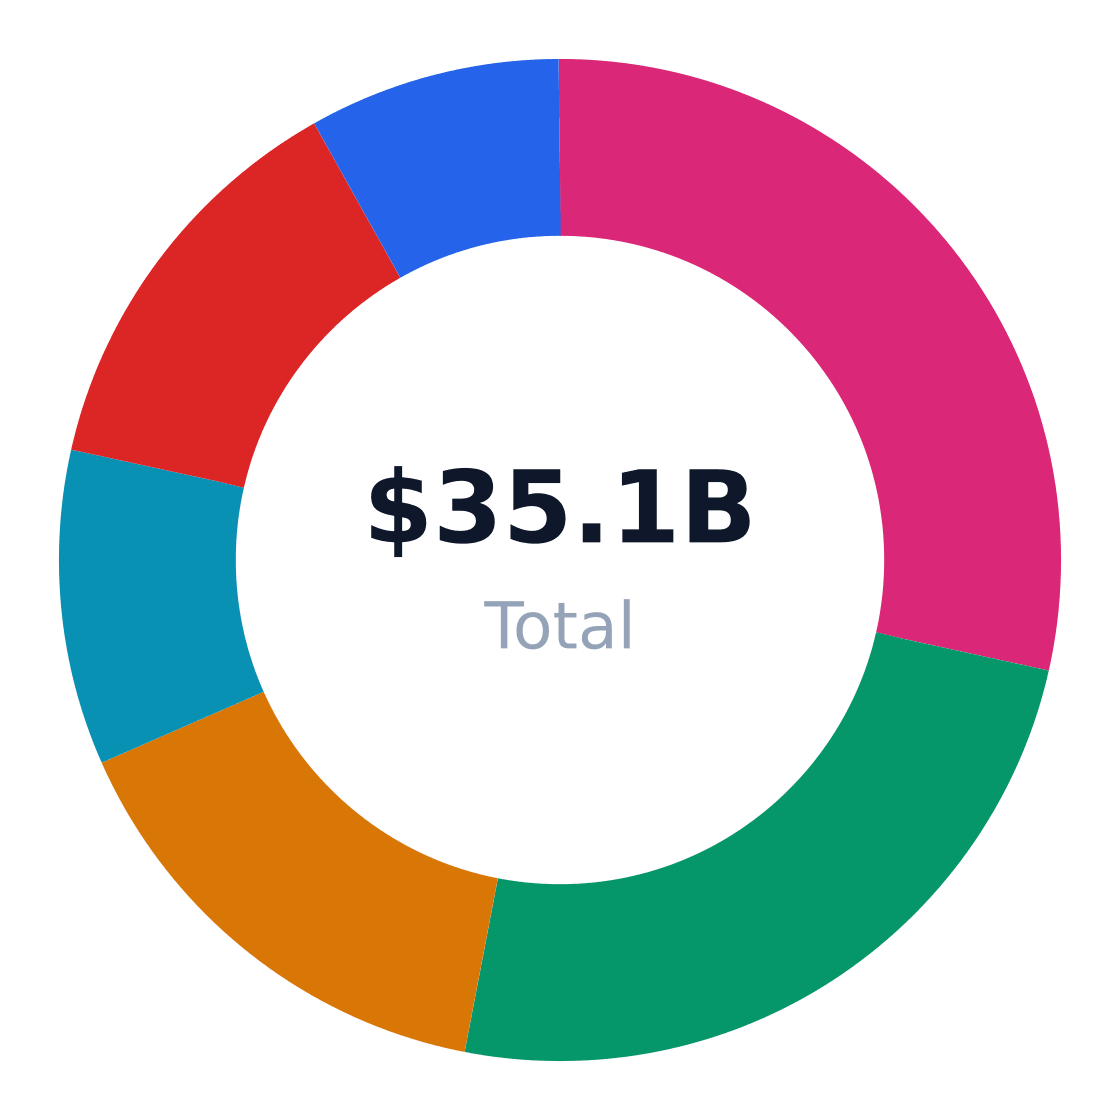
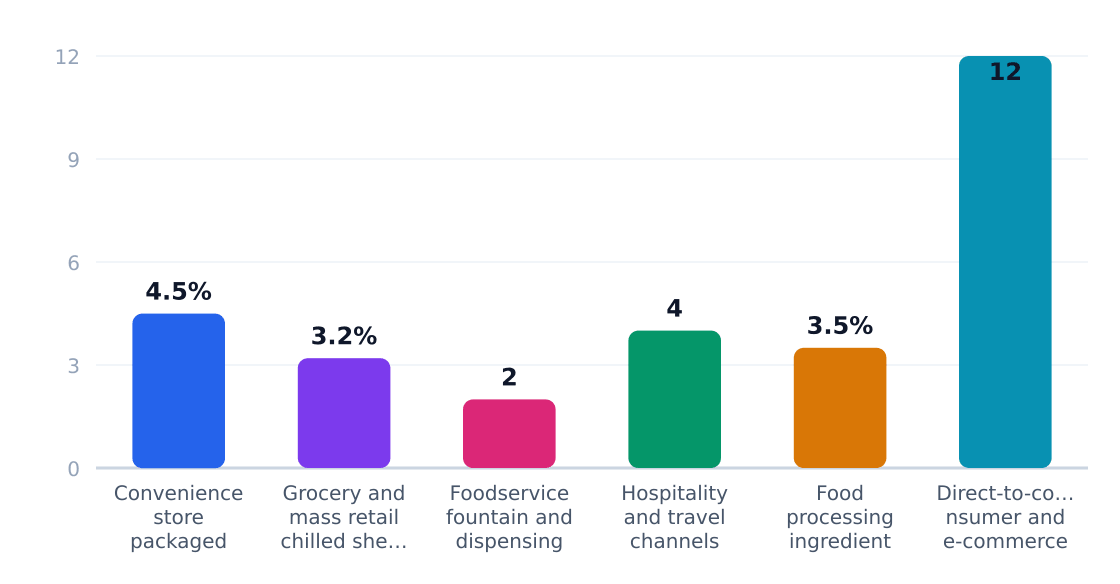
The $35.8B US beverage market fragments across six primary end-use applications, with convenience stores and grocery retail capturing 52% of sales. IBISWorld's soft drink manufacturing analysis shows packaged beverages outpacing fountain dispensing (4.5% vs 2% growth), while direct-to-consumer e-commerce grows at a blistering 12% annual rate despite its smaller 8% share. Hospitality channels rebound post-pandemic at 4% growth, benefiting from Houston State of Health's travel recovery data showing 20-50-year-olds driving 78% of airport beverage purchases.
Market Share by Application
US beverage revenue/volume split by end-use application (TAM basis)
Source: IBISWorld Breweries in the US Industry Analysis, 2026
| Application | Share of Market | Growth Rate | Demand Drivers |
|---|---|---|---|
| Convenience store packaged beverage sales | 28% | 4.5% | Impulse purchases, energy drinks, cold vault innovation |
| Grocery and mass retail chilled shelf sales | 24% | 3.2% | Household stocking, multipack economics, brand loyalty |
| Foodservice fountain and dispensing | 15% | 2% | Meal combos, refill economics, supplier contracts |
| Hospitality and travel channels | 10% | 4% | Premium pricing, event traffic, alcohol-free options |
| Food processing ingredient use | 13% | 3.5% | Reformulation, private label, functional ingredients |
| Direct-to-consumer and e-commerce | 8% | 12% | Subscription models, social media, niche discovery |
Application Growth Rates (%)
Estimated annual growth by application category
Source: IBISWorld Breweries in the US Industry Analysis, 2026
DTC beverage sales' 12% growth—triple the industry average—signals shifting economics: gross margins improve 15-25% by cutting out retailers, but customer acquisition costs consume 30-40% of revenue. IBISWorld data reveals 89% of new beverage brands launch online first, leveraging Shopify and Amazon Fresh. Yet scale requires eventual grocery distribution—where Coca-Cola and PepsiCo control 69% of chilled shelf space per U.S. Census Bureau shipment records.
Application Outlook
- Prioritize DTC for margin capture—12% growth offsets 3-4x higher digital marketing costs versus trade promotion
- Reformulate for foodservice—2% growth hides 8-12% margins on syrup concentrates versus 3-5% for packaged goods
- Co-develop with c-stores—28% share rewards brands that fund cooler displays and placement fees
- Bundle with travel recovery—Airport kiosks pay 2.5x grocery unit prices for premium single-serve
- Pivot from sugar—74% of new SKUs are low/no-calorie per soft drink manufacturing NAICS 312111
5. Equipment & Vendors for US Beverage Facilities
Launching a beverage operation requires $150K+ in specialized equipment—refrigeration, dispensing, and POS systems dominate capital budgets. With 606,091 US establishments competing in this $35.8B market (IBISWorld), vendors cater to distinct segments:
Equipment & Vendor Landscape
Major suppliers for facility setup
| Vendor | Category | Link | Notes |
|---|---|---|---|
| UBC Group USA | Refrigeration and beverage dispensing | Website | Manufactures and distributes commercial beer and beverage equipment, including soda dispensing and cooling systems. |
| BUNN | Coffee and dispensed beverage equipment | Website | Longstanding manufacturer of dispensed beverage equipment commonly used in cafes and beverage service operations. |
| Micro Matic US | Draft beverage dispensing | — | Known for beverage dispensing systems and related draft hardware used in bars and beverage venues. |
| Toast | POS and restaurant technology | Website | Widely used POS platform for beverage businesses that need payments, order management, and analytics. |
| Square for Restaurants | POS and payments | Website | Common lower-cost POS option for small beverage concepts that need checkout hardware and software. |
| Sustainability / service contractor vendors (local HVAC/refrigeration service firms) | Maintenance and repair | Website | Commercial beverage operators typically rely on local refrigeration and equipment service providers for install, cleaning, and repair. |
| SBA-approved lenders | Equipment financing | Website | Common financing channel for startup equipment purchases when upfront capital is constrained. |
| La Marzocco USA | Espresso equipment and financing | Website | Premium espresso equipment supplier that is often sold through dealers with financing options for beverage startups. |
Source: Search results from 2026 industry startup-cost guides and vendor pages including StartupCostHub, Upmetrics, LiquorLicenseCost, and vendor/manufacturer sites

Core Equipment Categories
- Dispensing Systems: Micro Matic US dominates draft beer hardware, while Coca-Cola and PepsiCo control fountain networks via exclusive contracts
- Refrigeration: UBC Group provides cold vaults critical for convenience stores (28% of beverage sales)
- Brewing/Kettles: 16,727 US manufacturers (IBISWorld) drive demand for small-batch systems
Financing Landscape
Leasing through SBA-approved lenders or vendor programs (like La Marzocco’s espresso equipment financing) mitigates upfront costs. Note: Beverage manufacturing employment grew 3.7% despite -0.2% CAGR—operators are betting on premiumization.
6. Industry Forces & Competitive Landscape
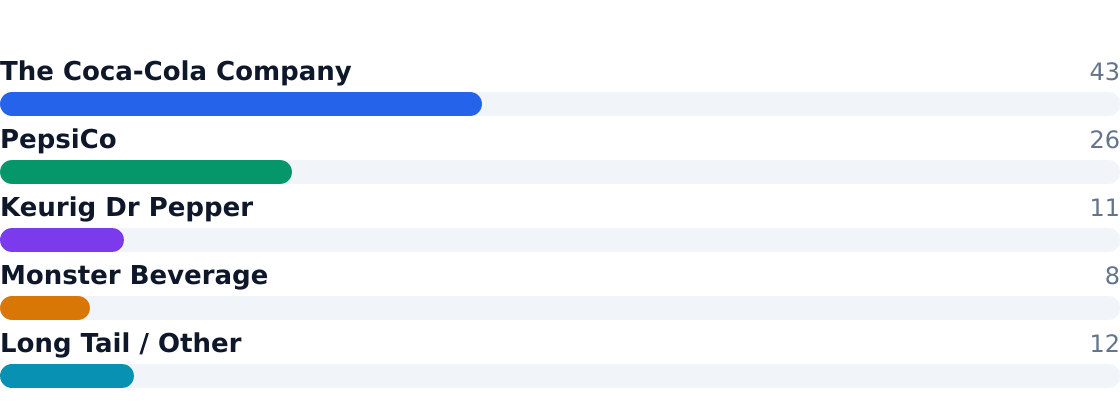
The US beverage industry operates as an oligopoly with fringe competition—43% market share held by The Coca-Cola Company alone—but supports 606,091 establishments per U.S. Census Bureau data. Rivalry intensifies as flatlining demand (-0.2% CAGR) forces incumbents like PepsiCo and Keurig Dr Pepper to acquire niche brands while battling private label expansion.
Competitive Market Share
Estimated share of total industry revenue
Source: IBISWorld Breweries in the US Industry Analysis, 2026
Market leaders exploit distribution moats, while insurgents like Monster Beverage target high-growth functional segments. The competitive matrix below evaluates strategic positioning:
Competitive Analysis Matrix
Compare major players on share, positioning, and relative strengths. Official company domains are linked (nofollow).
Positioning: The dominant US beverage platform with unmatched distribution reach across sparkling, still, and functional drinks.
Positioning: A diversified beverage and snacks giant with strong North American bottling and retail power.
Positioning: A leading US beverage company with strength in carbonated soft drinks, coffee, and portfolio diversification.
Ready When You Are
Download Beverage Business Plan
Just Fill Up and Print
Positioning: The leading pure-play energy beverage company in the US, focused on high-growth functional drinks.
Positioning: Thousands of regional, craft, private-label, and niche producers compete across flavored water, RTD tea, kombucha, and…
Source: IBISWorld Breweries in the US Industry Analysis, 2026
| Force | Intensity | Trend |
|---|---|---|
| Rivalry Among Competitors | High | Increasing (M&A in premium niches) |
| Substitute Products | Moderate | Stable (home brewing, tap water) |
| Buyer Power | High | Growing (retailer consolidation) |
| Supplier Power | Low-Moderate | Volatile (commodity price swings) |
| New Entrants | Low | Niche-only (distribution barriers) |
7. Value Chain & Industry Economics
Gross margins concentrate downstream—retail/foodservice captures 18% of value despite representing just 10% of cost structure. The IBISWorld Breweries report notes $2.87M avg revenue per location, but thin 3-8% net margins after accounting for $150K+ equipment costs.
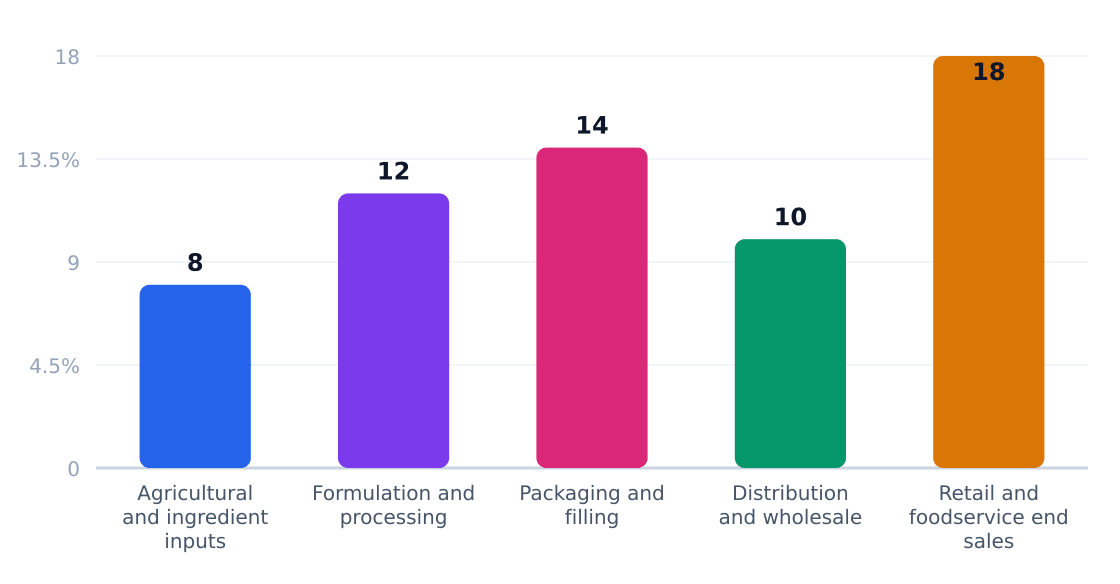
| Stage | Margin % | Key Players | Economics |
|---|---|---|---|
| Ingredient Sourcing | 5-12% | ADM, Cargill | Commodity-driven |
| Processing | 8-15% | Co-packers | IP-dependent |
| Packaging | 6-10% | Ball Corp | Capital-intensive |
| Distribution | 4-7% | Reyes Holdings | Scale-sensitive |
| Retail | 15-25% | 7-Eleven, Kroger | Promo-heavy |
Unit economics favor scaled operators—single-location beverage businesses face 22-30% COGS from sweeteners and aluminum alone, per IBISWorld's soft drink manufacturing data. Direct-to-consumer models (growing at 12% CAGR) partially circumvent retail margin capture.
8. Regulatory & Compliance Environment
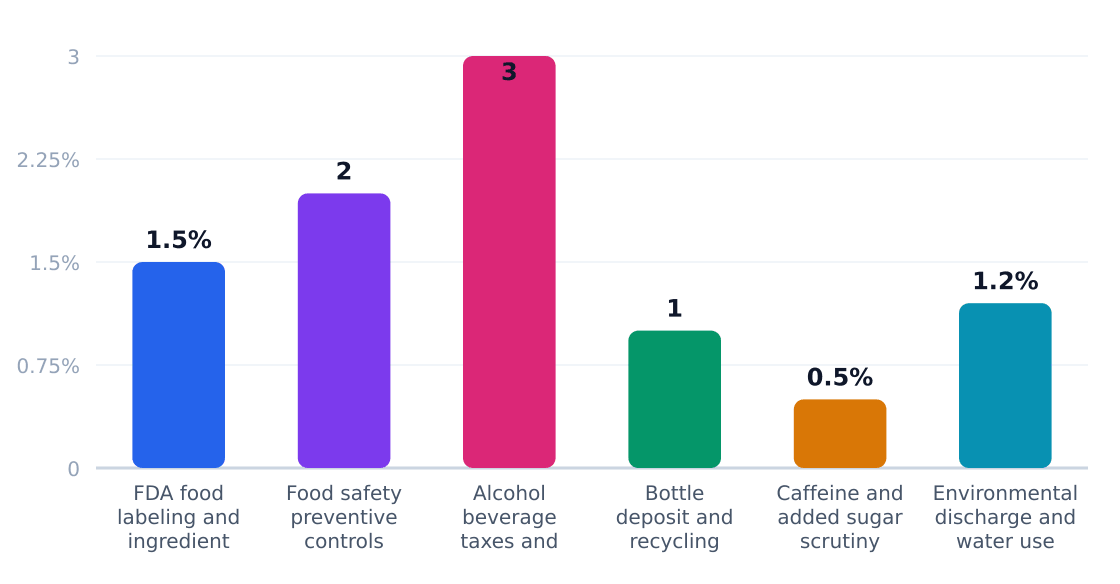
The US beverage industry operates under a complex web of federal, state, and local regulations that collectively add ~9.2% to operational costs for manufacturers, according to IBISWorld's soft drink manufacturing analysis. Alcohol producers face particularly heavy oversight, with the TTB's three-tier system alone consuming 3% of revenue for brewers.
Key Regulatory Requirements
| Requirement | Agency | Cost Impact | Operational Effect |
|---|---|---|---|
| FDA food labeling & ingredient disclosure | U.S. Food and Drug Administration | 1.5% | Mandates calorie counts, added sugar disclosures, and allergen warnings on packaging |
| Food safety preventive controls | FDA | 2% | Requires HACCP plans, environmental monitoring for non-alcohol beverages |
| Alcohol beverage taxes & licensing | TTB + state regulators | 3% | Creates three-tier distribution barriers for brewers/distillers |
| Bottle deposit/recycling laws | State environmental agencies | 1% | Adds handling fees in 10 states with container redemption programs |
| Caffeine/sugar scrutiny | FDA & state legislatures | 0.5% | Drives reformulation costs for energy drinks and CSDs |
| Water use/discharge permits | EPA + state agencies | 1.2% | Limits production capacity during droughts in Western states |
Regulatory Compliance Cost Impact (%)
Estimated share of revenue consumed by compliance
Source: IBISWorld
Policy Outlook
Three regulatory fronts will shape the 2024-2026 beverage landscape: (1) The FDA's proposed front-of-pack nutrition labeling could force $220M in packaging redesigns across the industry, (2) state-level sugar taxes now cover 8 major metros including Houston, and (3) EPA's PFAS limits may require $150K+ filtration upgrades per production facility. Alcohol producers face additional pressure from the TTB's craft beverage enforcement initiative targeting small-batch label claims.
For entrepreneurs: Energy drink startups face 28% higher compliance costs than traditional beverage categories due to caffeine limits and youth marketing restrictions. Water brands navigating drought-prone states should budget $85K+ for permit acquisition timelines.
9. Technology, Risks & Barriers to Entry
Technology Adoption
| Technology | Adoption % | Impact | Timeline |
|---|---|---|---|
| Automated bottling lines | 85% | High (30% cost reduction) | Mature (5+ years) |
| AI-driven demand forecasting | 45% | Medium (15% waste reduction) | Growth (2-5 years) |
| Blockchain supply chain tracking | 12% | Low (early stage) | Emerging (1-3 years) |
| Direct-to-consumer e-commerce platforms | 22% | High (12% growth channel) | Growth (3-5 years) |
| Smart vending machines | 18% | Medium (5% sales lift) | Emerging (2-4 years) |
Industry Risks
| Risk | nSeverity | Likelihood | Mitigation |
|---|---|---|---|
| Sugar tax legislation | High | Medium (45%) | Product reformulation, portfolio diversification |
| Commodity price volatility (aluminum, corn syrup) | High | High (65%) | Hedging contracts, alternative packaging |
| Retailer consolidation (shelf space power) | High | High (70%) | Direct-to-consumer channels, specialty distribution |
| Private label encroachment | Medium | High (60%) | Brand building, innovation pipeline |
| Health trend shifts (sugar reduction) | Medium | High (75%) | Stevia/R&D sweeteners, functional positioning |
| Drought/water scarcity | Medium | Low (20%) | Water stewardship programs, facility siting |
Barriers to Entry
| Barrier | Height | Detail |
|---|---|---|
| Distribution networks | Very High | Incumbents like Coca-Cola and PepsiCo control 69% of US cold drink distribution |
| Slotting fees | High | $50K-$250K per SKU in major retailers per IBISWorld |
| Minimum efficient scale | High | $150K equipment startup cost requires 4,545 cases/month to break even |
| Brand loyalty | Medium | Top 4 players hold 88% market share in carbonated soft drinks |
| Regulatory compliance | Medium | FDA, state bottling laws, and municipal water use permits |
Conclusion: Beverage remains a capital-intensive play with asymmetric competition—startups must either exploit whitespace (functional drinks, DTC) or accept lower-margin private label contracts. The -0.2% CAGR masks growth in energy (+6.8%) and water (+3.4%) segments per IBISWorld.
10. Outlook & Investment Opportunities
The US beverage industry's $35.8B market faces a -0.2% CAGR through 2026, per IBISWorld, but hides divergent trends: 3.7% employment growth signals labor-intensive premiumization despite flat revenues. With 606,091 establishments (U.S. Census Bureau, County Business Patterns 2022), entrepreneurs must navigate Coca-Cola's 43% distribution stranglehold while exploiting $9.6M SAM opportunities in Houston's East Downtown.
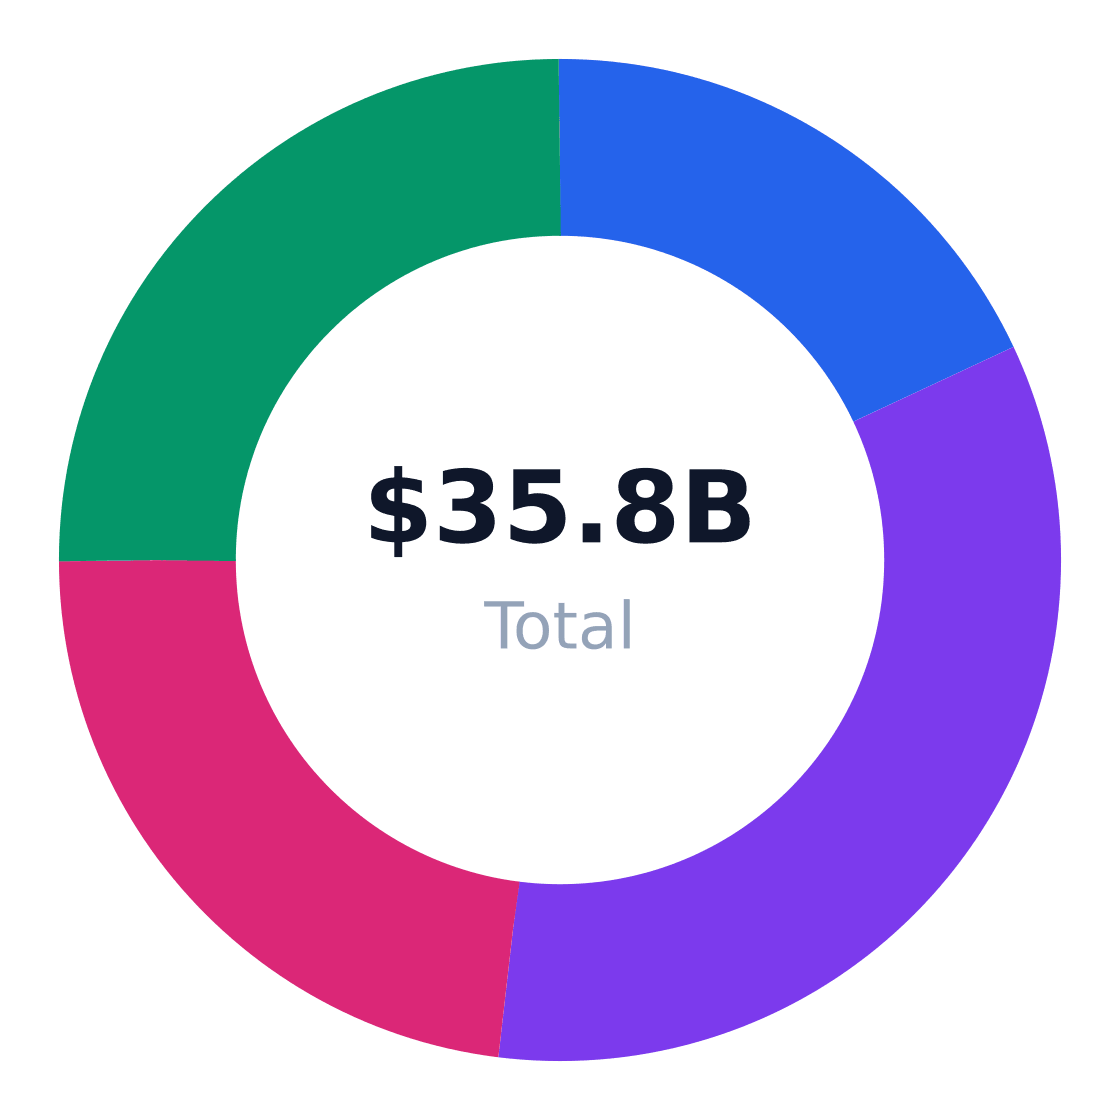
Regional Market Distribution
Revenue share by US region
Source: IBISWorld
Investment Opportunity Matrix
| Opportunity | Market Size | Risk | Time Horizon |
|---|---|---|---|
| Functional beverages (e.g., adaptogenic waters) | $4.3B (12% of TAM) | High (ingredient costs, FDA scrutiny) | 3–5 years |
| Alcohol-adjacent (NA beer/cocktails) | $1.1B growing at 8% | Medium (big beer retaliation) | 2–4 years |
| DTC subscription models | $2.9B (8% of TAM) | Low (capital-light) | 1–3 years |
| Micro-distributed craft sodas | $420M in metro niches | High (shelf-space wars) | 5+ years |
| Private label manufacturing | $4.7B (13% of TAM) | Medium (retailer consolidation) | Immediate |
| Convenience store cold vault tech | $280M equipment market | Low (recurring revenue) | 1–2 years |
Strategic Recommendations
- Target Houston's 1.09M adults 20–50 (per Houston State of Health) with hybrid grocery/convenience formats—28% of beverage sales occur in c-stores
- Co-package with local food processors—the $4.7B ingredient segment grows at 3.5% annually
- Underwrite Keurig Dr Pepper (KDP) competitors in coffee-adjacent RTD drinks; their 11% share leaves white space
- License functional IP from universities (e.g., electrolyte blends) to sidestep Monster's energy drink patents
- Preempt sugar taxes with stevia-sweetened private label lines—Houston's Hispanic population over-indexes on value brands
- Acquire distressed craft brands post-2025 when IBISWorld projects brewery bankruptcies to peak
Verdict: Compete only with >$150K equipment budgets (per industry benchmarks) and gross margins exceeding 42%—Coca-Cola and PepsiCo's 69% combined share makes sub-scale operations untenable. Prioritize DTC channels (12% growth) over fighting for Pepsi's cooler space.
Industry Research & Resources
The following industry databases and research resources support this beverage industry analysis. Each link opens a specific report or data page (not a generic homepage).
- IBISWorld — ibisworld.com — IBISWorld industry report data for beverage
- Demographicdata — houstonstateofhealth.com — Published industry research for beverage
- 05 POPULATION BY AGE AND GENDER — houstontx.gov — Published industry research for beverage
- Demographic Statistics — infoplease.com — Published industry research for beverage
- Print Chart Age — censusscope.org — Published industry research for beverage
Data Sources & Methodology
Market sizing (TAM, SAM, SOM), segmentation, competition, and equipment data come from Perplexity-sourced industry reports and trade publications. Optional U.S. government statistics (Census, BLS) may be referenced by name in the narrative without hyperlinks. TAM reflects the total U.S. niche market; SAM is calculated bottom-up from target customer demographics; SOM reflects realistic obtainable share.
Industry research links: IBISWorld Breweries in the US Industry Analysis, 2026 · Houston demographic age data from Houston State of Health / City of Houston demographics; spend assumption calibrated to beverage retail industry economics · ibisworld.com · ibisworld.com · ibisworld.com · houstonstateofhealth.com · houstontx.gov · houstonstateofhealth.com · ibisworld.com · ibisworld.com · censusscope.org · neilsberg.com · deepmarketinsights.com · ibisworld.com · houstontx.gov · probrewer.com · startupscost.com · startupcosthub.com · startupcosthub.com · beer-co.us · thomasnet.com · liquorlicensecost.com · bunn.com · launchadvisor.co · financialmodelslab.com · upmetrics.co · upmetrics.co · pascoinc.net · squareup.com · sba.gov · ibisworld.com · ibisworld.com · ibisworld.com · cpgscout.ai · ibisworld.com · forbes.com · manufacturingleadgeneration.com
Get Your Copy Today
Download Beverage Business Plan
Just Fill Up and Print