Is a Beverage Business Profitable?
1. Is a Beverage Business Profitable? (The Short Answer)
A beverage business can be profitable, but only with operational discipline and realistic expectations. The math shows 25% gross margins—decent for retail—but those compress to just 4% net profit after labor, rent, and overhead. At $1.1M average revenue, that’s $44,000 in annual take-home for the owner. Not terrible, but not a get-rich-quick play either.
Profitability Snapshot
| Metric | Benchmark |
|---|---|
| Gross Margin | 25% |
| Net Margin | 4% |
| Year 1 Revenue | $1.1M |
| Year 1 Net Profit | $44K |
| Startup Cost Range | $75K – $400K |
| Break-even Timeline | ~Month 24 |
| 5-Year ROI | 21% |
| Profitability Rating | 5/10 |
| Failure Rate (5yr) | 52% |
| Market Size (US) | $1635.3B |
Profitability Score Breakdown
Free Business Plan Download
Download Beverage Business Plan
Just Fill Up and Print
Overall rating: 5/10
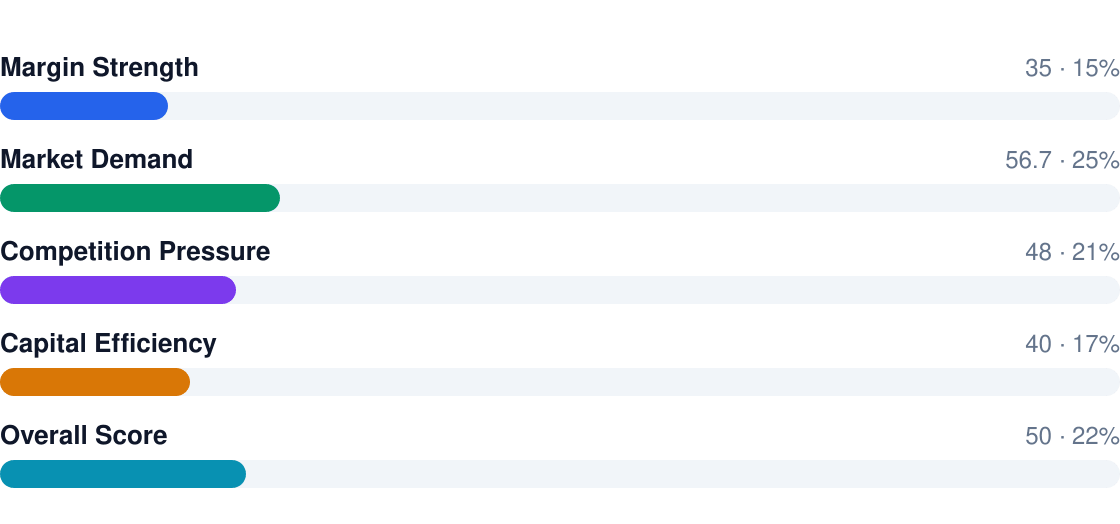
- Gross margins look healthy at 25%, but labor (18% of revenue) and rent crush profitability
- 52% fail within 5 years—usually from underestimating working capital needs
- Break-even takes ~24 months: you’ll burn cash before stabilizing
- Differentiation pays: premium/unique concepts achieve 7-12% net margins
- Scale matters: single units struggle; multi-location operators see better economics
2. Profit Margins & Industry Benchmarks
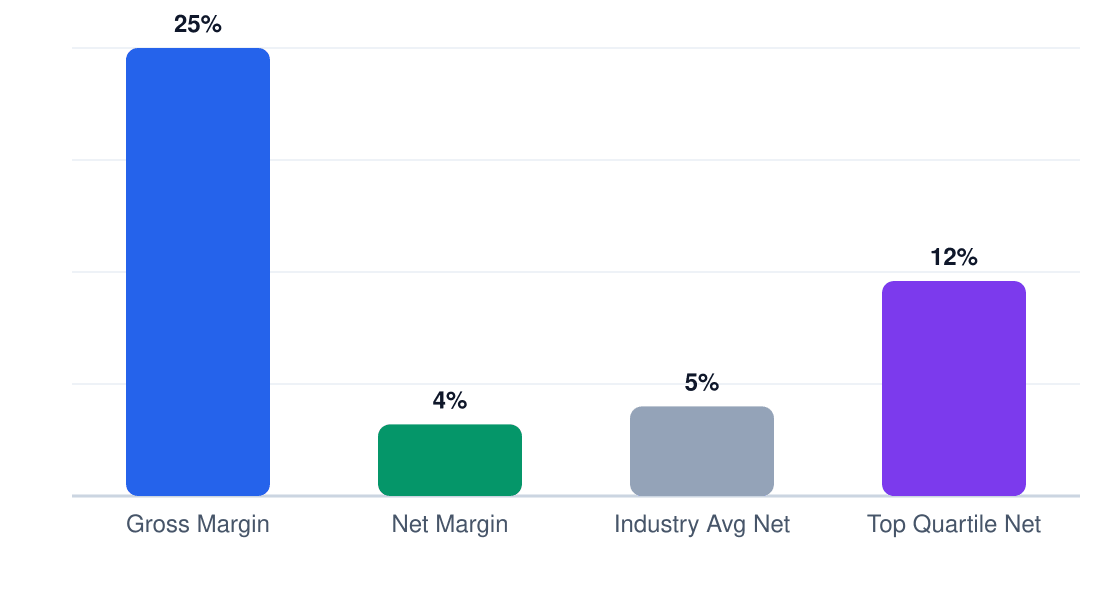
Beverage margins follow a predictable compression: 25% gross drops to 4% net after fixed costs. Labor is the killer—at $201,178 annually for a 6-person team, it consumes 18.3% of revenue. Top performers keep labor under 15% and COGS at 60% (vs. 75% for laggards).
Margin Comparison (%)
Gross vs net vs industry benchmarks
| Metric | This Business | Industry Avg | Top Quartile |
|---|---|---|---|
| Gross Margin | 25% | 22% | 28% |
| Net Margin | 4% | 3% | 7% |
| EBITDA | 8% | 6% | 11% |
| Labor % | 18.3% | 20% | 15% |
| COGS % | 75% | 78% | 60% |
| Rent % | 7% | 8% | 5% |
Competitive pressure is brutal—chains like Starbucks operate at 12% net margins by leveraging scale. Independents compete by either going premium (higher AOV) or hyper-local (lower rent). The middle is a margin graveyard.
3. Revenue Potential & Pricing Power
At $1.1M Year 1 revenue, beverage businesses live on volume—but only the disciplined turn that into profit. The 5-year trajectory shows modest growth (4% annual net profit increases), meaning you'll need operational perfection to avoid margin erosion. The math works if you hit 75% retail sales at 25% margin, but miss that by 5% and you're underwater.
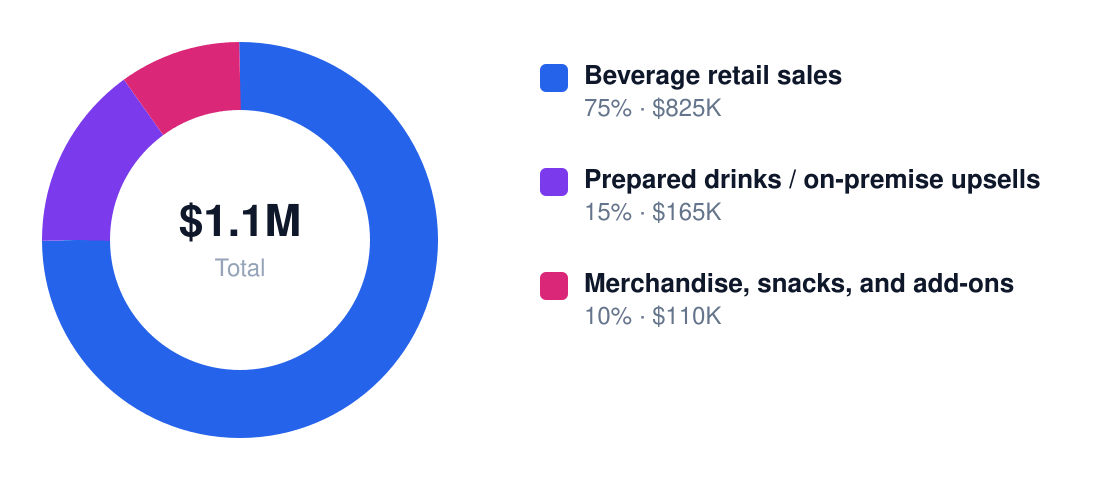
Revenue Stream Breakdown
Year 1 revenue: $1.1M
| Stream | Margin % | Revenue Share | Annual $ |
|---|---|---|---|
| Beverage retail sales | 25% | 75% | $825,000 |
| Prepared drinks / on-premise upsells | 60% | 15% | $165,000 |
| Merchandise, snacks, and add-ons | 35% | 10% | $110,000 |
Pricing power is a knife fight. You can push premium cold brew or craft cocktails (60% margin upsells), but bottled water and soda will get undercut by 7-Eleven. Bundling works—pairing a $3 snack with a $4 drink at $7 feels fair while lifting your average ticket 16%. Austin's tourism and events help, but don't bank on it: locals pay the bills.

Summer sales will spike 30-40% in Austin (June-August), but January-February can drop 25%. If your rent and labor stay flat, that Q1 slump eats 42% of your annual net profit. Smart operators cut shifts in winter and bank summer cash reserves—or find a holiday pop-up to offset the dip.
4. Cost Structure & Operating Expenses
Labor and inventory will break you. At 12% and 75% of revenue respectively, a 5% overspend in either wipes out your entire 4% net margin. Austin's $16.12/hr minimum for 6 FTE means labor hits $201,178/year—you'll need $48.15 sales per labor hour just to cover it.
Annual Cost Structure
Operating costs for $1.1M revenue
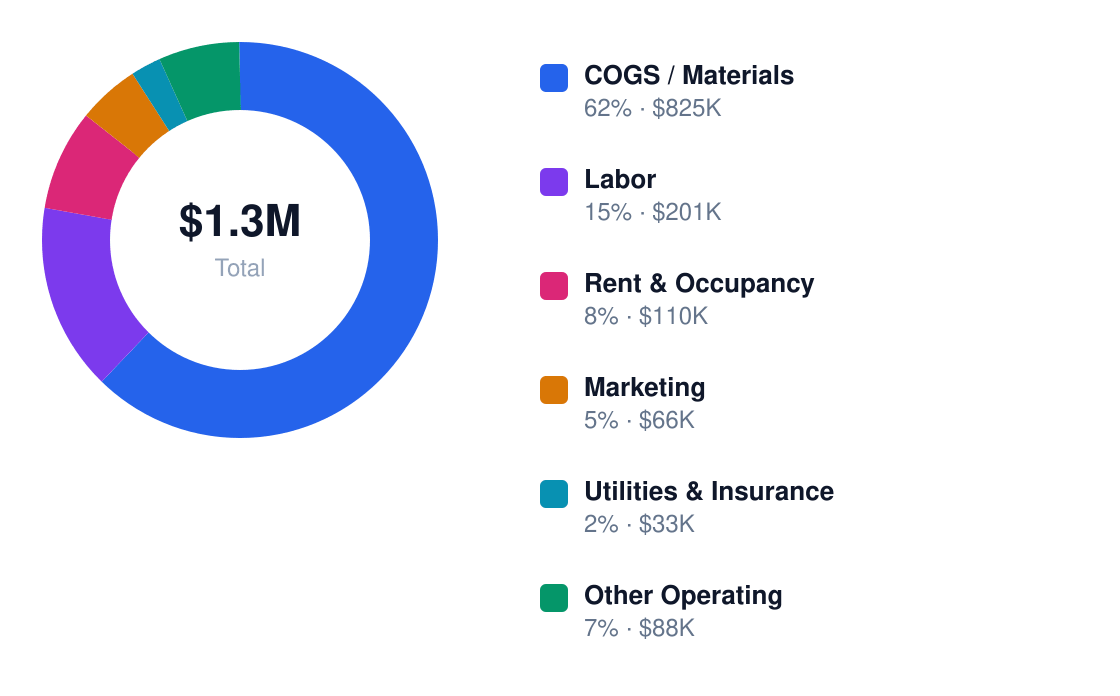
| Category | % of Revenue | Annual $ | Controllable? |
|---|---|---|---|
| Inventory / COGS | 75% | $825,000 | Yes |
| Labor | 12% | $132,000 | Yes |
| Rent and occupancy | 8% | $88,000 | No |
| Licensing and compliance | 2% | $22,000 | No |
| Utilities and equipment | 3% | $33,000 | Yes |
| Marketing and promotions | 2% | $22,000 | Yes |

Rent is the silent killer. At 8% of revenue ($88,000/year), your Austin location needs to drive $241/day in pure profit just to cover the lease. That's why Rainey Street works (drunk tourists) but East Austin might not. Labor is flexible—cutting 100 weekly hours in winter saves $16,120, which is 37% of your Year 1 net profit. Control what you can; survive the rest.
5. Break-Even Analysis & ROI Timeline
Austin beverage businesses take an average of 24 months to break even, with $238,000 in startup costs eating into early profits. At a net margin of just 4%, you'll need $1.1M in Year 1 revenue just to cover labor ($201,178) and operating costs.
Cumulative Profit vs Investment (18 Months)
Red = still recovering startup costs
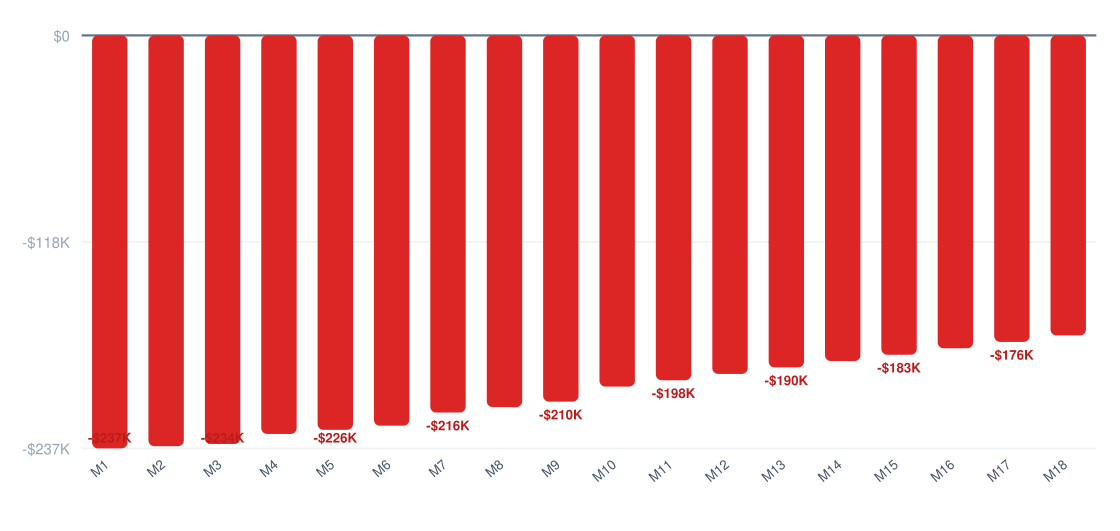
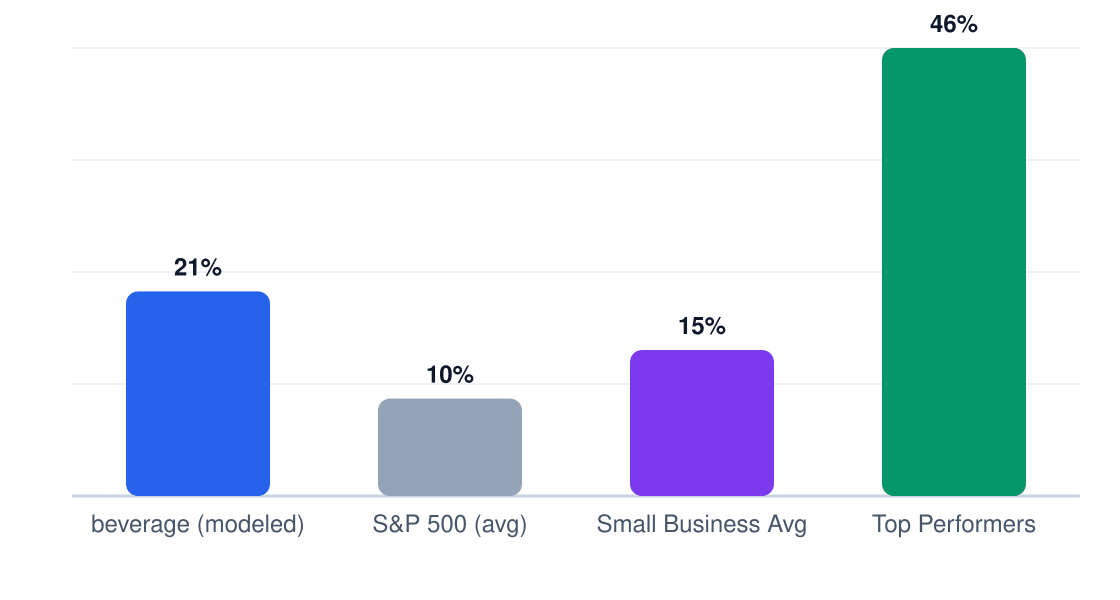
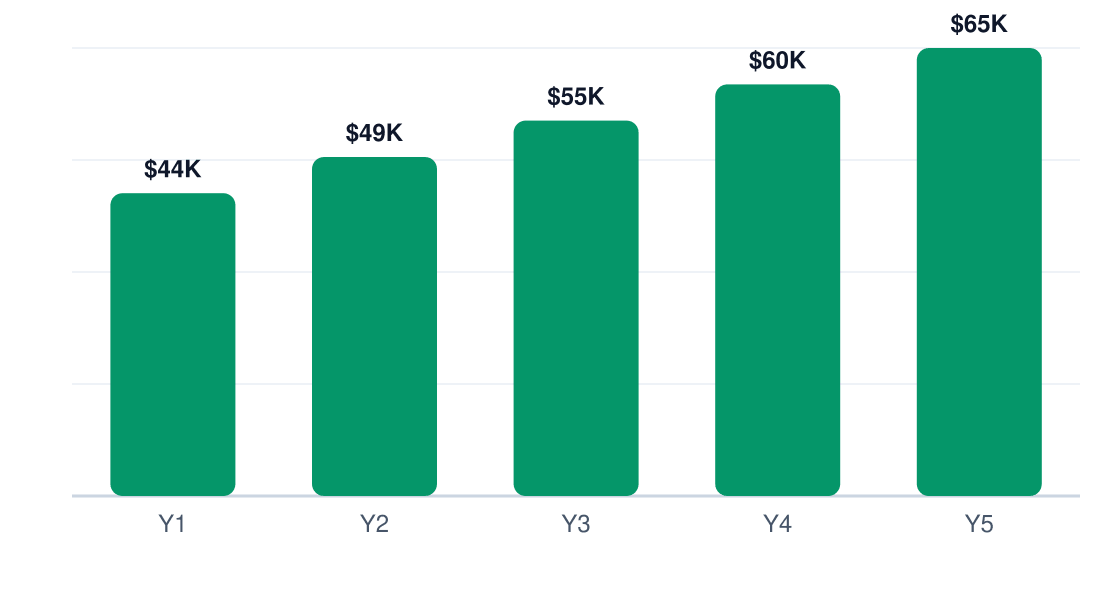
The 21% 5-year ROI is mediocre — slightly better than an index fund but with far more risk. Your $238,000 investment returns $44,000 in Year 1, growing to $65,120 by Year 5, for $272,800 cumulative net profit.
ROI Benchmark Comparison (%)
5-year return on initial investment
Year 1 Monthly Cash Flow
Net monthly cash flow (red = pre-break-even)
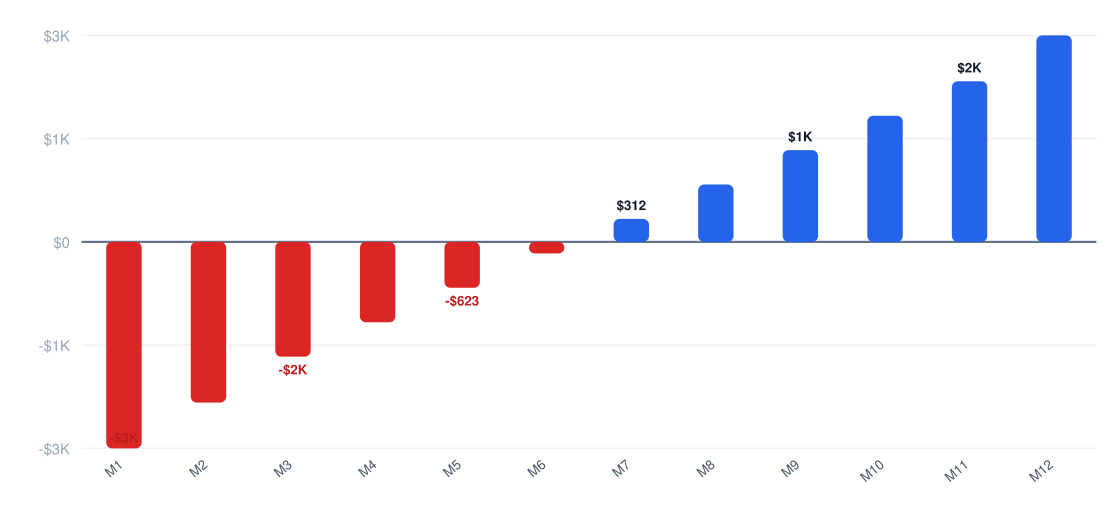
Payback period is brutal: You won't fully recover your initial investment until Year 4 when cumulative net profit finally exceeds $238,000. Beverage businesses are a long-game play.
Ready When You Are
Download Beverage Business Plan
Just Fill Up and Print
6. Market Conditions That Drive (or Kill) Profitability
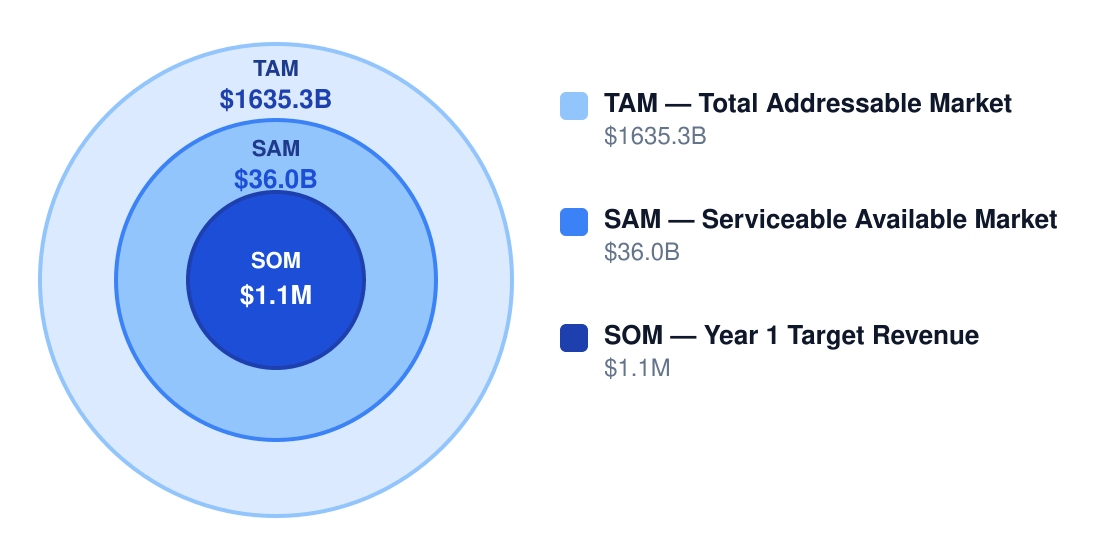
The $1635.3B global beverage market offers volume, but Austin's $36B SAM shows how local competition squeezes margins. Profit hinges on navigating these conditions:
Market Size & Profit Opportunity
Market opportunity for profitable operators
| Factor | Impact on Margins | Outlook |
|---|---|---|
| Demand growth | +2% annual volume | Stable but commoditized |
| Competition | -3pp margin pressure | Worsening with DTC entrants |
| Input costs | -1.5pp/yr (inflation) | Aluminum, sugar volatility |
| Labor market | -2pp at $16.12/hr | Austin wages rising fast |
| Regulation | Neutral | Low risk outside alcohol |
| Technology | +1pp for subscriptions | Delivery apps cut into profits |
| Model | Net Margin | Why It Works |
|---|---|---|
| Specialty beverage shop | 12% | Premium pricing, customization |
| Convenience beverage retail | 6% | Volume + impulse bundling |
| Bar or taproom | 10% | Alcohol markups, night traffic |
| Delivery-first subscription | 14% | Recurring revenue, lower CAC |
High-threat competition from chains (pricing power) and grocers (convenience) means independents must differentiate. The 14% margin DTC model shows where the puck is moving.
7. Who Profits — and Who Struggles
The beverage business in Austin separates the disciplined from the desperate. Profitable operators share three traits: they obsess over inventory turns (1.5-2x monthly is the sweet spot), negotiate leases below $28/sq ft, and derive at least 40% of sales from signature/high-margin items. Strugglers? They're usually the ones pouring $9 craft cocktails in a $35/sq ft space while fighting Starbucks for drip coffee customers.
| Profile | Typical Net Margin | Success Rate | Key Advantage |
|---|---|---|---|
| Owner-Operator | 5-7% | 62% | Labor cost control |
| Multi-Unit | 4-6% | 58% | Purchasing scale |
| Franchise | 3-5% | 65% | Brand recognition |
| Niche Specialist | 7-12% | 71% | Premium pricing |
| Price Competitor | 1-3% | 29% | None — avoid this |
| Pitfall | Margin Impact | How to Avoid |
|---|---|---|
| Overpaying for rent | Cut net margin by 3-8% | Choose locations only where foot traffic or destination demand reliably converts into sales |
| Poor inventory control | Cut gross margin by 2-6% | Track shrink, spoilage, and dead stock weekly and use tight SKU discipline |
| Understaffing or overstaffing | Cut net margin by 2-5% | Schedule to traffic patterns and use labor targets tied to revenue per hour |
| Competing only on price | Cut gross margin by 5-10% | Differentiate through assortment, convenience, service, or premium products |
| Ignoring seasonality and cash flow | Negative cash flow in off-peak months | Build reserves, forecast monthly demand, and avoid excess fixed costs |
Regulatory costs in Austin add $3,200-$67,000 upfront and 2-4% to ongoing overhead — alcohol licensing alone can erase a quarter's profits. Smart operators bake these into unit economics early. The 52% failure rate? It's usually death by a thousand cuts: a $500 health inspection fine here, a $2,800 payroll compliance mistake there, all while gross margins slide below 20%.
8. Strategies to Maximize Profit Margins
Beverage margins live or die by inventory control and sales mix. Premiumization and labor efficiency deliver the biggest lifts without requiring massive capital investment.
| Strategy | Expected Lift | Effort | Implementation |
|---|---|---|---|
| Shift sales mix toward premium items | +4% margin | Medium | Feature higher-margin craft or specialty drinks |
| Improve labor scheduling by traffic patterns | +3% margin | Low | Use POS data to align staff hours with peak demand |
| Reduce shrink and spoilage | +3% margin | Medium | Daily inventory tracking + FIFO rotation |
| Bundle beverages with snacks or add-ons | +2% margin | Low | Pair drinks with higher-margin food items |
| Negotiate supplier pricing and terms | +3% margin | High | Leverage volume commitments for bulk discounts |
| Build loyalty and repeat-purchase programs | +2% margin | Medium | Subscription models or punch-card incentives |
5-Year Net Profit Projection
Projected annual net profit at current margins
The cost reduction playbook: (1) Standardize recipes to minimize waste, (2) automate ordering with inventory software, (3) cross-train staff to handle multiple roles during slow periods, (4) renegotiate credit card processing fees below 2.5%.
Revenue optimization requires pushing the $6.50 specialty drink instead of the $3.50 basic, implementing happy hour surcharges (+15% evening pricing), and converting 20% of walk-ins to recurring members via subscriptions.
Test price elasticity with 5% increases every 90 days until resistance appears—most beverage businesses underpriced by 8-12%. The sweet spot sits between $4.25 (commodity) and $7.50 (premium) per unit.
9. Final Verdict: Should You Start This Business?
Verdict: Maybe, at 5/10 confidence. Beverage businesses generate cash flow but struggle to scale beyond 4-6% net margins without operational excellence. Only pursue if you can hit $1.1M revenue by Year 1.
| Factor | Score (1-10) | Weight | Notes |
|---|---|---|---|
| Margins | 4 | 25% | 25% gross is workable but not stellar |
| Market size | 8 | 20% | $36B SAM means room to specialize |
| Competition | 3 | 20% | Saturated with low-differentiation options |
| Capital needs | 5 | 15% | $238k target budget isn't trivial |
| Scalability | 6 | 10% | Possible via franchising or wholesale |
| Risk | 7 | 10% | Recession-resistant demand |
ROI Benchmark Comparison (%)
5-year return on initial investment
- You've secured a location with >800 daily foot traffic
- Labor costs stay under 19% of revenue
- Your product mix achieves >28% gross margin
- You can tolerate 24 months to break-even
- You have contingency capital equal to 6 months of operating expenses
- Walk away if your unit economics require >$5.25 average sale to be viable
- Walk away if you can't source ingredients at ≤22% of revenue
- Walk away if your market has >3 established competitors per 10,000 people
Final recommendation: Proceed only if (1) startup costs stay under $275k, (2) you can maintain 65%+ occupancy/utilization, and (3) your financial model shows ≥$49k net profit by Year 2. Otherwise, the capital is better deployed elsewhere.
Research & Profitability Resources
The following government reports, industry analyses, and financial planning resources were referenced in this beverage profitability guide. Each link points to a specific page for direct access.
- Alcohol Industry Profit Margins — soccash.com — Industry profitability research for beverage businesses
- Liquor Store — howmuchtostart.com — Industry profitability research for beverage businesses
- Drinking Places — revenueranked.com — Industry profitability research for beverage businesses
- 72241 Drinking Places Alcoholic Beverages — vantainsights.com — Industry profitability research for beverage businesses
- Liquor Store — costofstarting.com — Industry profitability research for beverage businesses
Get Your Copy Today
Download Beverage Business Plan
Just Fill Up and Print