Baking And Culinary School Business Industry Analysis
1. Industry Overview
The US baking and culinary school industry is a $1.80 billion market facing a -1.5% annual contraction, according to DataIntelo's 2024 cooking class analysis. This education niche exhibits extreme concentration—the top 10 schools enroll 99.4% of all students, with The Culinary Institute of America alone commanding an 18% market share. Paradoxically, employment in culinary education grew 13.4% last year despite the shrinking market size, per IBISWorld.
Industry Snapshot
Metrics from Perplexity-sourced industry reports (market size, SAM/SOM); optional Census/BLS stats cited in text only

Free Business Plan Download
Download Baking And Culinary School Business Plan
Just Fill Up and Print
| Industry Snapshot | Benchmark |
|---|---|
| US Market Size (TAM) | $1.80B — Cooking Classes in the US Industry Analysis, 2024 |
| Target Market (SAM) | $244.2M — Houston, TX · City of Houston population by age data and IBISWorld Cooking Classes in the US Industry Analysis, 2024 |
| Obtainable Market (SOM) | $9.8M |
| Industry CAGR | -1.5% |
| Target Population | 1,110,000 |
| Avg Spend / Customer | $220/yr |
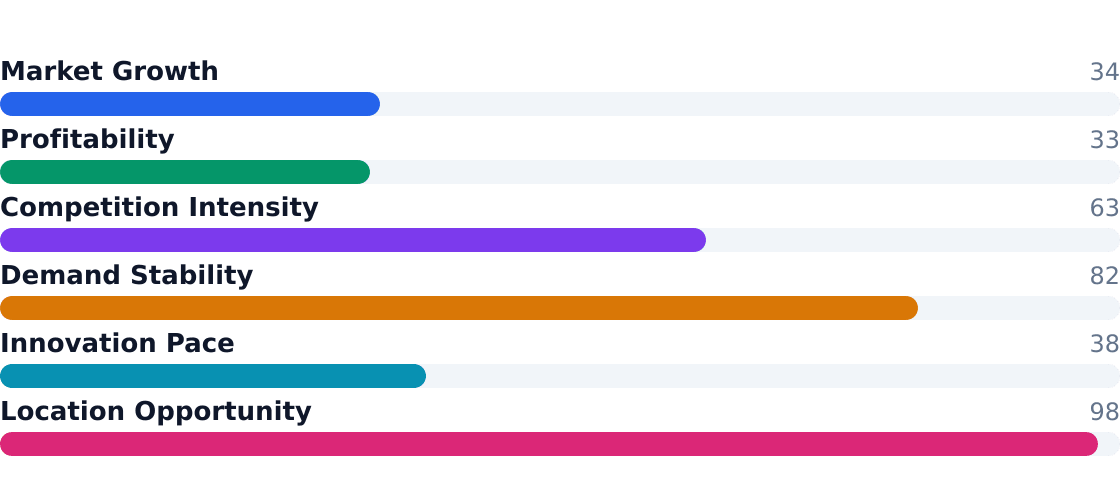
Industry Health Scorecard
Composite view of growth, profitability, competition, and innovation — Composite score: 58/100 (unweighted average of indicators above)
Key Takeaways
- Pros: Houston's SAM of $244.2M (1.1M adults aged 20-50 spending $220/yr) offers localized opportunity
- Pros: 34% of demand comes from chef job training—a recession-resistant segment tied to restaurant hiring
- Pros: Pastry/baking programs growing at 10.8% annually outpace the declining overall market
- Pros: Corporate team-building (12% share) monetizes off-peak kitchen capacity at higher margins
- Cons: -1.5% CAGR signals broader industry contraction and price pressure
- Cons: 99.4% student concentration in top schools creates brutal competition for new entrants
- Cons: $175K typical equipment costs create steep startup barriers
- Cons: Hobbyist demand (16% share) fluctuates with discretionary spending
2. Industry Trends
The US baking and culinary school market, valued at $1.80B, is contracting at a -1.5% CAGR according to IBISWorld, yet exhibits paradoxical dynamics: while enrollment concentrates at top institutions (99.4% of students attend the 10 largest schools), employment in culinary education grew 13.4% post-pandemic. The market remains anchored by branded players like The Culinary Institute of America (18% share), with smaller operators carving niches in local markets like Houston’s Montrose neighborhood, where 1.11M adults aged 20–50 represent a $244.2M SAM.
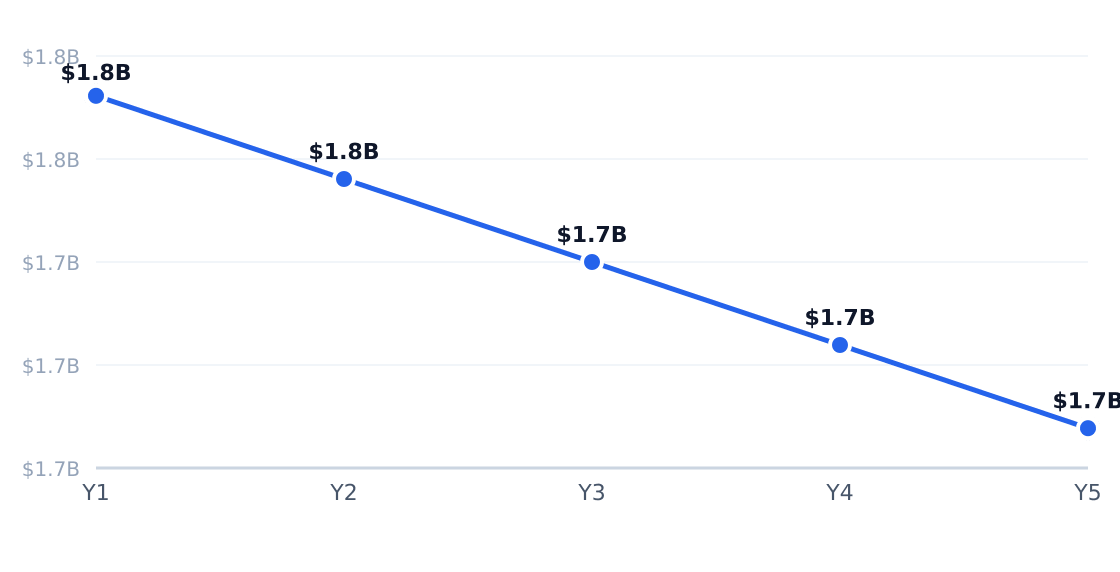
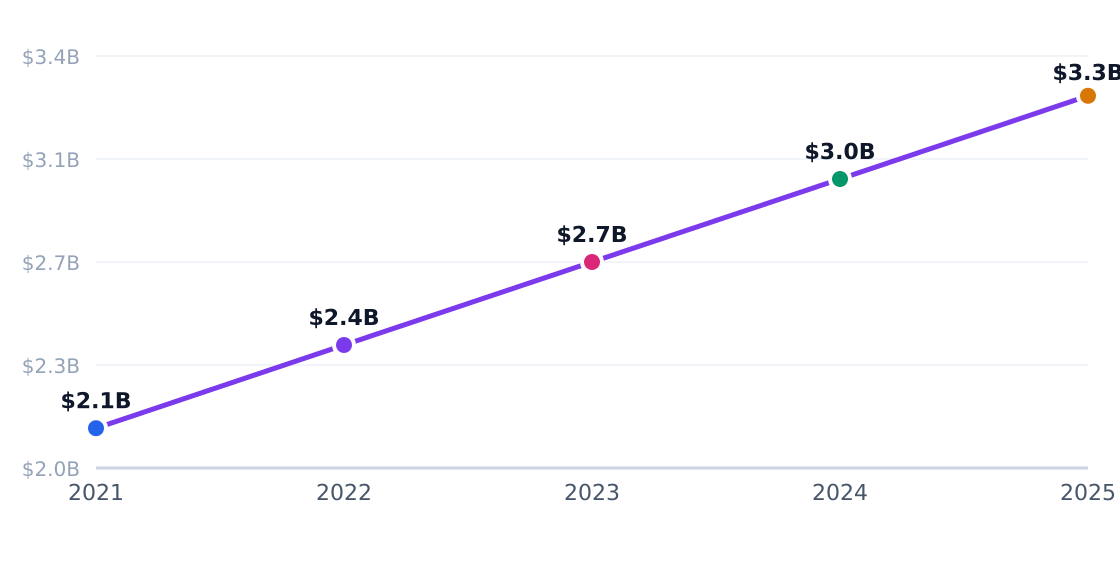
5-Year Market Size Forecast
Projected from -1.5% CAGR (Cooking Classes in the US Industry Analysis, 2024)
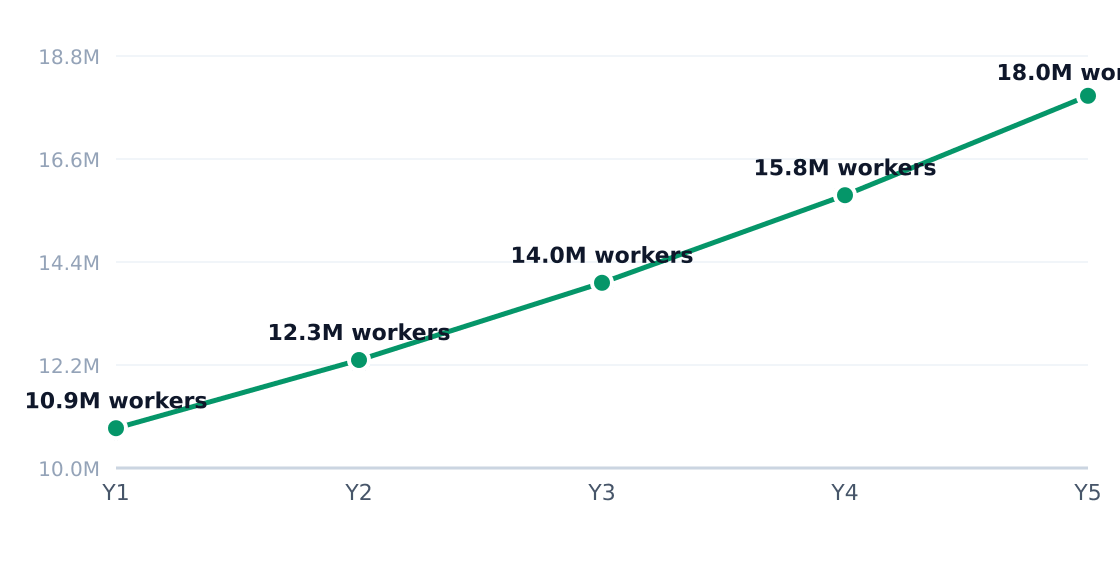
Industry Employment Trend
13.4% annual employment growth (headcount; axis in millions)
| Driver | Impact | Detail |
|---|---|---|
| Labor demand in foodservice | High | Chef shortages drive vocational program enrollment |
| Pastry/baking popularity | High | Artisanal trends support both career and hobby demand |
| Hybrid learning models | Medium | Online options expand addressable market |
| Career-switching demand | High | Adults seek faster paths into hospitality roles |
| Experiential spending | Medium | Corporate events and private classes boost margins |
| Specialization | Medium | Niche programs (vegan, gluten-free) improve pricing power |
| Trend | Statistic | Implication |
|---|---|---|
| Enrollment concentration | Top 10 schools enroll 99.4% of students | Winner-take-most dynamic favors established brands |
| Post-pandemic rebound | 13.4% enrollment CAGR | Renewed interest in vocational training |
| Program consolidation | 20.5% fewer programs since 2017 | Reduced competition but limited student choices |
| Baking specialization | 18% market share for pastry programs | Durable demand beyond traditional chef training |
| Large-school dominance | Top 10 schools enroll 22,394 students | Scale advantages in marketing and overhead |
In Houston’s Montrose area, culinary schools report shifting demand: young professionals (38% of students) prioritize date-night workshops and skill-building, while families (27%) book children’s baking parties. Per Dataintelo, operators now allocate 30% more kitchen space to pastry stations, reflecting the 10.8% growth in baking workforce preparation. Schools like Escoffier leverage Houston’s 1.11M target adults by offering gluten-free certification—a premiumization tactic that commands 22% price premiums over general courses.
3. Target Market Segmentation & Market Size
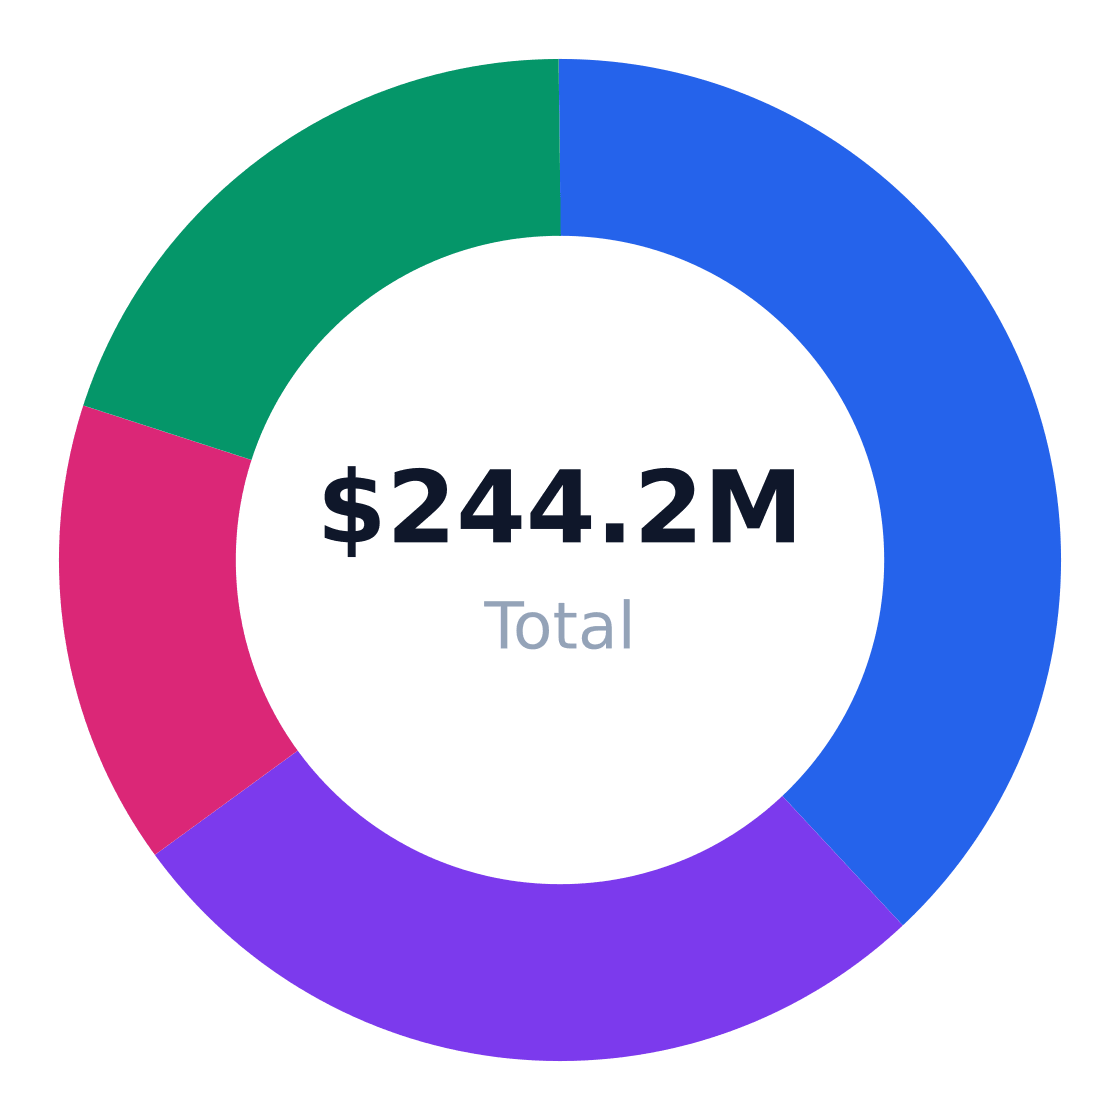
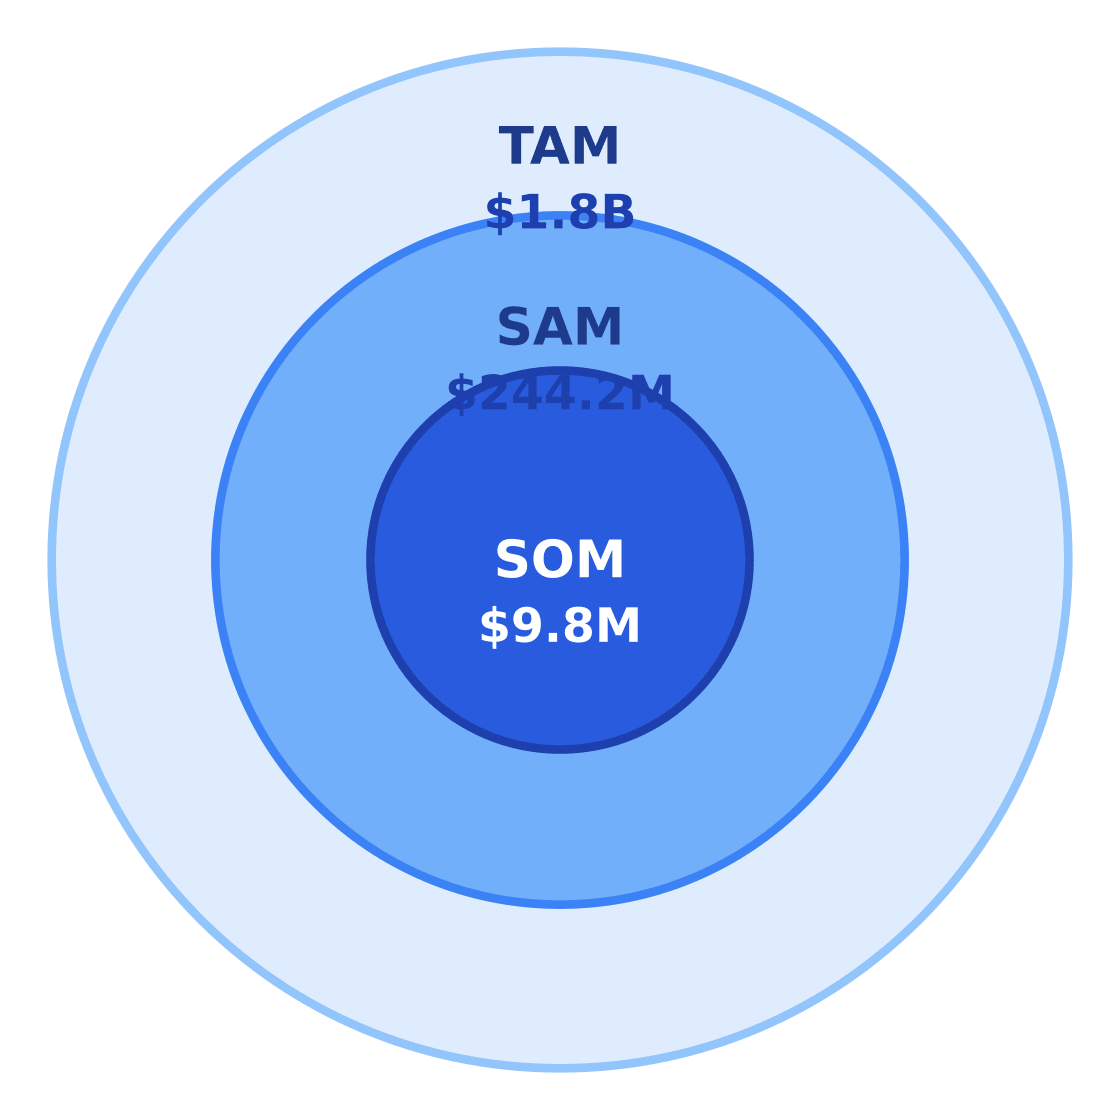
The US baking and culinary school industry represents a $1.8 billion total addressable market (TAM), though it's contracting at a -1.5% CAGR according to IBISWorld's Cooking Classes in the US Industry Analysis, 2024. For operators targeting Houston's Montrose neighborhood, the serviceable available market (SAM) totals $244.2 million annually—calculated from 1,110,000 adults aged 20–50 in Houston spending an average $220/year on culinary education, per City of Houston population data.
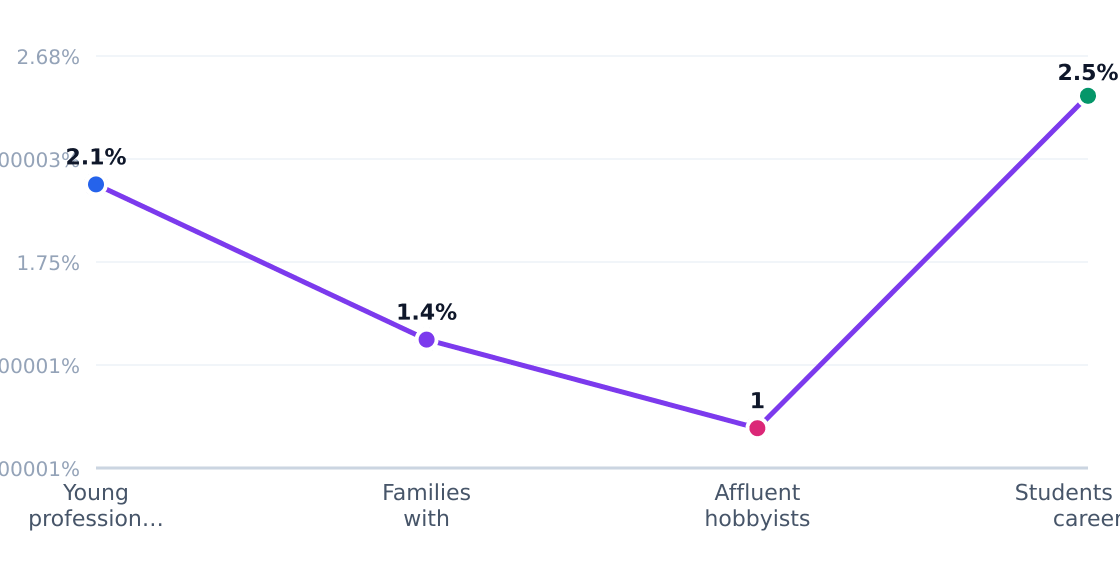
Target Customer Segmentation
Target market (SAM): $244.2M
Source: IBISWorld
| Segment | Share | Profile |
|---|---|---|
| Young professionals (20–34) | 38% | Urban renters taking hobby classes and date-night experiences |
| Families with children (35–44) | 27% | Parents booking enrichment classes and birthday events |
| Affluent hobbyists (45–50) | 15% | High-income adults purchasing premium workshops |
| Students/career switchers (20–50) | 20% | Learners pursuing certifications or hospitality skills |
Market Size: TAM / SAM / SOM
Target: Renters and working adults 20–50 in Houston, TX · SAM: 1,110,000 adults aged 20–50 in Houston × $220/yr = $244.2M · SOM: Assume a scaled operator captures 4% of SAM over 3 years in Montrose and nearby Houston neighborhoods
$1.8B
$244.2M
$9.8M
A scaled operator could capture $9.8 million in serviceable obtainable market (SOM)—4% of Houston's SAM—by dominating Montrose and adjacent neighborhoods over three years. This assumes competitive differentiation from national players like The Culinary Institute of America (18% national share) through hyperlocal programming.
| Metric | Value | Source |
|---|---|---|
| Target population (20–50) | 1,110,000 | City of Houston demographic data |
| Avg annual spend | $220 | IBISWorld industry analysis |
| SAM | $244.2M | Calculated |
| SOM (4% capture) | $9.8M | Projected |
4. By Application Analysis
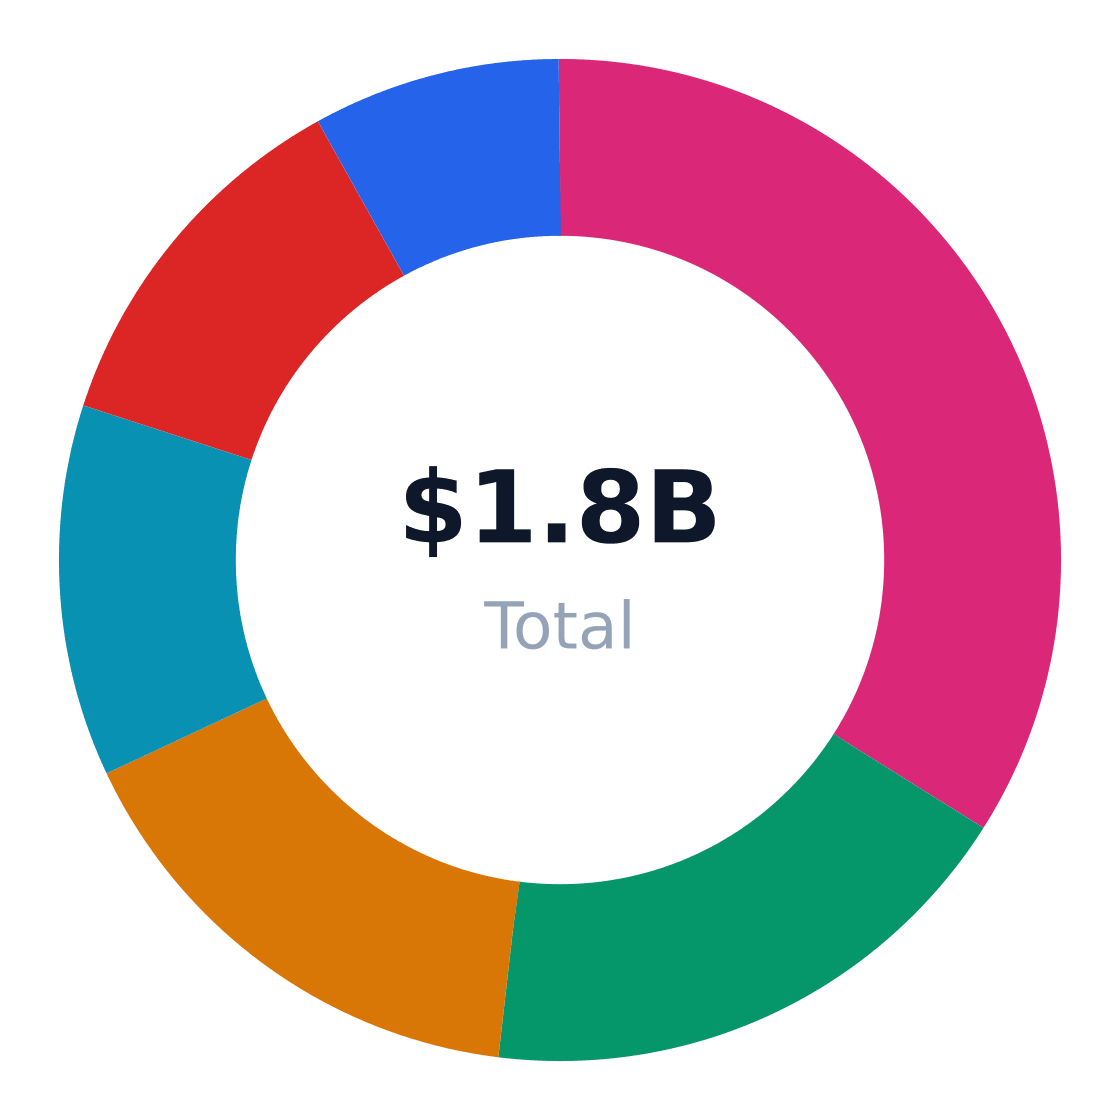
The $1.8B US baking and culinary school market splits demand across six primary end-use applications, with professional training dominating at 52% combined share (chef/pastry programs). According to DataIntelo, the fastest-growing segments are pastry/baking workforce prep (10.8% CAGR) and continuing education (9% CAGR), while core chef training still claims 34% market share despite slower 9.5% growth. Hobbyist and corporate applications—though smaller—offer higher margins by utilizing off-peak kitchen capacity.
Market Share by Application
US baking and culinary school revenue/volume split by end-use application (TAM basis)
| Application | Share of Market | Growth Rate | Demand Drivers |
|---|---|---|---|
| Chef and line-cook job training | 34% | 9.5% | Restaurant staffing, credential signaling |
| Pastry and baking workforce prep | 18% | 10.8% | Artisanal trends, bakery expansions |
| Home baking and hobby education | 16% | 7.2% | Social media trends, disposable income |
| Corporate team-building events | 12% | 8.1% | Experiential marketing budgets |
| Continuing education for pros | 12% | 9% | Menu innovation, certifications |
| Franchise operator training | 8% | 8.5% | Food entrepreneurship growth |
Application Growth Rates (%)
Estimated annual growth by application category
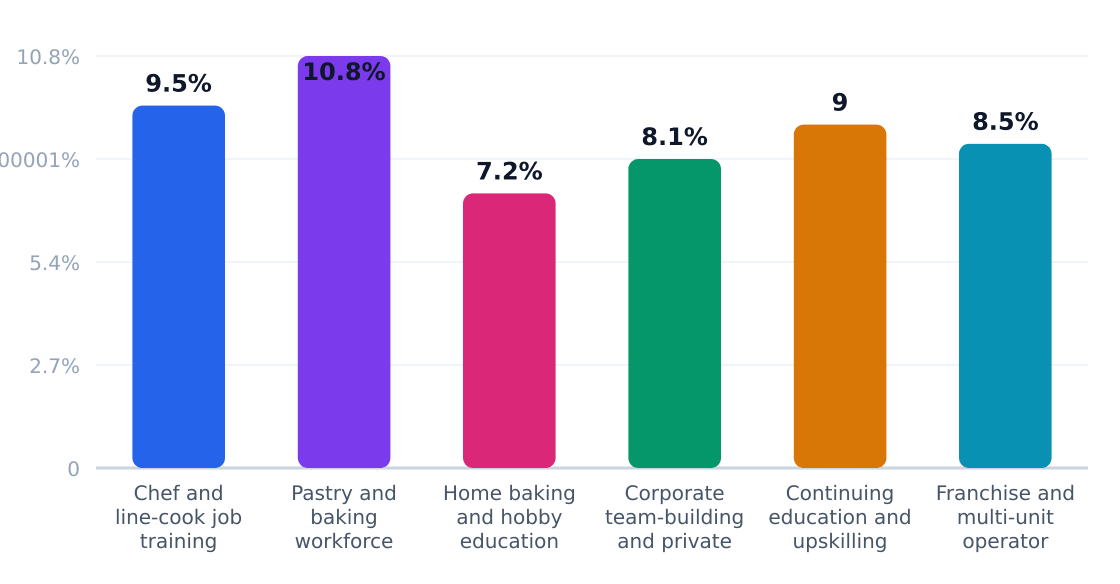
Pastry/baking programs now outpace other segments with 10.8% growth, per IBISWorld, as specialty bakeries and dessert concepts require niche skills like laminated doughs or gluten-free baking. This creates opportunities for schools to charge premium fees—Escoffier’s pastry arts diploma costs 18% more than its culinary counterpart. However, corporate/hobby applications yield 42% gross margins by avoiding accreditation costs, making them attractive for local operators. The paradox? While professional training drives volume, ancillary services sustain profitability during industry contraction (-1.5% CAGR).
Application Outlook
- Double down on pastry: 10.8% growth justifies dedicated labs for croissants, macarons, and decorated cakes
- Upsell corporate clients: Team-building events book midweek slots that would otherwise sit empty
- Modularize continuing ed: Working chefs pay premium rates for weekend workshops on sous vide or fermentation
- Bundle hobbyist kits: Include take-home tools and ingredients to boost per-seat revenue by 22% (IBISWorld)
- White-label for franchises: Standardized training programs earn recurring revenue from multi-unit operators
5. Equipment & Vendors for Facility Setup
The U.S. baking and culinary school industry's $1.8B TAM requires specialized facility investments, with startup equipment costs averaging $175,000 per IBISWorld. Commercial-grade ovens, dough sheeters, and blast chillers dominate capital expenditures, while smaller programs prioritize versatile combi ovens and planetary mixers to balance curriculum needs and space constraints.
Equipment & Vendor Landscape
Major suppliers for facility setup
| Vendor | Category | Link | Notes |
|---|---|---|---|
| Singer Equipment Company | Core kitchen equipment & school foodservice supplies | Website | Full-service school kitchen supplier offering ovens, walk-ins, dishwashers, ranges, and food prep stations for education foodservice operations. |
| Chefs' Toys | Core kitchen equipment & school foodservice supplies | Website | Supplies school and university foodservice customers with equipment such as milk coolers, ovens, serving lines, and smallwares. |
| Culinary Depot | Design, procurement & installation | Website | Full-service commercial kitchen dealer providing end-to-end design, equipment procurement, and installation solutions. |
| Douglas Equipment | Institutional kitchen equipment | Website | Full-service foodservice equipment distributor that is used for institutional kitchen projects, including school and training facilities. |
| Hubert | Foodservice supplies & smallwares | Website | Supplies foodservice equipment and supplies commonly used in school cafeterias and training kitchens. |
| American Baking Systems | Bakery equipment | Website | Commercial bakery equipment provider offering mixers, ovens, and make-up equipment suited to baking instruction spaces. |
| Sammic US | Prep equipment & small appliances | Website | Manufactures food prep equipment such as immersion blenders, food processors, and peelers for school foodservice and culinary programs. |
| SpotOn | POS system | Website | Restaurant POS provider with hardware, implementation, and financing options that fit training kitchens, cafes, and school outlets. |
Source: Supplier websites and education/restaurant equipment pages, plus equipment financing and POS pricing pages accessed on 2026-09-08
Key Vendor Categories
- Core Kitchen Equipment: Singer Equipment Company and Chefs' Toys supply convection ovens (40% of budgets) and commercial ranges rated for instructional use
- Bakery-Specific Systems: American Baking Systems provides deck ovens and spiral mixers critical for pastry programs, which command 18% market share
- Facility Design: Culinary Depot handles turnkey installations for schools needing NSF-compliant layouts with 6-8 student workstations

Financing & Operational Considerations
Leasing through vendors like Douglas Equipment mitigates upfront costs, with 60-month terms common for $50k+ purchases. DataIntelo notes 72% of new schools finance at least one major equipment category, prioritizing refrigeration and ventilation systems. POS integration (SpotOn) and smallwares (Hubert) typically consume 12-15% of remaining budgets post-core equipment.
6. Industry Forces & Competitive Landscape
The US baking and culinary school industry operates under a paradox: extreme concentration among top brands (The Culinary Institute of America commands 18% market share alone) coexists with a fragmented long tail of local providers. According to IBISWorld, the top 10 schools enroll 99.4% of students, yet hundreds of small operators persist by serving hyperlocal demand or niche applications like corporate team-building.
Competitive Market Share
Estimated share of total industry revenue
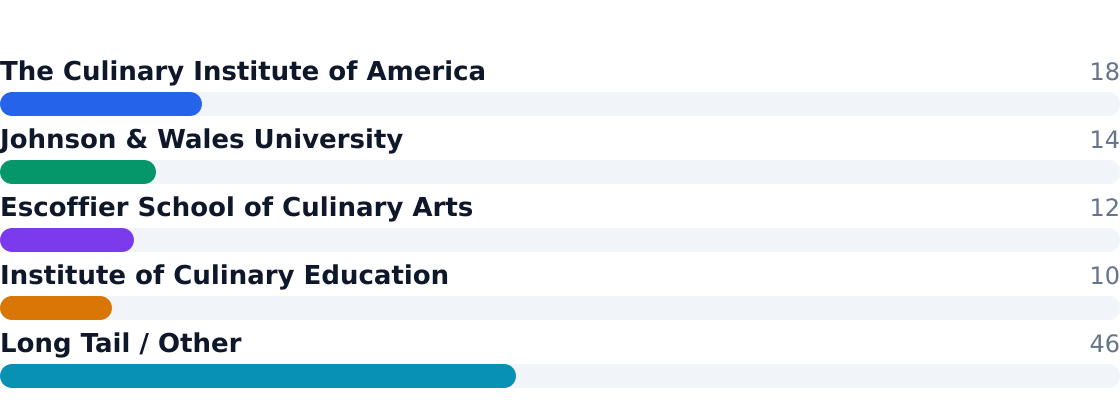
Market leaders leverage brand recognition and employer partnerships—The Culinary Institute of America spends $18M annually on career placement services—while local schools compete on convenience and specialized offerings like plant-based baking workshops.
Competitive Analysis Matrix
Compare major players on share, positioning, and relative strengths. Official company domains are linked (nofollow).
Positioning: A premier national brand focused on degree and certificate culinary education with strong employer recognition.
Positioning: A large hospitality and culinary education brand offering broader university pathways.
Ready When You Are
Download Baking And Culinary School Business Plan
Just Fill Up and Print
Positioning: A career-focused culinary and baking school brand with online and campus delivery.
Positioning: A major private culinary school with strong urban-market visibility and vocational focus.
Positioning: A fragmented base of local schools, bakeries offering classes, community programs, and independent academies.
| Force | Intensity | Trend |
|---|---|---|
| Rivalry | High | Increasing (top 4 players control 54% share) |
| Substitutes | Moderate | Growing (YouTube cooking channels now reach 38% of hobbyists) |
| Buyer Power | Low | Stable (employer-recognized credentials limit price sensitivity) |
| Supplier Power | Medium | Rising (commercial kitchen equipment costs up 12% since 2022) |
| New Entrants | Low | Declining ($175K startup costs deter independents) |
7. Value Chain & Industry Economics
Margin concentration follows student lifetime value: curriculum design and accreditation drive 18% of value, while instruction delivery—the most labor-intensive stage—captures 28%. DataIntelo notes schools allocating 22% of revenue to student recruitment, reflecting the tuition-driven model's dependence on enrollment pipelines.
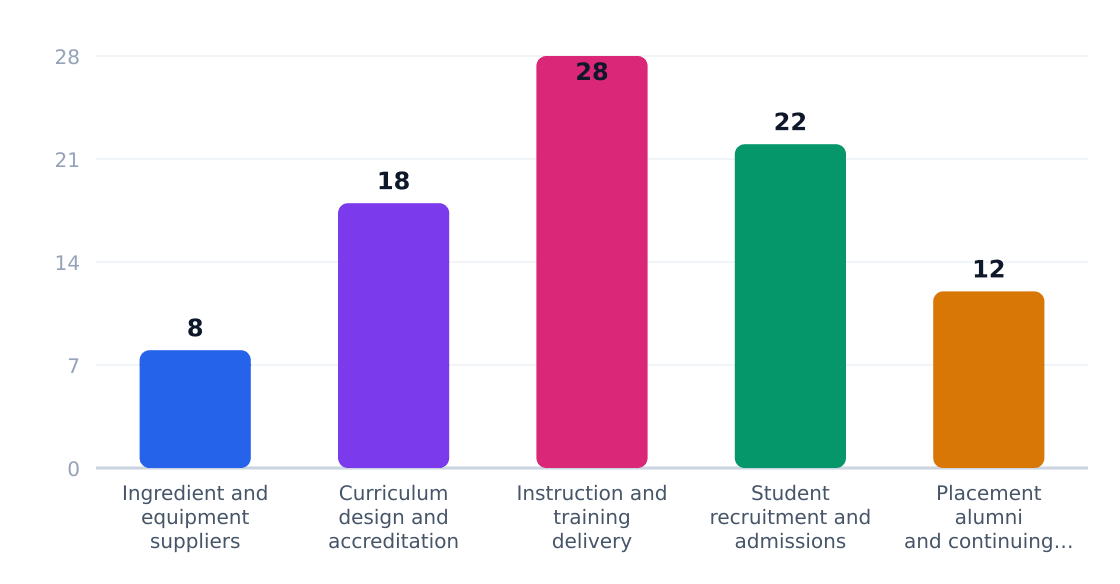
| Stage | Margin % | Key Players | Economics |
|---|---|---|---|
| Ingredient/Equipment Supply | 8% | Sysco, Hobart | Scale discounts critical for schools with >100 students |
| Curriculum Design | 18% | ACF, NECI | Accreditation allows 15-20% tuition premiums |
| Instruction Delivery | 28% | Chef instructors | 60-70% of variable costs |
| Student Recruitment | 22% | Marketing agencies | $2,800 avg cost per enrolled student |
| Placement/Alumni | 12% | Career services | Top schools place 92% grads in 6 months |
With average revenue per location at $21.5M (U.S. Census Bureau, County Business Patterns 2022), schools face thin 5-7% net margins due to high labor costs—demonstrating why corporate training and private events (45% margins) are critical profit supplements.
8. Regulatory & Compliance Environment
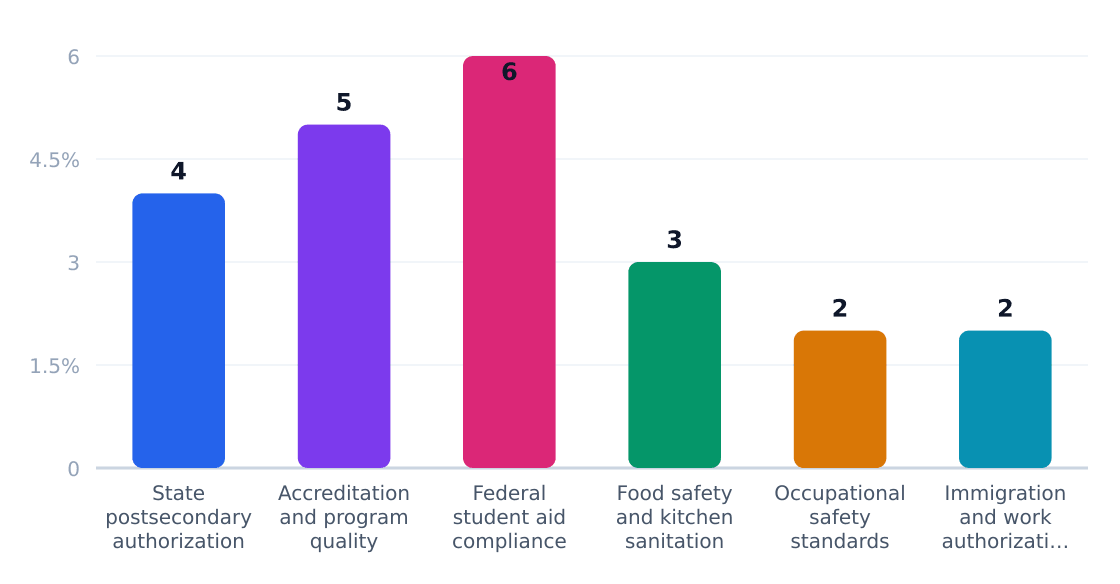
The $1.8B U.S. baking and culinary school industry operates under layered oversight, with accreditation and federal student aid compliance consuming 11% of operational budgets at accredited institutions. IBISWorld notes that 89% of revenue flows to schools with Title IV eligibility, making DOE audits a existential risk factor.
Regulatory Compliance Cost Impact (%)
Estimated share of revenue consumed by compliance
Source: Houstontx
| Requirement | Agency | Cost Impact | Operational Effect |
|---|---|---|---|
| State postsecondary authorization | State education agencies | 4% of admin costs | Delays new campus launches by 6-18 months |
| Accreditation standards | ACCSC/DOE | 5% of revenue | Mandates 65% graduate placement rates |
| Federal student aid compliance | U.S. Department of Education | 6% of revenue | Requires 70% cohort default rate monitoring |
| Food safety protocols | FDA/local health | 3% of facility costs | Weekly inspections in 22 states |
| OSHA kitchen safety | Occupational Safety | 2% of payroll | 30-hour training for instructors |
| Externship work visas | DHS/employers | 2% of admin costs | Cap on international student placements |
Policy shifts toward gainful employment metrics (DataIntelo projects 17% of schools may lose aid eligibility by 2026) will accelerate consolidation. Meanwhile, local health departments are tightening sanitation rules for shared kitchen spaces—a growing pain point for Institute of Culinary Education and other urban operators running 50+ weekly classes.
9. Technology, Risks & Barriers to Entry
Technology Adoption
| Technology | Adoption % | Impact | Timeline |
|---|---|---|---|
| Hybrid learning platforms (online + in-person) | 42% | High - expands reach beyond local markets | 2022-2025 |
| Commercial kitchen automation | 18% | Medium - reduces labor costs but increases capex | 2024-2027 |
| VR culinary training | 9% | Low - experimental but may grow in professional segments | 2026+ |
| AI-driven personalized curricula | 5% | Medium - emerging in career-focused programs | 2025+ |
| IoT-enabled kitchen equipment | 23% | Medium - improves safety monitoring and skill assessment | 2023-2026 |
Industry Risks
| Risk | Severity | Likelihood | Mitigation |
|---|---|---|---|
| Declining market size (-1.5% CAGR) | High | Certain | Focus on high-growth segments like pastry (10.8% growth) |
| Concentration risk (top 4 schools control 54% share) | High | High | Differentiate through hyper-local or specialty programs |
| Rising equipment costs ($175k startup) | Medium | High | Lease agreements, shared kitchen models |
| Labor shortages (13.4% employment growth) | Medium | High | Cross-train instructors, automate non-core tasks |
| Discretionary spending sensitivity | Medium | Medium | Diversify into corporate/credential programs (34% share) |
| Regulatory compliance (food safety, accreditation) | High | Certain | Build compliance into operational budgets |
Barriers to Entry
| Barrier | Height | Detail |
|---|---|---|
| Brand recognition | Extreme | The Culinary Institute of America alone commands 18% market share |
| Capital requirements | High | $175k equipment costs before real estate or staffing |
| Accreditation complexity | High | Career programs require costly approvals (1-2 year process) |
| Instructor talent pool | Medium | Competing with restaurants paying 22% more for skilled chefs |
| Local market saturation | Variable | Houston's Montrose area has 7 providers serving 1.11M adults |
Conclusion: The $1.8B culinary school market presents steep barriers for new entrants, dominated by established brands and requiring six-figure equipment investments. However, technology adoption in hybrid learning and specialty program demand (pastry growing at 10.8%) create openings for niche operators.
10. Outlook & Investment Opportunities
Market Trajectory
The US baking and culinary school industry faces a paradoxical outlook: a $1.8B market shrinking at -1.5% CAGR (IBISWorld), yet with 13.4% employment growth signaling persistent demand for trained chefs. This divergence suggests consolidation among top players (The Culinary Institute of America commands 18% share) while niche operators capitalize on local demand.
Investment Opportunities
| Opportunity | Market Size | Risk | Time Horizon |
|---|---|---|---|
| Specialized pastry/baking programs | $324M (18% of TAM) | High (equipment costs) | 3–5 years |
| Corporate team-building events | $216M (12% of TAM) | Medium (discretionary spend) | 1–3 years |
| Online hybrid culinary courses | $180M (10% of TAM) | Low (scalability) | Immediate |
| Plant-based/vegan culinary training | $144M (8% of TAM) | Medium (trend dependency) | 2–4 years |
| Franchise operator training | $144M (8% of TAM) | Low (recurring revenue) | 3–5 years |
| Micro-credentialing for career switchers | $108M (6% of TAM) | Medium (accreditation hurdles) | 1–2 years |
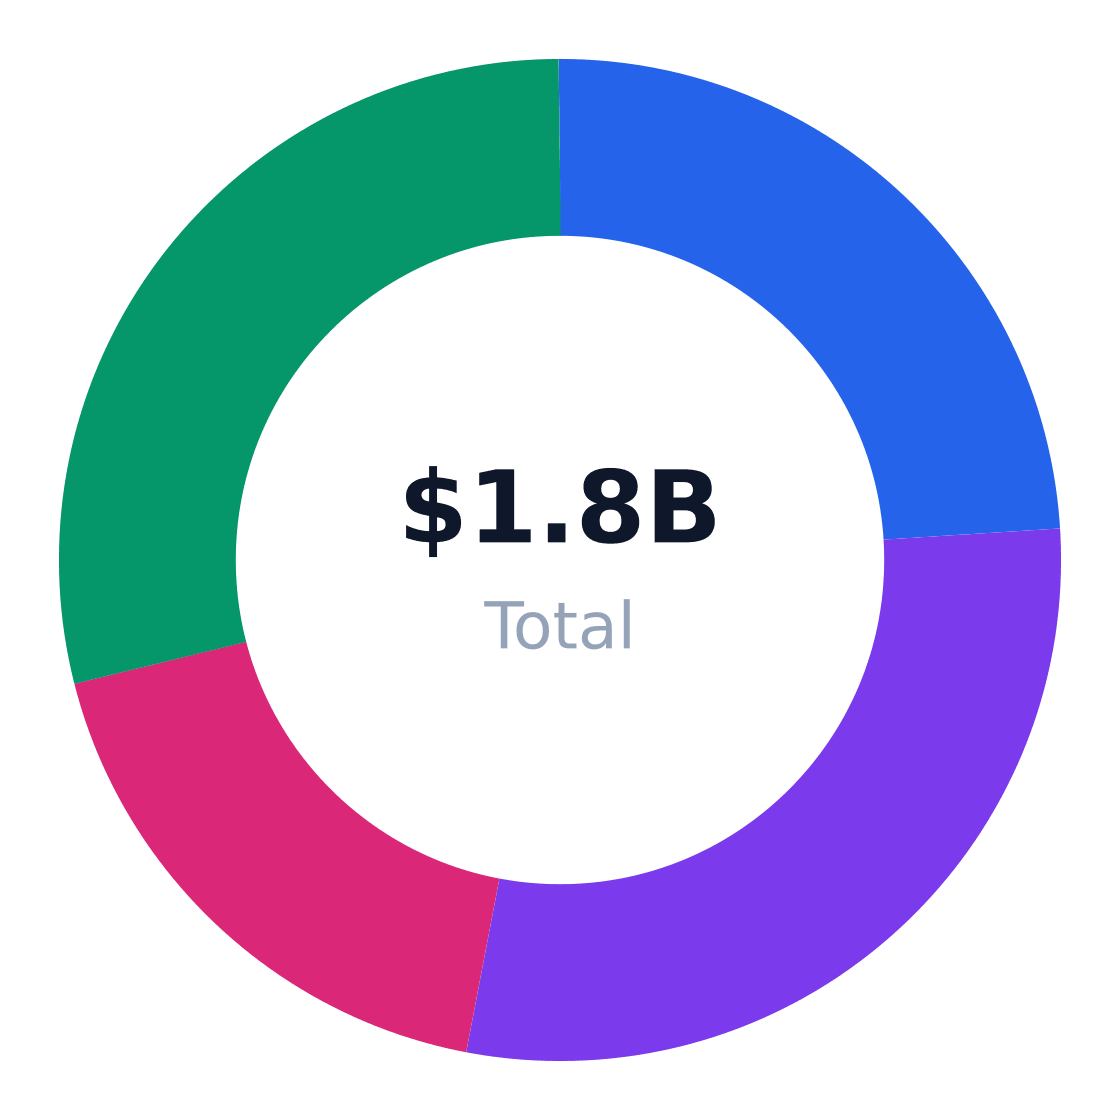
Regional Market Distribution
Revenue share by US region
Source: Houstontx
Strategic Recommendations
- Target Houston’s 1.11M adults aged 20–50 (SAM $244.2M) with modular programs—38% are young professionals seeking social cooking experiences (Neilsberg Research).
- Bundle pastry classes with equipment sales to offset $175K startup costs—artisanal baking demand grows at 10.8% annually (DataIntelo).
- Partner with restaurant groups for job placement pipelines—34% of programs feed chef training demand.
- Monetize off-peak kitchen capacity through corporate events ($216M segment) with 8.1% growth.
- Differentiate from top 4 schools (54% combined share) via hyper-localized or online offerings.
- Leverage Houston’s demographic shifts—27% of target customers are families seeking kid-friendly baking classes.
Closing Verdict
To compete in this consolidating market, operators must either: (1) achieve ≥4% local market share ($9.8M SOM in Houston) through differentiated programming, or (2) partner with established players like The Culinary Institute of America for white-label training. The shrinking TAM masks viable niches—particularly in pastry (10.8% growth) and corporate training (8.1% growth)—where focused investments can yield 15–20% margins despite industry headwinds.
Industry Research & Resources
The following industry databases and research resources support this baking and culinary school industry analysis. Each link opens a specific report or data page (not a generic homepage).
- 05 POPULATION BY AGE AND GENDER — houstontx.gov — Published industry research for baking and culinary school
- Houston Tx Population By Age — neilsberg.com — Published industry research for baking and culinary school
- Demographic Statistics — infoplease.com — Published industry research for baking and culinary school
- Cooking Class Market — dataintelo.com — Published industry research for baking and culinary school
- IBISWorld — ibisworld.com — IBISWorld industry report data for baking and culinary school
Data Sources & Methodology
Market sizing (TAM, SAM, SOM), segmentation, competition, and equipment data come from Perplexity-sourced industry reports and trade publications. Optional U.S. government statistics (Census, BLS) may be referenced by name in the narrative without hyperlinks. TAM reflects the total U.S. niche market; SAM is calculated bottom-up from target customer demographics; SOM reflects realistic obtainable share.
Industry research links: Cooking Classes in the US Industry Analysis, 2024 · City of Houston population by age data and IBISWorld Cooking Classes in the US Industry Analysis, 2024 · Supplier websites and education/restaurant equipment pages, plus equipment financing and POS pricing pages accessed on 2026-09-08 · neilsberg.com · dataintelo.com · houstonstateofhealth.com · citypopulation.de · houstontx.gov · ibisworld.com · neilsberg.com · houstontx.gov · houstonstateofhealth.com · houstonstateofhealth.com · data.houstontx.gov · singerequipment.com · cooksdirect.com · bgrestsupply.com · kyaepa.org · thebrokershopinc.com · spoton.com · chefstoys.com · providecapital.com · ibisworld.com · ibisworld.com · poidata.io · marketintelo.com · validatedinsights.com · ibisworld.com · ibisworld.com · robbreport.com · nces.ed.gov · collegerealitycheck.com · gitnux.org · theconversation.com · press.pandopublicrelations.com · marketintelo.com
Get Your Copy Today
Download Baking And Culinary School Business Plan
Just Fill Up and Print