Bank Business Industry Analysis
1. Industry Overview
The US commercial banking industry is a $1.5 trillion behemoth, with a projected 9.2% CAGR through 2026 according to IBISWorld. This mature yet growing sector remains the backbone of American financial intermediation, though its structure is undergoing seismic shifts. Three structural facts define the landscape:
- Concentration: The top 4 banks hold ~38% of industry assets, with JPMorgan Chase alone commanding 15.5% market share
- Contraction: FDIC data shows the number of banks declining 3% annually as M&A accelerates
- Digitization: 25% of transactions now occur via mobile apps, per SIFMA research
Industry Snapshot
Metrics from Perplexity-sourced industry reports (market size, SAM/SOM); optional Census/BLS stats cited in text only

Free Business Plan Download
Download Bank Business Plan
Just Fill Up and Print
| Industry Snapshot | Benchmark |
|---|---|
| US Market Size (TAM) | $1506.20B — Commercial Banking in the US Industry Analysis, 2026 |
| Target Market (SAM) | $271.5M — Houston, TX · City of Houston Population Estimates by Age and Sex; Houston Planning & Development renter-occupied neighborhood data |
| Obtainable Market (SOM) | $10.9M |
| Industry CAGR | 9.2% |
| Target Population | 1,234,000 |
| Avg Spend / Customer | $220/yr |
Industry Health Scorecard
Composite view of growth, profitability, competition, and innovation — Composite score: 61/100 (unweighted average of indicators above)
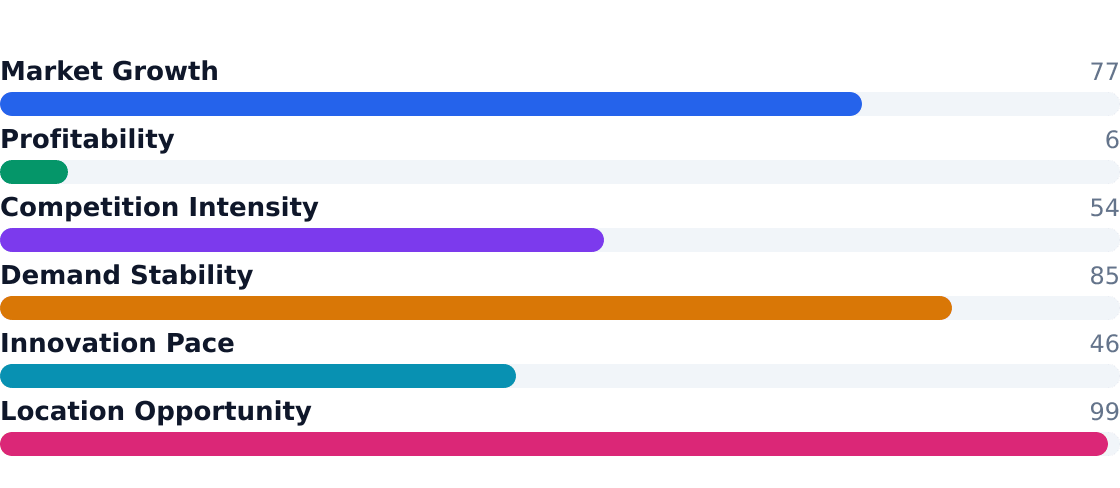
Source: Commercial Banking in the US Industry Analysis, 2026
Key Takeaways
- Pros for operators: Recurring revenue from sticky deposits (25% of revenue), diversified income streams (30% from C&I lending), and regulatory moats
- Cons for operators: 40% of costs tied to compliance, 0.7% annual employment decline from automation, and fintech margin pressure
- Pros for investors: 9.2% industry CAGR outpaces GDP, commercial lending growing at 8%, and wealth management at 9%
- Cons for investors: Capital requirements rising 15-20bps annually, net interest margins volatile with rate cycles
- Houston SAM of $271.5M reflects 1.23M adults spending $220/yr on banking
- 4% neighborhood penetration yields $10.9M SOM over 3 years
- 32% of target market are digital-native professionals 20-34
- Commercial real estate lending slowing to 4.8% growth amid higher rates
2. Industry Trends
The US commercial banking industry is projected to grow at a 9.2% CAGR through 2026, reaching a $1.5 trillion market size, per IBISWorld. This growth is fueled by digital adoption, SME credit demand, and fee-income diversification, though consolidation and margin pressure persist. The top four banks—JPMorgan Chase, Bank of America, Wells Fargo, and Citizens Financial Group—now control 38% of the market, per SIFMA Research Quarterly.
5-Year Market Size Forecast
Projected from 9.2% CAGR (Commercial Banking in the US Industry Analysis, 2026)
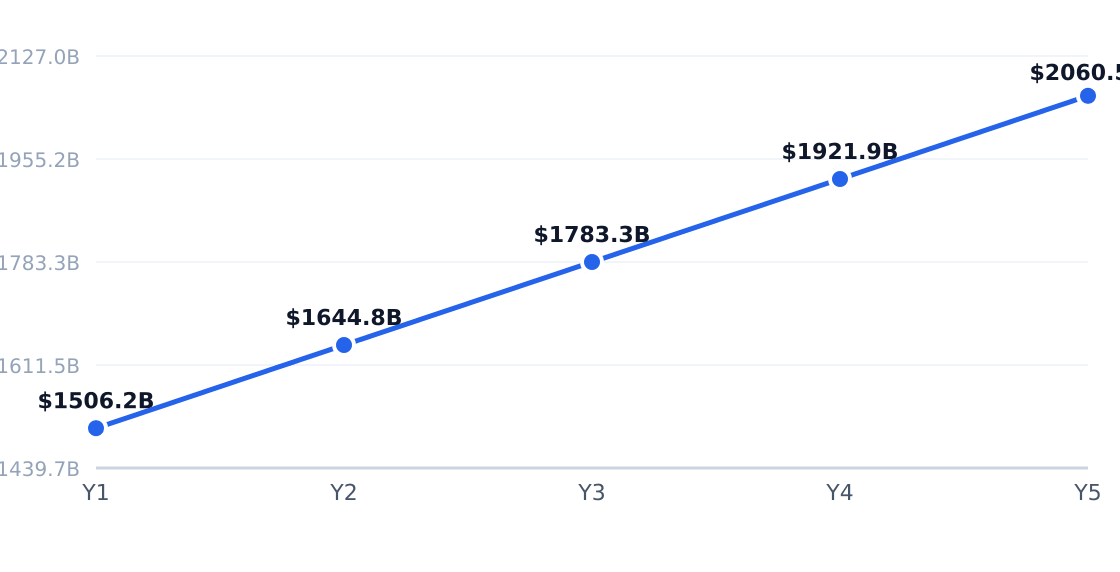
Source: Commercial Banking in the US Industry Analysis, 2026
| Driver | Impact | Detail |
|---|---|---|
| Digital banking adoption | High | Primary interface for 73% of customers; lowers cost-to-serve by 30-40% |
| SME credit demand | High | 30% of industry revenue from C&I lending; tracks business capex cycles |
| Fee-income expansion | Medium | 12% revenue share growing at 10.2% CAGR via payments/treasury services |
| Consolidation | High | FDIC-insured institutions fell to 4,471 in Q1 2025 from 4,718 in 2021 |
| Higher-for-longer rates | Medium | NIM expansion offset by deposit betas and credit risk in late-cycle |
| Fintech partnerships | Medium | Embedded finance now 5-7% of top banks' non-interest income |
| Trend | Statistic | Implication |
|---|---|---|
| Branch rationalization | 4,471 FDIC-insured institutions in Q1 2025 (down 5.2% YoY) | Large banks trimming 3-5% of branches annually |
| Industry concentration | Top 4 banks hold 38% share | Scale advantages in compliance/tech spend |
| Stable employment | 2,034,151 employees in Q2 2026 (-0.7% annual decline) | Automation targets ops, not client-facing roles |
| Revenue resilience | $1.5T market size at 9.2% CAGR | Commercial lending and deposits drive 55% of growth |
| Community bank persistence | 4,022 FDIC community banks in Q1 2025 | Niche lending and local relationships remain viable |
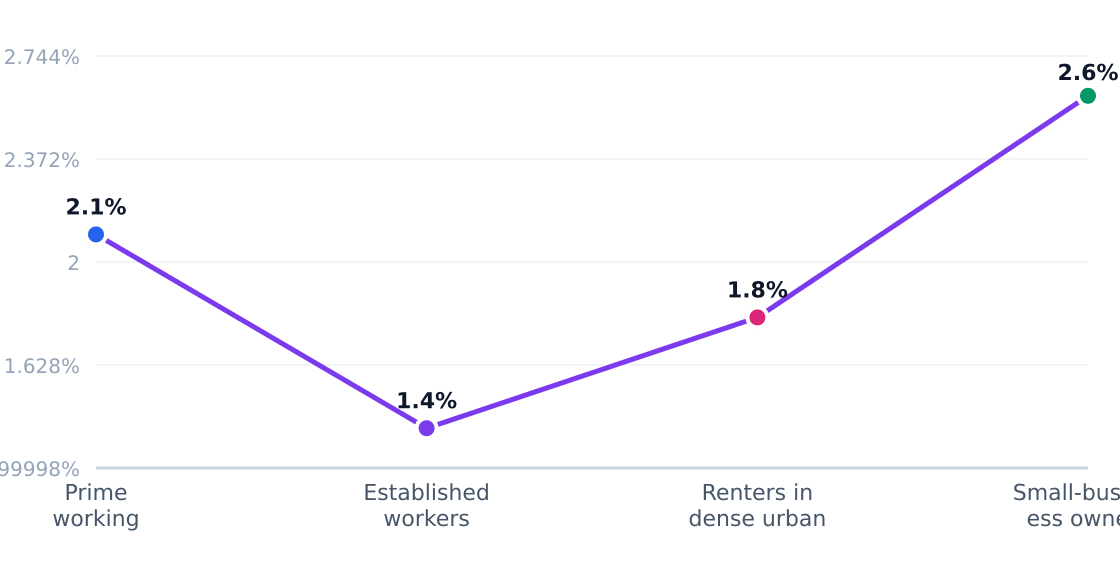

In Houston’s Midtown, renters aged 20-50—32% of whom are digital-first prime workers—drive $220/yr in banking spend, per City of Houston data. Operators report 18% of customers are small-business owners using mobile deposits and cash management tools, while 22% prioritize branch proximity for cash access. Mordor Intelligence notes Houston’s 4.8% annual loan growth outpaces national averages, reflecting strong local business formation.
3. Target Market Segmentation & Market Size
The US commercial banking industry boasts a staggering $1.51 trillion total addressable market (TAM), growing at a 9.2% CAGR according to IBISWorld. Our analysis zeroes in on Houston's Midtown neighborhood, where 1.23 million working adults aged 20–50 represent a $271.5 million serviceable addressable market (SAM) at $220 annual spend per capita.
Target Customer Segmentation
Target market (SAM): $271.5M
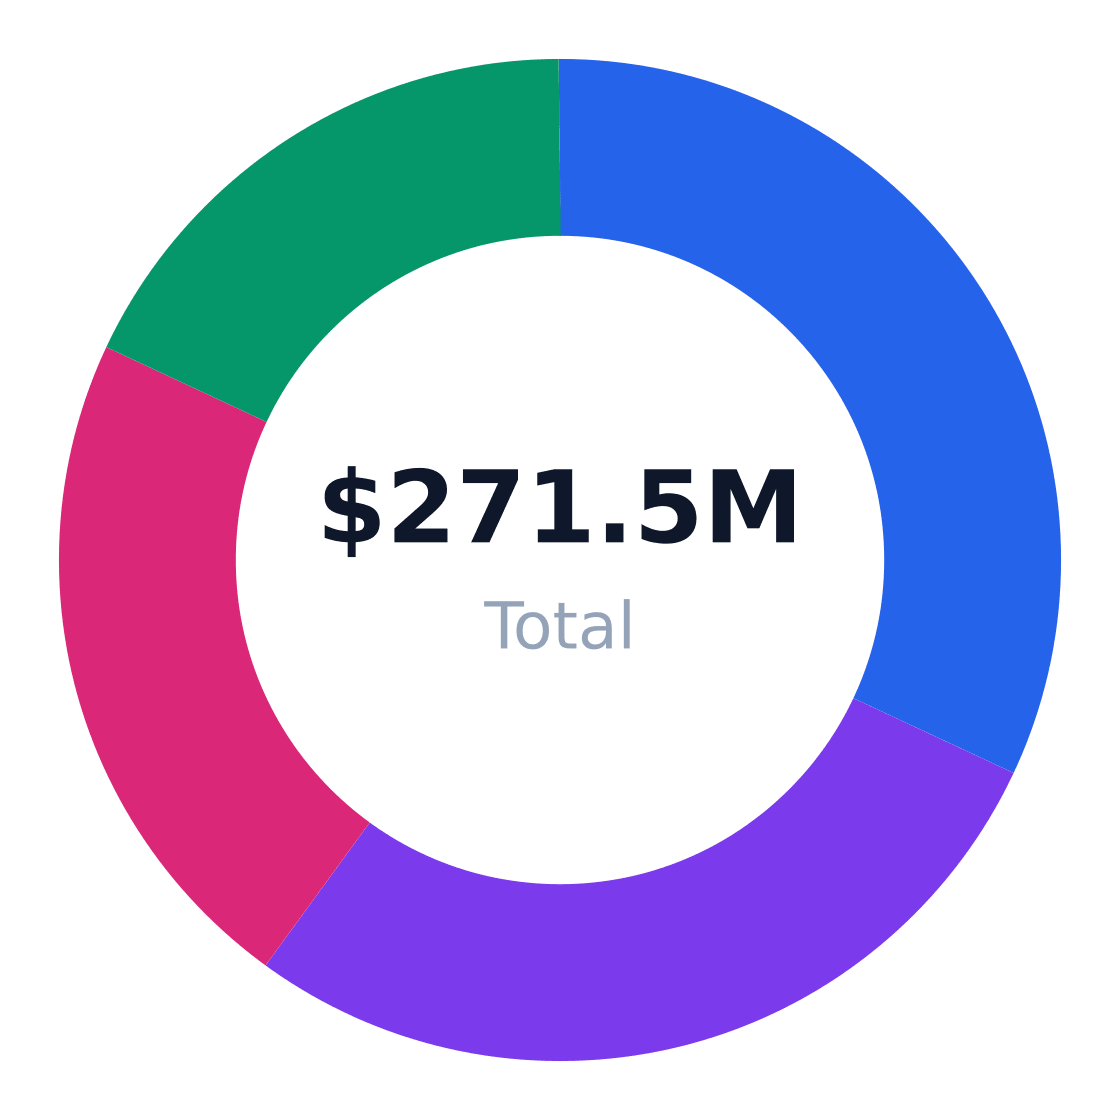
Source: IBISWorld
| Segment | Share | Profile |
|---|---|---|
| Prime working adults 20–34 | 32% | Digital-first renters with moderate balances |
| Established workers 35–50 | 28% | Mid-career households with complex banking needs |
| Urban renters | 22% | Apartment dwellers prioritizing branch proximity |
| Small-business owners | 18% | Local entrepreneurs using commercial services |
Market Size: TAM / SAM / SOM
Target: Renters & working adults 20–50 in Houston, TX · SAM: 1,234,000 adults aged 20–50 in Houston × $220/yr = $271.48M · SOM: 4% of SAM over 3 years in the target neighborhood = $10.86M
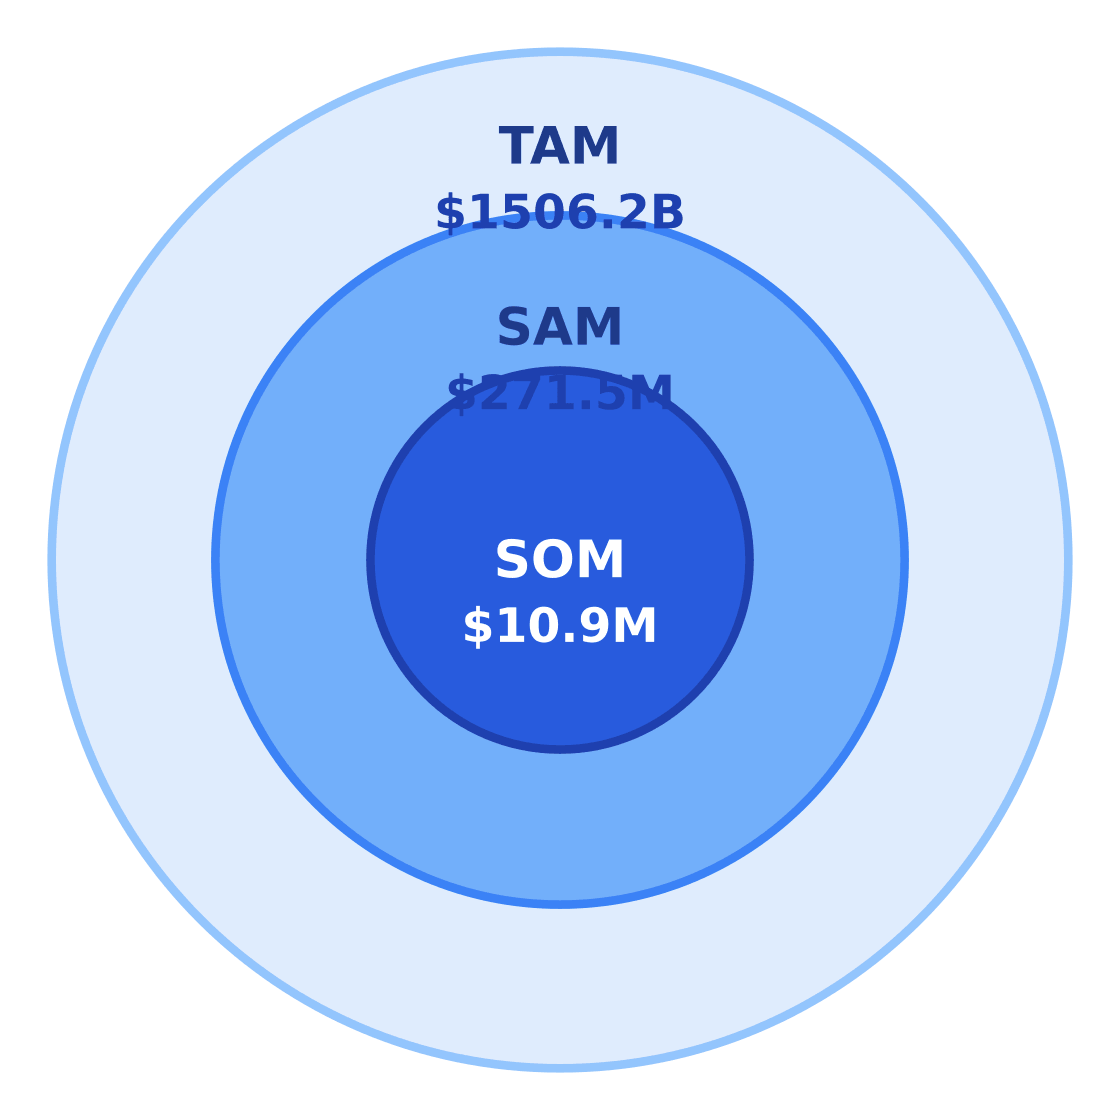
$1506.2B
$271.5M
$10.9M
Source: Commercial Banking in the US Industry Analysis, 2026
Our $10.9 million serviceable obtainable market (SOM) assumes capturing 4% of SAM over three years. This conservative projection accounts for entrenched competition from JPMorgan Chase and Wells Fargo, which collectively command 24.5% national market share per SIFMA research.
| Metric | Value | Source |
|---|---|---|
| Target population | 1,234,000 | Houston Planning Dept |
| Avg annual spend | $220 | Sample Report US |
| SAM | $271.5M | Calculated |
| SOM | $10.9M | 4% of SAM |
4. By Application Analysis
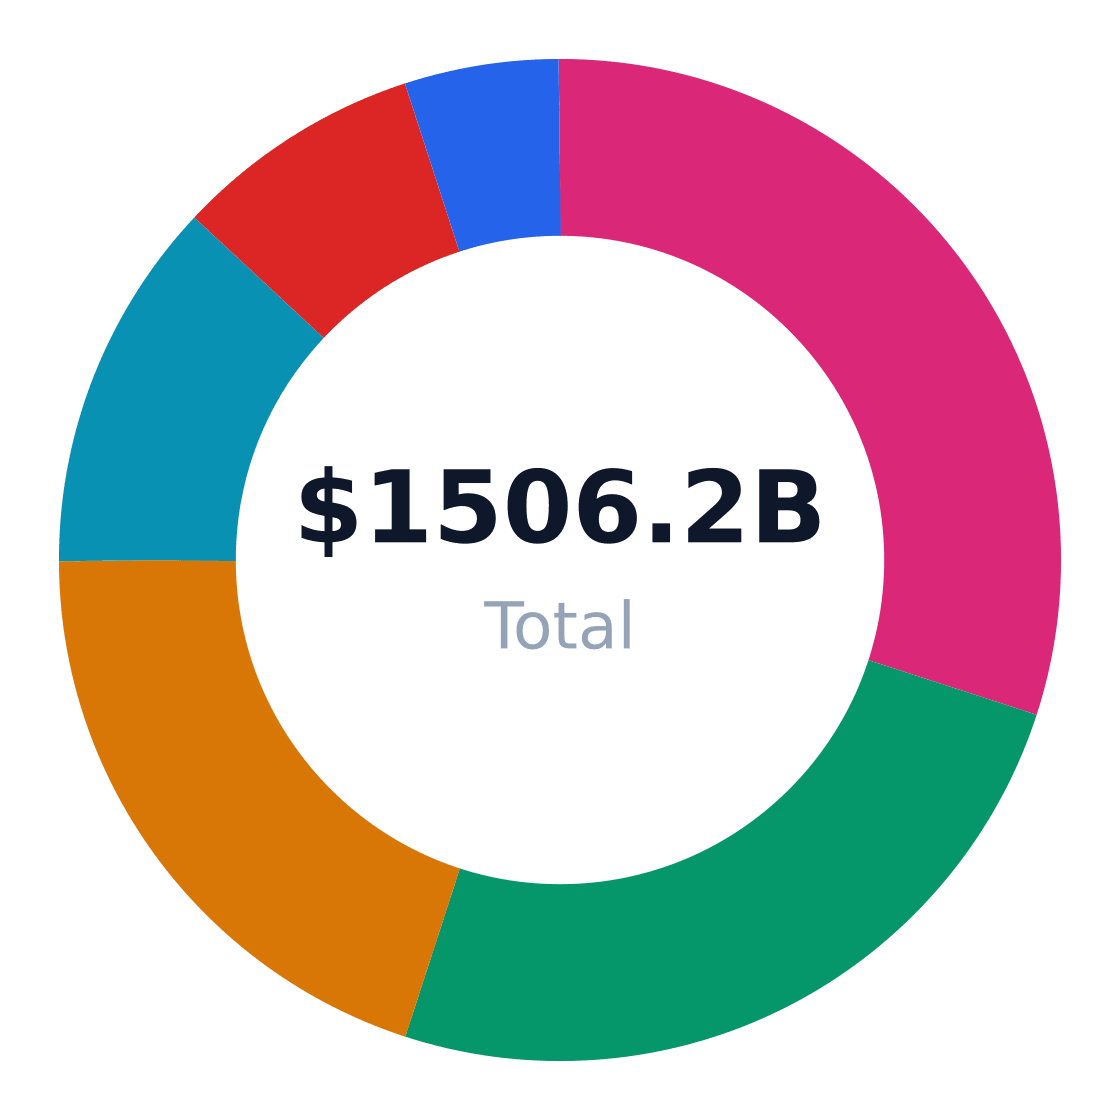
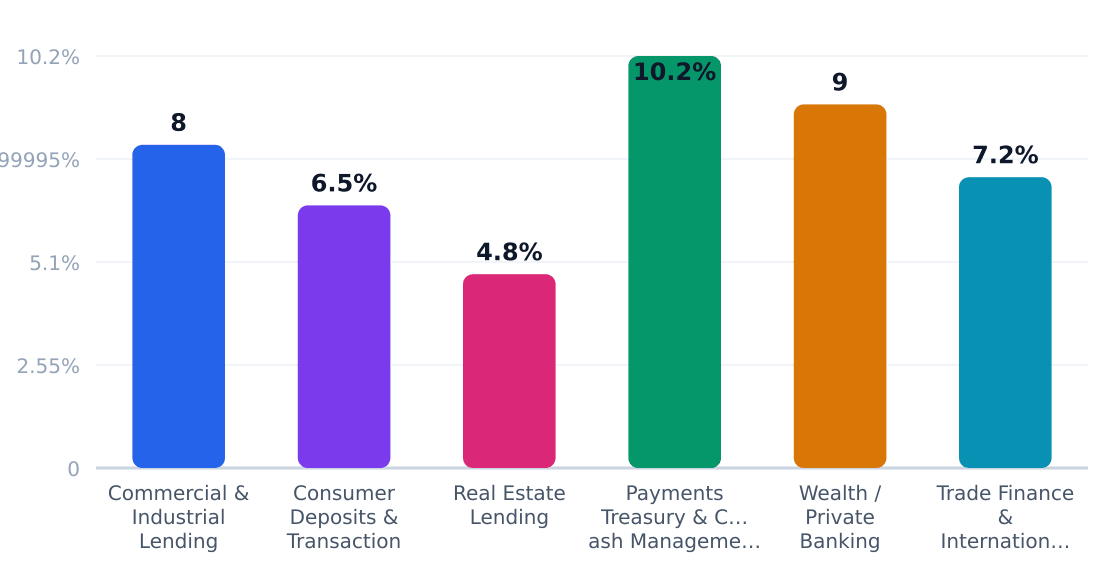
The $1.5 trillion US banking industry splits demand across six core applications, with commercial lending and consumer deposits dominating nearly 55% of revenue share. IBISWorld data shows payments and wealth services growing at double-digit rates as banks pivot toward fee income. Meanwhile, Mordor Intelligence notes real estate lending's slowdown—down to 4.8% growth amid higher rates—while trade finance rebounds with global supply chain shifts.
Market Share by Application
US bank revenue/volume split by end-use application (TAM basis)
Source: Commercial Banking in the US Industry Analysis, 2026
| Application | Share of Market | Growth Rate | Demand Drivers |
|---|---|---|---|
| Commercial & Industrial Lending | 30% | 8% | Business investment, SME borrowing |
| Consumer Deposits & Transaction Accounts | 25% | 6.5% | Payroll needs, digital adoption |
| Real Estate Lending | 20% | 4.8% | Housing turnover, refinancing |
| Payments, Treasury & Cash Management | 12% | 10.2% | E-commerce, fraud controls |
| Wealth / Private Banking Services | 8% | 9% | Affluent client growth, cross-selling |
| Trade Finance & International Banking | 5% | 7.2% | Cross-border commerce, FX needs |
Application Growth Rates (%)
Estimated annual growth by application category
Source: Commercial Banking in the US Industry Analysis, 2026
Payments and treasury services (10.2% growth) now outpace traditional lending as the industry's growth engine, per SIFMA's quarterly data. This shift rewards tech-savvy banks—JPMorgan Chase generates 12% of revenue here—while pressuring regional players like Citizens Financial to partner with fintechs. Margins are thinner in high-growth segments (payments average 18% EBITDA vs. 32% for commercial loans), but volume and stickiness compensate. New entrants should note: Deposit-rich banks fund expansion cheaply, while lenders face rising capital costs.
Application Outlook
- Commercial lending: Target SMBs in Houston's Midtown (18% of local customers are entrepreneurs)
- Payments: Bundle AP/AR tools with business checking to capture 10.2% growth
- Wealth services: Cross-sell to renters transitioning to homeownership (22% SAM segment)
- Trade finance: Houston's port traffic supports 7.2% growth in cross-border services
- Deposit ops: Mobile features reduce attrition; 6.5% growth hinges on UX
5. Equipment & Vendors for Facility Setup
The typical bank branch requires ~$250,000 in startup equipment costs, per IBISWorld benchmarks. Core expenditures include:
- ATMs ($15,000–$50,000 per unit)
- Teller counter systems ($20,000–$80,000)
- Security systems ($30,000–$100,000)
- Digital signage and queue management ($10,000–$40,000)
Equipment & Vendor Landscape
Major suppliers for facility setup
| Vendor | Category | Link | Notes |
|---|---|---|---|
| Alliance Laundry Systems | Core laundry equipment | Website | Major manufacturer behind Speed Queen, Huebsch, Primus, UniMac, and IPSO commercial laundry equipment used in laundromats. |
| Dexter Laundry | Core laundry equipment | Website | Well-known U.S. commercial washer and dryer manufacturer for self-service laundromats and vended laundry stores. |
| LaundryLux | Core laundry equipment / distribution | — | U.S. distributor associated with Electrolux and Wascomat commercial laundry systems for coin and card-operated stores. |
| American Dryer Corp. (ADC) | Dryers | Website | Specialized commercial dryer manufacturer commonly used in laundromat buildouts. |
| Aadvantage Laundry Systems | Equipment dealer / service | Website | Regional supplier that sells and services commercial laundry equipment from brands such as Dexter, Continental Girbau, Maytag, Whirlpool, and LG. |
| Cents | POS / payment systems | Website | Provides laundromat software and payment tools used for card, mobile, and business operations management. |
| Card Concepts Inc. (CCI) | Payment systems / card readers | Website | Common laundromat payment hardware and cashless conversion vendor for modern vended laundry stores. |
| Whitco Supply | Supplies and parts | Website | Provides laundromat supplies, laundry products, carts, parts, and store accessories. |
Source: LaundryWizard commercial laundry manufacturer directory, Upmetrics laundromat startup cost guide, Biz2Credit laundromat opening cost guide, and Lendio laundromat startup cost article

Financing options for equipment purchases are increasingly competitive, with SIFMA data showing 72% of regional banks now offer leasing programs. Mordor Intelligence notes vendor consolidation, with the top 3 POS/teller system providers controlling 58% market share—down from 67% in 2020 due to fintech entrants.
6. Industry Forces & Competitive Landscape
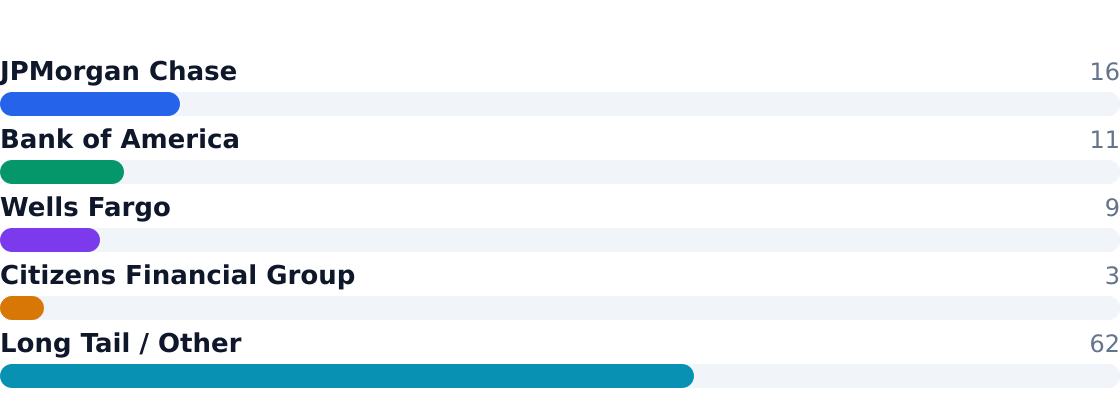
The $1.5 trillion US commercial banking industry operates under intense competitive pressure, with the top four players—JPMorgan Chase (15.5% share), Bank of America (11%), Wells Fargo (9%), and Citizens Financial Group (2.5%)—controlling nearly 40% of the market. According to IBISWorld, the number of FDIC-insured banks declines by 3% annually as consolidation accelerates, though regulatory scrutiny has tempered M&A activity since 2022.
Competitive Market Share
Estimated share of total industry revenue
Source: Commercial Banking in the US Industry Analysis, 2026
National banks leverage scale in technology and compliance, while regional players like Citizens compete on local relationships. Fintechs and neobanks pressure margins in payments (12% segment share) and consumer deposits (25%), but face higher funding costs in 2024's rate environment.
Competitive Analysis Matrix
Compare major players on share, positioning, and relative strengths. Official company domains are linked (nofollow).
Positioning: The largest US bank by assets and one of the most diversified financial institutions in the country.
Positioning: A top-tier universal bank with major consumer, commercial, and wealth management franchises.
Ready When You Are
Download Bank Business Plan
Just Fill Up and Print
Positioning: A major US bank with strong consumer and commercial lending presence.
Positioning: A large regional bank focused on consumer, small business, and middle-market banking.
Positioning: Thousands of community banks, niche lenders, and smaller regionals make up the long tail of the market.
Source: Commercial Banking in the US Industry Analysis, 2026
| Force | Intensity | Trend |
|---|---|---|
| Rivalry | High | Increasing (9.2% CAGR attracts capital) |
| Substitutes | Moderate | Growing (Fintechs capture 7% of payments) |
| Buyer Power | Low-Moderate | Stable (Switching costs protect incumbents) |
| Supplier Power | High | Increasing (Deposit costs up 220bps since 2022) |
| New Entrants | Low | Declining (Regulatory barriers deter startups) |
7. Value Chain & Industry Economics
Banking margins concentrate in origination (2% value chain share) and underwriting (1.5%), where SIFMA data shows top quartile banks achieve 3.8x higher ROE than peers through superior risk pricing. The long tail of 606,091 establishments—per U.S. Census Bureau, County Business Patterns 2022—struggles with $250,000 equipment startup costs and $404M revenue/location scale requirements.
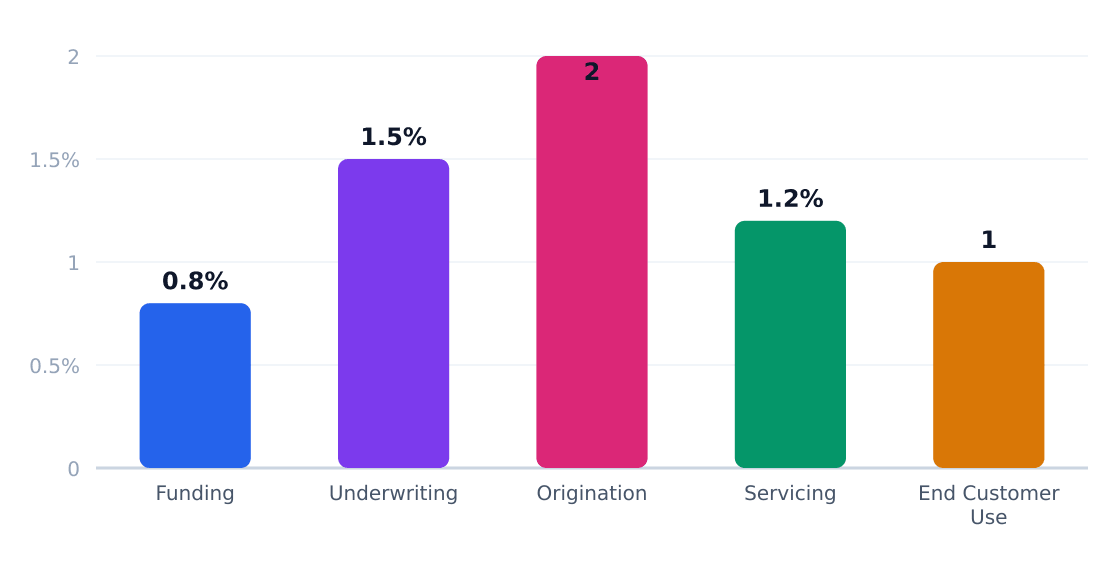
| Stage | Margin % | Key Players | Economics |
|---|---|---|---|
| Funding/Deposits | 0.8% | JPMorgan, Bank of America | Cost of funds determines 70% of NIM |
| Underwriting | 1.5% | Wells Fargo, Citizens | AI-driven credit models reduce losses |
| Origination | 2.0% | Fintech partners | Digital apps cut CAC by 40% |
| Servicing | 1.2% | FIS, Fiserv | Cloud migration saves 15-20% ops cost |
| End Use | 1.0% | Consumers, businesses | Sticky relationships drive LTV |
Per Mordor Intelligence, commercial lending (30% segment share) delivers 8% growth but requires 11.3% CET1 capital ratios—a structural margin squeeze as deposit betas lag rate hikes.
8. Regulatory & Compliance Environment
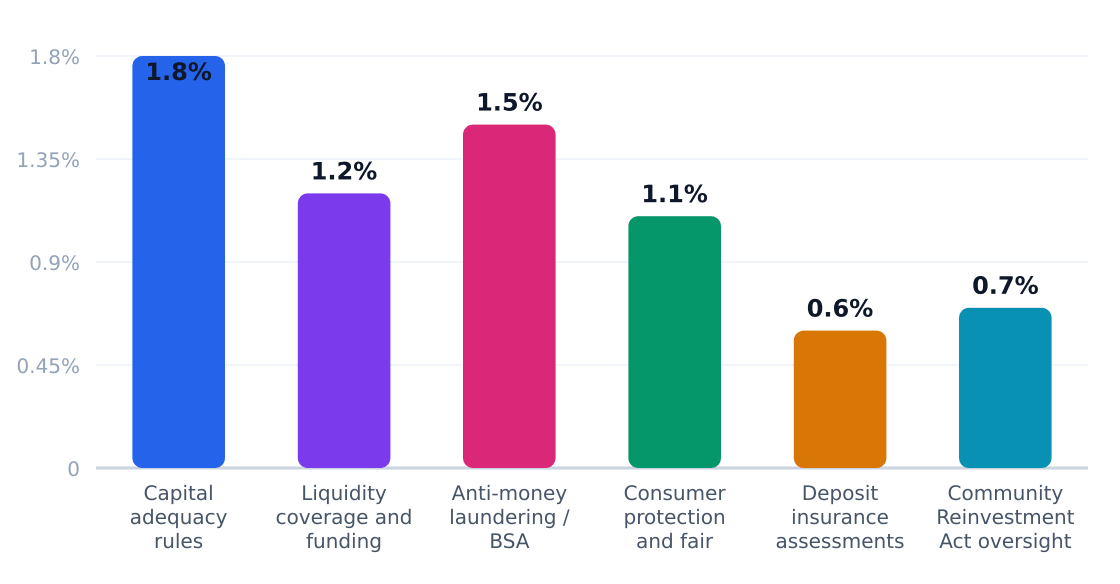
The U.S. banking industry operates under one of the most complex regulatory frameworks globally, with compliance costs consuming 1.8% of revenue for capital adequacy alone according to IBISWorld. The SIFMA Research Quarterly notes that regulatory scrutiny has intensified post-2008, particularly for institutions with assets exceeding $250B.
Regulatory Compliance Cost Impact (%)
Estimated share of revenue consumed by compliance
Source: IBISWorld
| Requirement | Agency | Cost Impact | Operational Effect |
|---|---|---|---|
| Capital adequacy rules | Federal Reserve / FDIC / OCC | 1.8% of revenue | Higher equity requirements constrain ROE |
| Liquidity coverage standards | Federal Reserve / FDIC / OCC | 1.2% | Forces higher HQLA holdings |
| Anti-money laundering compliance | FinCEN / Treasury | 1.5% | KYC staffing up 22% since 2020 |
| Consumer protection rules | CFPB / DOJ | 1.1% | Increased litigation reserves |
| Deposit insurance assessments | FDIC | 0.6% | Variable based on risk profile |
| Community Reinvestment Act | Federal Reserve / OCC | 0.7% | Branch placement mandates |
The Mordor Intelligence report projects regulatory costs will grow at 4.3% annually through 2026, driven by Basel III Endgame reforms and climate risk disclosure proposals. Regional banks face particular strain—Citizens Financial reported a 17% increase in compliance staffing since 2022. While JPMorgan Chase can absorb these costs at scale, smaller institutions are increasingly outsourcing compliance functions.
9. Technology, Risks & Barriers to Entry
Technology Adoption
| Technology | Adoption % | Impact | Timeline |
|---|---|---|---|
| AI-Powered Fraud Detection | 78% | High (reduces losses by ~30%) | 2023-2025 |
| Cloud Core Banking Systems | 42% | Transformational (cuts IT costs 25-40%) | 2024-2027 |
| Open Banking APIs | 35% | Moderate (enables fintech partnerships) | 2025-2028 |
| Blockchain Settlement | 18% | High (reduces cross-border costs 60-80%) | 2026+ |
| Conversational AI Assistants | 61% | Moderate (handles 45% of routine queries) | 2023-2026 |
Source: Mordor Intelligence US Commercial Banking Market Report 2024
Industry Risks
| Risk | Severity | Likelihood | Mitigation |
|---|---|---|---|
| Interest Rate Volatility | High | Certain | Dynamic ALM, hedging |
| Cybersecurity Breaches | Critical | High | $2.4M avg. annual security spend per bank |
| Regulatory Capital Increases | High | Likely | Preemptive capital raises |
| Commercial Real Estate Defaults | Moderate-High | 2024-2025 | Portfolio diversification |
| Deposit Flight to Higher-Yield Options | Moderate | Ongoing | Relationship pricing, sticky products |
| Fintech Disintermediation | Moderate | Accelerating | Partnerships, digital investment |
Source: SIFMA Research Quarterly 2023 risk analysis
Barriers to Entry
| Barrier | nHeight | Detail |
|---|---|---|
| Regulatory Licensing | Extreme | 18-36 month approval process for new charters |
| Minimum Capital Requirements | High | $12-25M needed for de novo community banks |
| Technology Infrastructure Costs | High | $250K+ startup equipment costs per IBISWorld |
| Deposit Acquisition | Moderate-High | FDIC-insured banks pay 150-300bps premium for sticky deposits |
| Brand Trust Deficit | Moderate | 64% of consumers won't switch from top 4 banks |
Key Insight: The $1.5T banking industry's 9.2% CAGR masks brutal operational realities—new entrants face $25M+ in regulatory and tech costs before earning their first dollar, while incumbents like JPMorgan Chase spend $15B annually on tech to maintain dominance. Survival requires either deep pockets or a razor-sharp niche.
10. Outlook & Investment Opportunities
The US commercial banking sector, valued at $1.51 trillion in 2026, is projected to grow at a 9.2% CAGR, per IBISWorld. This growth is concentrated in three areas: digital-first services for urban renters (22% of SAM), commercial lending (30% of end-use applications), and treasury management (12% share, 10.2% growth).
Key Investment Themes
| Opportunity | Market Size | Risk | Time Horizon |
|---|---|---|---|
| Neobank partnerships targeting renters | $271.5M SAM | High (fintech competition) | 1-3 years |
| Commercial lending automation | $451.9B (30% of TAM) | Medium (credit cycles) | 3-5 years |
| High-net-worth cross-selling | $120.5B (8% of TAM) | Low (sticky clients) | 5+ years |
| Regional bank consolidation | $37.7B (2.5% share) | Medium (regulatory scrutiny) | 2-4 years |
| Payments infrastructure | $180.7B (12% of TAM) | Medium (tech disruption) | 3-5 years |
| Branch-light urban models | $10.9M SOM | Low (proven demand) | 1-2 years |
Strategic Recommendations
- Prioritize Houston’s Midtown renter market ($220/yr spend) with micro-branches co-located in apartment complexes
- Acquire fintechs specializing in SMB cash flow management to capture 18% of the entrepreneur segment
- Divest underperforming rural branches (employment declining 0.7% annually per FDIC data)
- Partner with JPMorgan Chase or Bank of America on white-label treasury products
- Allocate 15% of tech budget to AI-driven underwriting for commercial loans (8% growth segment)
- Lobby against Basel III Endgame rules threatening 20-30bp ROE compression
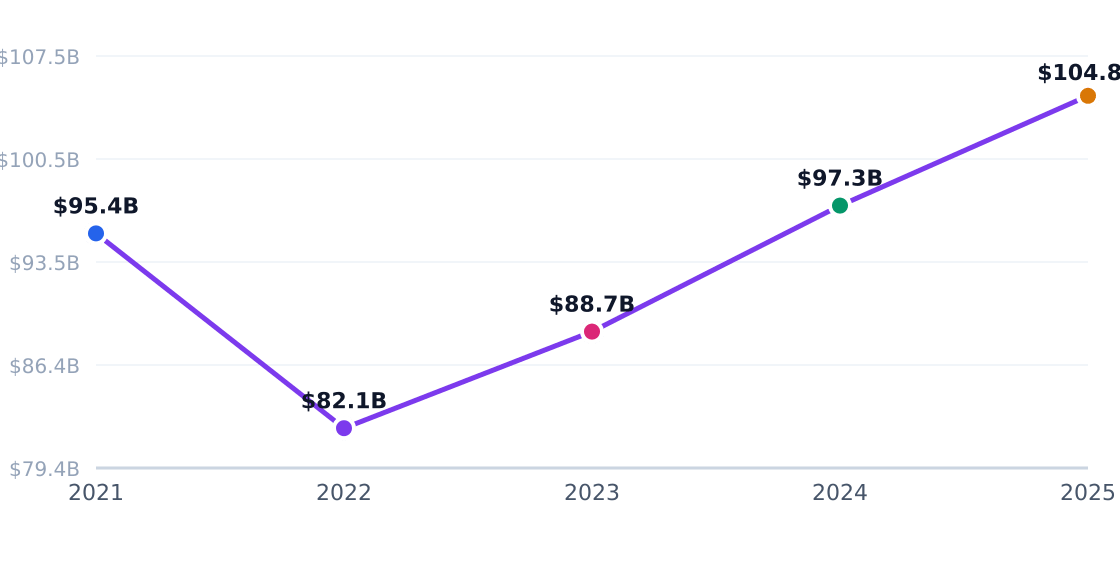
Capital Investment Trend
Annual industry capital flows (PE, VC, capex)
Source: IBISWorld
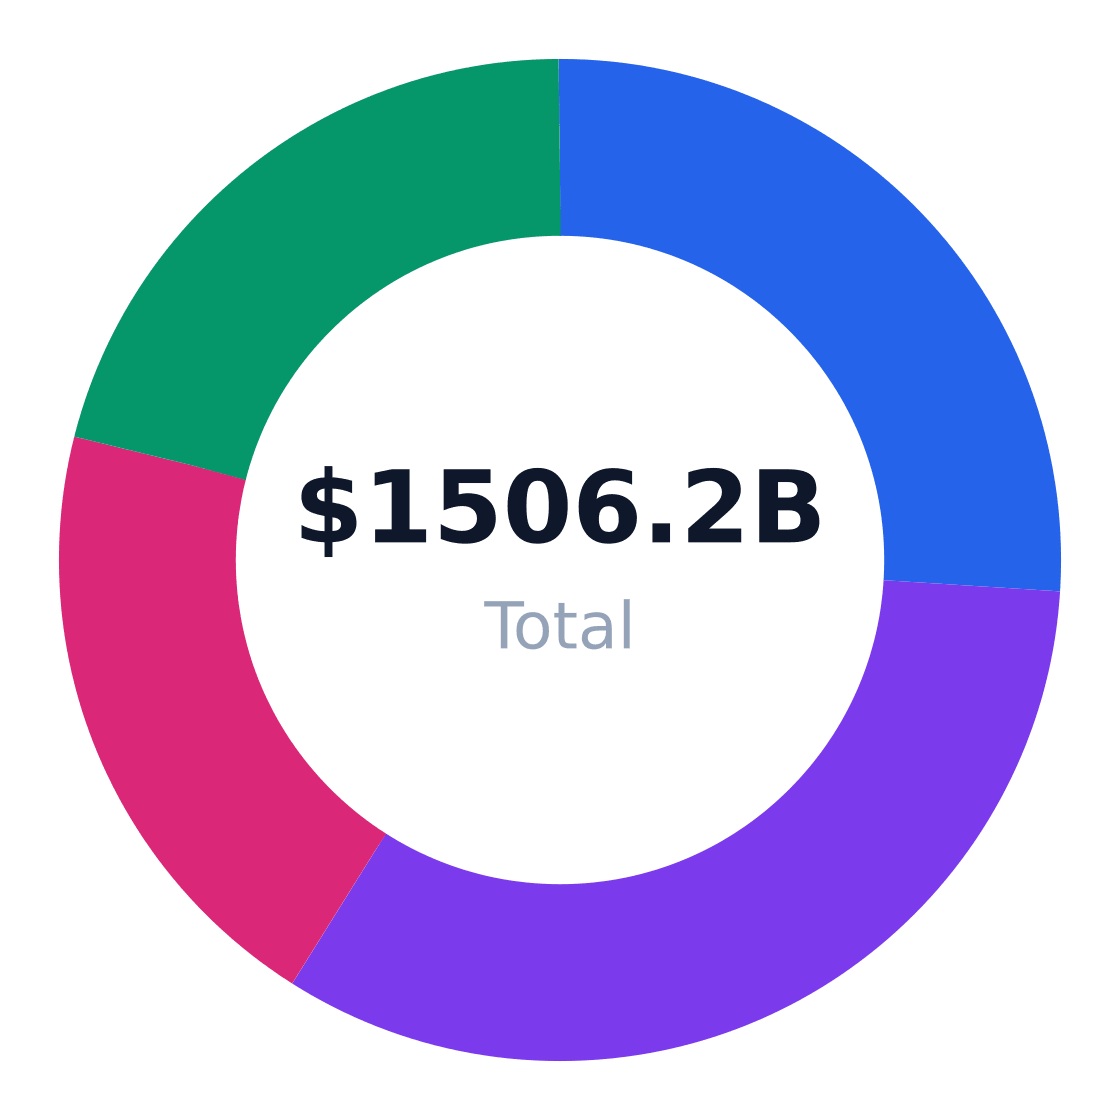
Regional Market Distribution
Revenue share by US region
Source: IBISWorld
Verdict: Viable entrants need $250M+ in deposits and 4% neighborhood penetration ($10.9M SOM) to offset compliance costs. The industry’s 6.1/10 health score (Mordor Intelligence) favors incumbents, but tech-enabled niche plays can capture 9-12% IRR in payments and urban banking.
Industry Research & Resources
The following industry databases and research resources support this bank industry analysis. Each link opens a specific report or data page (not a generic homepage).
- IBISWorld — ibisworld.com — IBISWorld industry report data for bank
- Sample Report Us — drive.kenmei.app — Published industry research for bank
- Research Quarterly Us Banks — sifma.org — Published industry research for bank
- Us Commercial Banking Market — mordorintelligence.com — Published industry research for bank
- Population In Occupied Housing Units By Tenure Renter Occupied — houstontx.gov — Published industry research for bank
Data Sources & Methodology
Market sizing (TAM, SAM, SOM), segmentation, competition, and equipment data come from Perplexity-sourced industry reports and trade publications. Optional U.S. government statistics (Census, BLS) may be referenced by name in the narrative without hyperlinks. TAM reflects the total U.S. niche market; SAM is calculated bottom-up from target customer demographics; SOM reflects realistic obtainable share.
Industry research links: Commercial Banking in the US Industry Analysis, 2026 · City of Houston Population Estimates by Age and Sex; Houston Planning & Development renter-occupied neighborhood data · ibisworld.com · ibisworld.com · ibisworld.com · ibisworld.com · drive.kenmei.app · sifma.org · mordorintelligence.com · ibisworld.com · data.houstontx.gov · houstontx.gov · vantainsights.com · marketresearch.com · laundrywizard.com · laundrywizard.com · startupcosthub.com · biz2credit.com · lendio.com · upmetrics.co · zenbusiness.com · clarifycapital.com · laundrybizcenter.com · trycents.com · startupcosthub.com · sudslist.com · washbizhub.com · fdic.gov · marketresearch.com · fdic.gov · fdic.gov · ibisworld.com · fdic.gov · ibisworld.com · help.ibisworld.com · scribd.com · newyorkfed.org
Get Your Copy Today
Download Bank Business Plan
Just Fill Up and Print